The sample copy of this report is available for access.
“Global Virtual Goods Market to reach a market value of USD 217540.10 Million by 2033 growing at a CAGR of %”
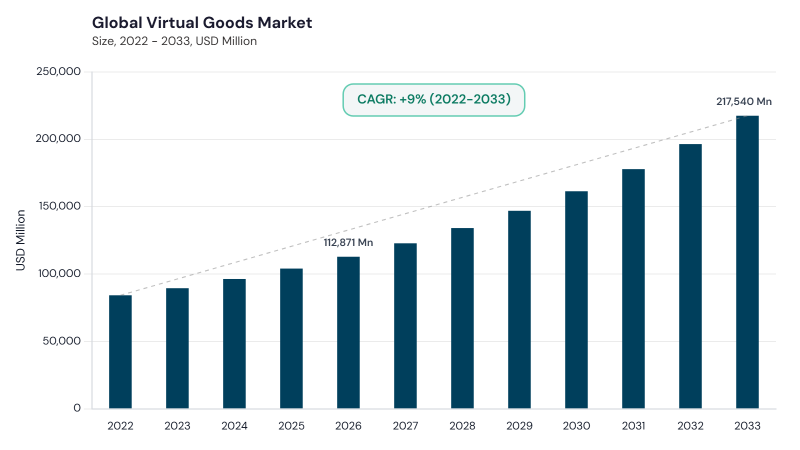
The Global Virtual Goods Market is expected to reach USD 217.5 billion by 2033, growing at a CAGR of 9.8% during (2026 – 2033).
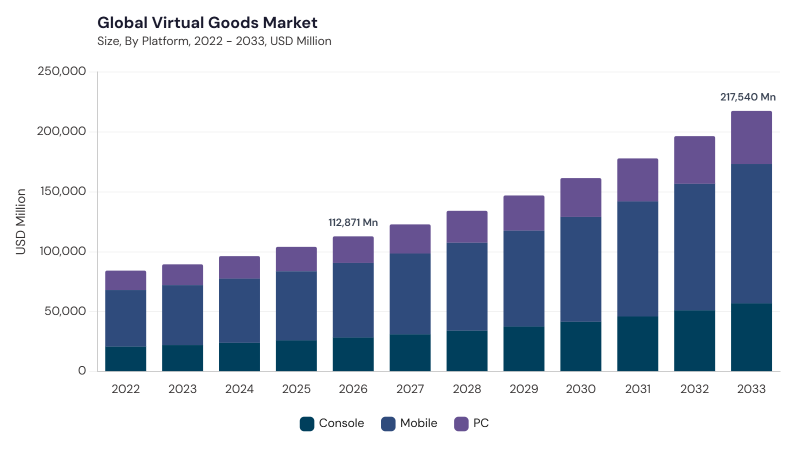
Expanding participation in online gaming, social platforms, virtual worlds, and digital communities is driving demand for virtual goods as users spend on personalization, social identity, status expression, enhanced gameplay, immersive experiences, avatars, skins, accessories, digital collectibles, virtual currencies, and other platform-based assets. Growth is further reinforced by free-to-play gaming models, mobile gaming, creator economies, live-service games, social commerce, and expanding digital ecosystems. The market originated in the early 2000s with online multiplayer games and virtual worlds, where users began purchasing avatars, decorative items, currencies, and digital assets.
Rising consumer engagement in gaming, virtual communities, digital entertainment, and social platforms is increasing demand for virtual goods that support identity, interaction, achievement, and personalization. Free-to-play and live-service models continue to expand recurring spending through skins, passes, virtual currencies, limited-time items, collectibles, and event-based rewards. Mobile gaming is widening access to virtual goods, while console and PC ecosystems support high-value digital economies through downloadable content, marketplaces, and persistent player inventories. Creator economies and user-generated content are adding new supply channels as users and independent creators design and monetize digital assets.
Competition is intense and shaped by user engagement, content quality, exclusive intellectual property, platform scale, creator tools, and monetization design. Leading companies compete through game ecosystems, virtual currencies, digital marketplaces, seasonal content, collectible mechanics, user-generated content, and limited-edition collaborations. Global gaming and platform companies benefit from large user bases, strong franchises, and integrated payment systems, while regional players and independent developers compete through localized content and niche communities. Brand collaborations with entertainment, sports, music, fashion, and consumer companies are becoming important for differentiation.
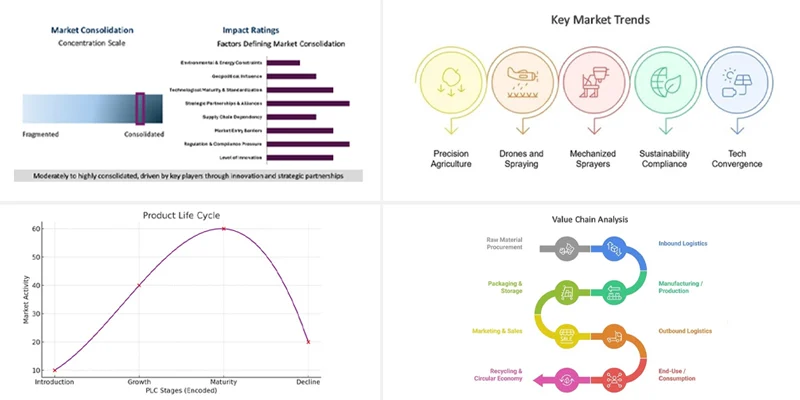
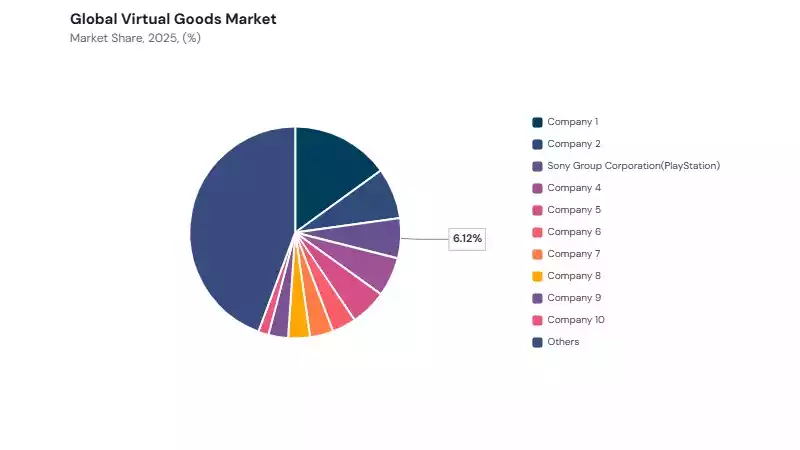
The Virtual Goods Market is highly competitive and moderately fragmented, with leading gaming, social, mobile, console, and PC platform companies competing through digital economies and recurring engagement models. Tencent, NetEase, Sony, Roblox, Microsoft, Electronic Arts, Epic Games, Take-Two, Scopely, and Valve maintain strong positions across in-game content, virtual currencies, cosmetics, marketplaces, digital collectibles, and creator-led economies. Competitive strength is shaped by franchise depth, user base scale, marketplace design, platform stickiness, digital payment access, live operations, and content refresh frequency. Others remain significant due to the large number of mobile publishers, regional gaming firms, social platforms, metaverse environments, and independent developers monetizing digital goods.
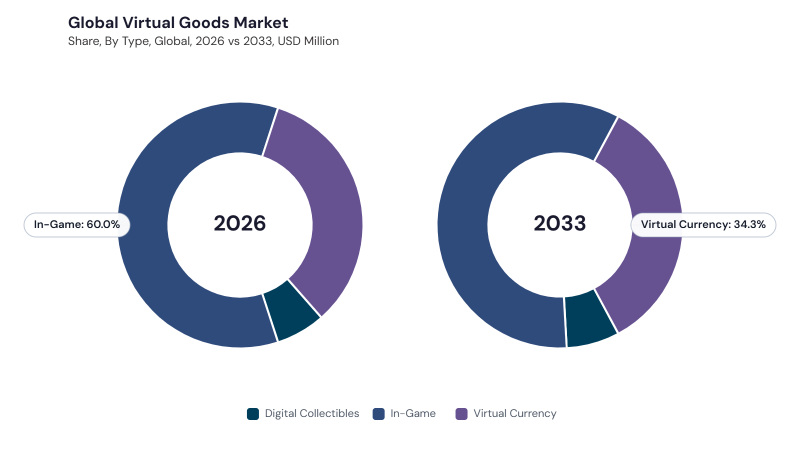
Based on type, the market is segmented into In-Game, Virtual Currency, and Digital Collectibles. The In-Game market dominated the Global Virtual Goods Market by Type in 2025, and would continue to be a dominant market till 2033; thereby, achieving a market value of USD 127.7 billion by 2033, growing at a CAGR of 9.5 % during the forecast period. The Virtual Currency market is expected to witness a CAGR of 10.2% during (2026 - 2033). The Digital Collectibles market is expected to witness a CAGR of 11% during (2026 - 2033).
In-game virtual goods include skins, weapons, characters, power-ups, accessories, emotes, and customization items that enhance gameplay and help users express identity within digital environments. These goods are strongly linked to live-service games, esports, seasonal content, and community-driven engagement. Virtual currency supports platform-based transactions by allowing users to purchase premium content, unlock features, access events, and participate in internal economies. It also helps publishers simplify monetization and encourage repeat purchases. Digital collectibles focus on scarcity, uniqueness, ownership, and tradability, often connected with limited-edition items, NFTs, fandom, and virtual memorabilia. Together, these categories show how virtual goods combine utility, personalization, status, entertainment, and digital ownership.
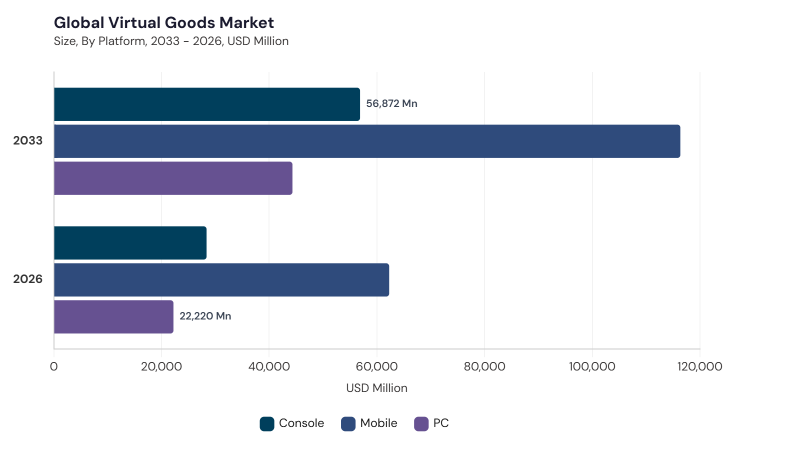
Based on platform, the market is segmented into Mobile, Console, and PC. The Mobile market dominated the Global Virtual Goods Market by Platform in 2025, and would continue to be a dominant market till 2033; thereby, achieving a market value of USD 116.3 billion by 2033, growing at a CAGR of 9.3 % during the forecast period. The Console market is expected to witness a CAGR of 10.4% during (2026 - 2033). Additionally, The PC market is expected to witness highest CAGR of 10.4% during (2026 - 2033).
Mobile platforms dominate adoption because smartphones enable convenient in-app purchases, free-to-play gaming, social entertainment, and frequent microtransactions across large user bases. Mobile ecosystems support virtual currencies, event-based purchases, avatar items, collectibles, and casual gaming monetization. Console platforms remain important for premium gaming franchises, downloadable content, season passes, cosmetics, battle passes, and platform-integrated stores. These ecosystems benefit from loyal users, strong entertainment IP, and high-quality gaming experiences. PC platforms support multiplayer games, digital marketplaces, modding communities, competitive gaming, creator content, and persistent virtual economies. Across all platforms, cross-platform accounts, shared inventories, and synchronized digital identities are becoming increasingly important as users expect virtual goods to move with them across devices and ecosystems.
Free Valuable Insights: Virtual Goods Market Size to reach $217.5 Billion by 2033
Region-wise, the Virtual Goods Market is analyzed across North America, Europe, Asia Pacific, and LAMEA. The North America market dominated the Global Virtual Goods Market by Region in 2025, thereby, achieving a market value of USD 79.3 billion by 2033, growing at a CAGR of 9.3 % during the forecast period. The Asia Pacific market is expected to witness a CAGR of 10.3% during (2026 - 2033). Additionally, The Europe market is expected to witness a CAGR of 9.5% during (2026 - 2033).
North America leads due to high spending on digital entertainment, established gaming ecosystems, advanced monetization models, and widespread acceptance of in-app purchases. Asia Pacific is a major demand center, supported by a large gaming population, mobile-first behavior, strong online entertainment ecosystems, and high engagement with virtual currencies and in-game content. Europe shows steady adoption through digital gaming, subscription entertainment, virtual content purchasing, and platform-based economies, while consumer-protection and digital-platform regulations influence monetization practices. LAMEA is smaller but expanding as smartphone penetration, digital payment access, localized content, and online gaming communities continue to improve. Regional growth depends on payment infrastructure, gaming culture, device access, localization, regulatory clarity, and publisher investment.
| Report Attribute | Details |
|---|---|
| Market size value in 2026 | USD 112.8 billion |
| Market size forecast in 2033 | USD 217.5 billion |
| Base Year | 2025 |
| Historical Period | 2022 to 2024 |
| Forecast Period | 2026 to 2033 |
| Revenue Growth Rate | CAGR of 9.8% from 2026 to 2033 |
| Number of Pages | 400 |
| Tables | 270 |
| Report Coverage | Market Trends, Revenue Estimation and Forecast, Segmentation Analysis, Regional and Country Breakdown, Competitive Landscape, Market Share Analysis, Company Profiling, Companies Strategic Developments, SWOT Analysis, Product Life Cycle Analysis, Value Chain Analysis, Market Consolidation Analysis, Key Customer Criteria, Pandemic Impact Analysis, and Winning Imperatives |
| Segments Covered | Type, Platform, and Geography |
| Country Scope |
|
| Companies Included | Tencent; NetEase; Sony; Roblox; Microsoft; Electronic Arts; Epic Games; Take-Two; Scopely; Valve |
By Type
By Platform
By Geography
Projected to reach USD 217.5 billion by 2033, growing at 9.8% CAGR during 2026-2033.
In-Game segment leads, expected to hit USD 127.7 billion by 2033.
Tencent, NetEase, Sony, Roblox, Microsoft, Electronic Arts, Epic Games, Take-Two, Scopely, Valve dominate the market.
Mobile platforms lead, anticipated to reach USD 116.3 billion by 2033.
North America leads, expected to achieve USD 79.3 billion by 2033.
Immersive consumer experiences and social media integration are key growth drivers.
Our team of dedicated experts can provide you with attractive expansion opportunities for your business.






 Unique Offerings
