The sample copy of this report is available for access.
The Asia Pacific Virtual Goods Market is expected to reach USD 59.0 billion by 2030, growing at a CAGR of 10.3% during (2026 - 2033).
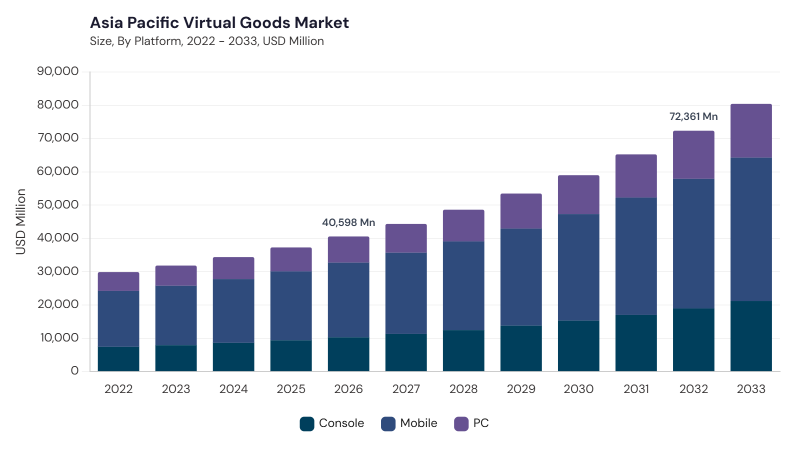
The Asia Pacific Virtual Goods Market originated with the emergence of online gaming and digital content consumption in the early 2000s, initially developing through simple cosmetic items and virtual item exchanges in multiplayer games and social gaming platforms. As internet penetration, smartphone adoption, mobile connectivity, secure digital payments, blockchain, and AI-based personalization improved, virtual goods moved from basic in-game items to more complex digital assets with broader commercial value. The market has since evolved into a large digital economy supported by recurring in-app transactions, virtual currencies, digital collectibles, immersive content, and seamless payment experiences across multiple platforms.
Current market growth is shaped by mobile-first gaming, blockchain and NFT integration, regulatory development, AI-driven personalization, esports, streaming, and localized digital commerce. Mobile gaming has expanded virtual goods consumption across broader demographics, while blockchain-enabled ownership is improving transparency, secondary trading, and user control of digital assets. At the same time, digital wallets, QR-based payments, cloud gaming, 5G networks, culturally localized content, and secure transaction systems are strengthening user engagement and monetization across diverse Asia Pacific markets.
Based on Type, the market is segmented into In-Game, Virtual Currency, and Digital Collectibles. The In-Game market dominated the Asia Pacific Virtual Goods Market by Type in 2025, and would continue to be a dominant market till 2033; thereby, achieving a market value of USD 35.0 billion by 2030, growing at a CAGR of 9.9 % during the forecast period. The Virtual Currency market is expected to witness a CAGR of 10.6% during (2026 - 2033). The Digital Collectibles market is expected to witness a CAGR of 11.5% during (2026 - 2033).
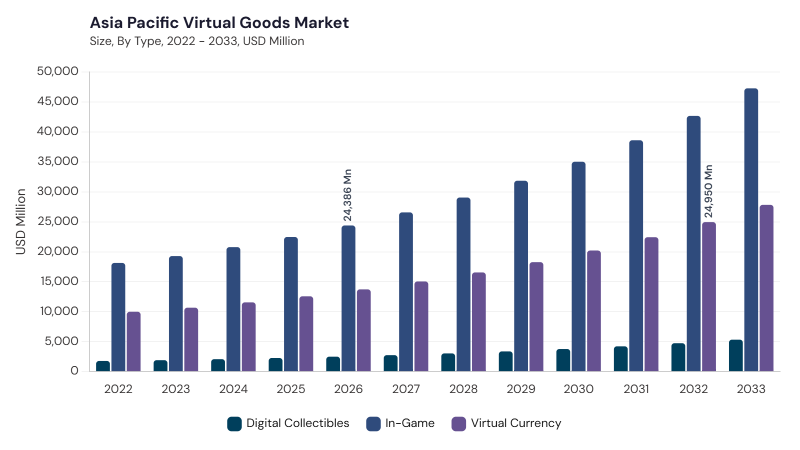
In-Game virtual goods remain central as users purchase avatars, skins, weapons, equipment, customization features, power-ups, and event-based content that enhance gameplay, identity expression, and community participation. Virtual Currency maintains a considerable role as digital tokens, game credits, social app coins, and platform-specific currencies simplify transactions, gifting, and purchases across games and virtual environments. Digital Collectibles hold a promising position through NFTs, limited-edition avatars, digital art, memorabilia, gaming-linked collectibles, and blockchain-enabled assets that emphasize provenance, exclusivity, ownership, and secondary-market participation.
Based on Platform, the market is segmented into Mobile, Console, and PC. Mobile platforms remain the main channel for virtual goods consumption due to smartphone penetration, affordable internet access, mobile payments, social apps, digital gifts, super-app ecosystems, and microtransaction-based gaming models.
Console platforms maintain a considerable share through premium gaming ecosystems, downloadable content, season passes, exclusive customization, cross-platform play, and high-quality gaming experiences. PC platforms hold a promising presence through competitive gaming, esports communities, MMORPGs, internet cafés, digital storefronts, modding ecosystems, persistent virtual worlds, user-driven customization, and blockchain or NFT-based ownership models.
Free Valuable Insights: Virtual Goods Market is Predicted to reach USD 217.5 Billion billion by 2033, at a CAGR of 9.8%
Based on Country, the market is segmented into China, Japan, India, South Korea, Singapore, Malaysia, and Rest of Asia Pacific. The China market dominated the Asia Pacific Virtual Goods Market by Country in 2025, and would continue to be a dominant market till 2033; thereby, achieving a market value of USD 27.3 billion by 2030, growing at a CAGR of 9.1 % during the forecast period. The Japan market is expected to witness a CAGR of 9.4% during (2026 - 2033). Additionally, The India market is expected to witness a CAGR of 12.2% during (2026 - 2033).
China is shaped by mobile gaming, blockchain and NFT ownership, advanced payment infrastructure, and regulatory tightening, while Japan reflects blockchain-based ownership, cross-platform interoperability, localized virtual goods, digital fashion, NFTs, and virtual real estate. India is driven by affordable smartphones, mobile broadband, secure in-app payments, NFTs, metaverse initiatives, AI personalization, and localized content strategies. South Korea is supported by broadband-led gaming culture, blockchain and NFTs, mobile-first gaming, AR applications, and stronger digital asset regulation, whereas Singapore is influenced by secure transaction platforms, blockchain provenance, metaverse expansion, AI-based customization, and multicultural localization. Malaysia is progressing through mobile broadband, digital wallets, localized content, NFTs, secure transaction infrastructure, and community-led engagement, while Rest of Asia Pacific is shaped by mobile-first behavior, AR/VR adoption, blockchain-enabled ownership, regional localization, and cross-border digital transactions.
By Type
By Platform
By Country
Set to reach $59.0 Billion by 2030, growing at 10.3% CAGR during 2026-2033.
China leads with a market value of USD 27.3 billion by 2030, growing at a 9.1% CAGR during 2026-2033.
Rising demand for in-game purchases, reaching USD 35.0 billion by 2030 at a 9.9% CAGR during 2026-2033.
Digital Collectibles are expected to grow at an 11.5% CAGR during 2026-2033.
The India market is expected to witness a CAGR of 12.2% during 2026-2033.
Our team of dedicated experts can provide you with attractive expansion opportunities for your business.




 Unique Offerings
