North America Virtual Goods Market Size, Share & Industry Analysis Report By Type (In-Game, and Virtual Currency), By Platform (Mobile, and Console), By Country Outlook and Forecast, 2026 - 2033
Published Date : 25-Oct-2026 |
Pages: 130 |
Report Format: PDF + Excel |
COVID-19 Impact on the North America Virtual Goods Market
The North America Virtual Goods Market is expected to reach USD 72.0 billion by 2032, growing at a CAGR of 9.3% during (2026 - 2033).
The North America Virtual Goods Market originated from the early growth of digital entertainment and interactive media, where virtual goods first appeared as simple add-ons in online games and social platforms. Initial adoption centered on digital upgrades, cosmetic enhancements, and basic in-game assets, while improvements in internet infrastructure, mobile access, digital payments, immersive technologies, blockchain, and NFT-related ownership models expanded the market beyond gaming. The market has since developed into a broader digital economy covering gaming, metaverse platforms, virtual events, social commerce, personalization, digital ownership, and secondary trading ecosystems.
Current market growth is shaped by customization, AR and VR integration, blockchain-enabled ownership, metaverse platforms, and social digital identities. Consumers are increasingly using virtual goods for self-expression, avatar personalization, community status, and interactive digital experiences. Secure ownership protocols, AI-driven personalization, cross-platform compatibility, digital collectibles, and play-to-earn or decentralized marketplace models are also influencing how platforms monetize engagement and build stronger virtual economies.
Type Outlook
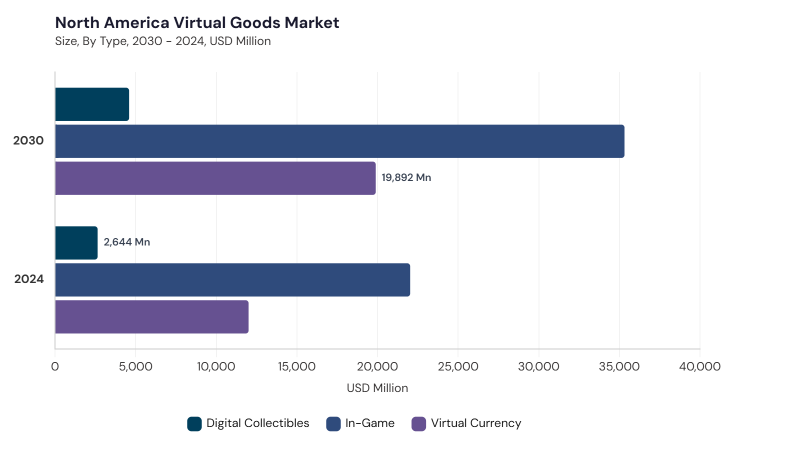
Based on Type, the market is segmented into In-Game, Virtual Currency, and Digital Collectibles. The In-Game market dominated the North America Virtual Goods Market by Type in 2025, and would continue to be a dominant market till 2033; thereby, achieving a market value of USD 42.2 billion by 2032, growing at a CAGR of 8.9 % during the forecast period. The Virtual Currency market is expected to witness a CAGR of 9.6% during (2026 - 2033). The Digital Collectibles market is expected to witness a CAGR of 10.4% during (2026 - 2033).
In-Game virtual goods remain central as players purchase skins, outfits, weapons, power-ups, event-based items, and other enhancements that improve personalization, engagement, and identity expression across gaming platforms. Virtual Currency maintains a considerable role as users purchase platform-specific coins, tokens, or credits to unlock premium content, complete in-app transactions, and participate in digital economies. Digital Collectibles hold a promising position through scarce or distinctive assets such as digital art, avatars, trading cards, gaming memorabilia, NFT-linked items, and collectibles tied to entertainment communities, ownership verification, and online identities.
Platform Outlook
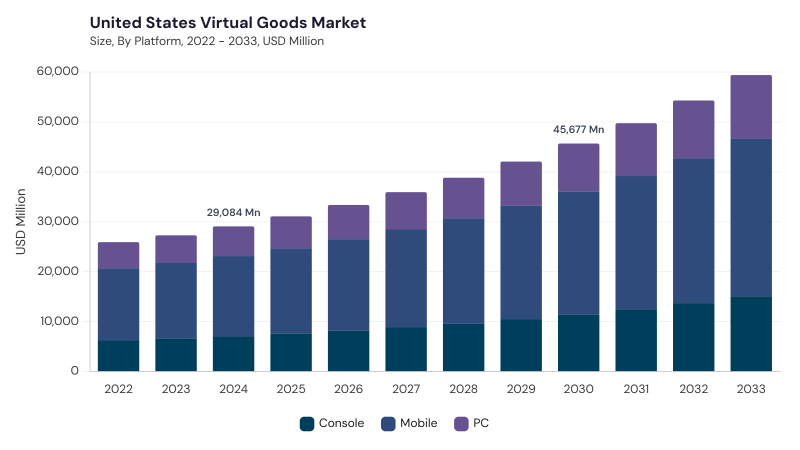
Based on Platform, the market is segmented into Mobile, Console, and PC. Mobile platforms remain highly important because casual gaming, social apps, mobile payments, short-session engagement, AI-based offers, and free-to-play models support frequent purchases of virtual currencies, cosmetic items, access enhancements, social filters, and event tokens.
Console platforms maintain a considerable share through premium franchises, downloadable content, expansion packs, exclusive branded items, subscription bundles, season-based content, and connected multiplayer ecosystems. PC platforms hold a promising position through highly engaged gaming communities, digital distribution platforms, user-generated content, modding ecosystems, virtual events, NFTs, esports, live streaming influence, and customizable virtual assets.
Free Valuable Insights: The Global Virtual Goods Market will hit USD 217.5 Billion billion by 2033, at a CAGR of 9.8%
Country Outlook
Based on Country, the market is segmented into US, Canada, Mexico, and Rest of North America. The US market dominated the North America Virtual Goods Market by Country in 2025, and would continue to be a dominant market till 2033; thereby, achieving a market value of USD 54.2 billion by 2032, growing at a CAGR of 8.6 % during the forecast period. The Canada market is expected to witness a CAGR of 12.1% during (2026 - 2033). Additionally, The Mexico market is expected to witness a CAGR of 10.9% during (2026 - 2033).
The US is shaped by online gaming, social media platforms, blockchain and NFT ownership, metaverse expansion, digital asset tokenization, and immersive virtual goods ecosystems, while Canada reflects multiplayer gaming, mobile gaming, secure payments, blockchain integration, gamified social environments, and compliance-led digital asset adoption. Mexico is driven by mobile technology, broadband expansion, blockchain-enabled asset verification, AI personalization, regulatory adaptation, and localized virtual goods offerings, whereas Rest of North America is supported by smartphone penetration, mobile gaming, social networking apps, blockchain-enabled virtual assets, metaverse environments, personalization, and user-generated content.
List of Key Companies Profiled
- Tencent
- NetEase
- Sony
- Roblox
- Microsoft
- Electronic Arts
- Epic Games
- Take-Two
- Scopely
- Valve
North America Virtual Goods Market Report Segmentation
By Type
- In-Game
- Virtual Currency
- Digital Collectibles
By Platform
- Mobile
- Console
- PC
By Country
- US
- Canada
- Mexico
- Rest of North America
1.1 Market Overview
1.2 Key Factors Impacting Market
1.2.1 Market Drivers
1.2.2 Market Restraints
1.2.3 Market Opportunities
1.2.4 Market Challenges
1.2.5 Market Trends
1.2.6 State of Competition
1.2.7 Market Consolidation
1.2.8 Key Customer Criteria
1.3 Product Life Cycle
1.4 Segmentation By Type
1.4.1 Virtual Currency
1.4.2 Digital Collectibles
1.4.3 In-Game Items
1.5 Segmentation By Platform
1.5.1 Mobile
1.5.2 Console
1.5.3 PC
1.6 Segmentation By Country
1.6.1 US
1.6.1.1 Segmentation By Type
1.6.1.1.1 In-Game
1.6.1.1.2 Virtual Currency
1.6.1.1.3 Digital Collectibles
1.6.1.2 Segmentation By Platform
1.6.1.2.1 Mobile
1.6.1.2.2 Console
1.6.1.2.3 PC
1.6.2 Canada
1.6.2.1 Segmentation By Type
1.6.2.1.1 In-Game
1.6.2.1.2 Virtual Currency
1.6.2.1.3 Digital Collectibles
1.6.2.2 Segmentation By Platform
1.6.2.2.1 Mobile
1.6.2.2.2 Console
1.6.2.2.3 PC
1.6.3 Mexico
1.6.3.1 Segmentation By Type
1.6.3.1.1 In-Game
1.6.3.1.2 Virtual Currency
1.6.3.1.3 Digital Collectibles
1.6.3.2 Segmentation By Platform
1.6.3.2.1 Mobile
1.6.3.2.2 Console
1.6.3.2.3 PC
1.6.4 Rest of North America
1.6.4.1 Segmentation By Type
1.6.4.1.1 In-Game
1.6.4.1.2 Virtual Currency
1.6.4.1.3 Digital Collectibles
1.6.4.2 Segmentation By Platform
1.6.4.2.1 Mobile
1.6.4.2.2 Console
1.6.4.2.3 PC
Chapter 2. Company Snapshots
2.1 Tencent
2.1.1 Business Overview
2.1.2 Key Information
2.1.3 Company Focus on Virtual Goods Market
2.1.4 Strategic Insights
2.1.5 Strategy Deployed
2.1.6 Product & Service Portfolio
2.1.7 Technology & Innovation Focus
2.1.8 SWOT Analysis
2.1.9 Key Differentiators
2.1.10 Future Outlook
2.2 NetEase
2.2.1 Business Overview
2.2.2 Key Information
2.2.3 Company Focus on Virtual Goods Market
2.2.4 Strategic Insights
2.2.5 Strategy Deployed
2.2.6 Portfolio Matrix
2.2.7 SWOT Analysis
2.2.8 Key Differentiators
2.2.9 Future Outlook
2.3 Sony
2.3.1 Business Overview
2.3.2 Key Information
2.3.3 Company Focus on Virtual Goods Market
2.3.4 Strategic Insights / Strategy Deployed
2.3.5 Portfolio Matrix
2.3.6 SWOT Analysis
2.3.7 Key Differentiators
2.3.8 Future Outlook
2.4 Roblox
2.4.1 Business Overview
2.4.2 Key Information
2.4.3 Company Focus on Virtual Goods Market
2.4.4 Strategic Insights
2.4.5 Strategy Deployed
2.4.6 Portfolio Matrix
2.4.7 SWOT Analysis
2.4.8 Key Differentiators
2.4.9 Future Outlook
2.5 Microsoft
2.5.1 Business Overview
2.5.2 Key Information
2.5.3 Company Focus on Virtual Goods Market
2.5.4 Strategic Insights / Strategy Deployed
2.5.5 Portfolio Matrix
2.5.6 SWOT Analysis
2.5.7 Key Differentiators
2.5.8 Future Outlook
2.6 Electronic Arts
2.6.1 Business Overview
2.6.2 Key Information
2.6.3 Company Focus on Virtual Goods Market
2.6.4 Strategic Insights / Strategy Deployed
2.6.5 Portfolio Matrix
2.6.6 SWOT Analysis
2.6.7 Key Differentiators
2.6.8 Future Outlook
2.7 Epic Games
2.7.1 Business Overview
2.7.2 Key Information
2.7.3 Company Focus on Virtual Goods Market
2.7.4 Strategic Insights / Strategy Deployed
2.7.5 Portfolio Matrix
2.7.6 SWOT Analysis
2.7.7 Key Differentiators
2.7.8 Future Outlook
2.8 Take-Two
2.8.1 Business Overview
2.8.2 Key Information
2.8.3 Company Focus on Virtual Goods Market
2.8.4 Strategic Insights / Strategy Deployed
2.8.5 Portfolio Matrix
2.8.6 SWOT Analysis
2.8.7 Key Differentiators
2.8.8 Future Outlook
2.9 Scopely
2.9.1 Business Overview
2.9.2 Key Information
2.9.3 Company Focus on Virtual Goods Market
2.9.4 Strategic Insights / Strategy Deployed
2.9.5 Portfolio Matrix
2.9.6 SWOT Analysis
2.9.7 Key Differentiators
2.9.8 Future Outlook
2.10 Valve
2.10.1 Business Overview
2.10.2 Key Information
2.10.3 Company Focus on Virtual Goods Market
2.10.4 Strategic Insights
2.10.5 Strategy Deployed
2.10.6 Portfolio Matrix
2.10.7 SWOT Analysis
2.10.8 Key Differentiators
2.10.9 Future Outlook
Table 1 North America Virtual Goods Market Market, 2022 - 2033, USD Million
Table 2 North America Virtual Goods Market Market by Platform, 2022 - 2033, USD Million
Table 3 North America Console Market, 2022 - 2033, USD Million
Table 4 North America Mobile Market, 2022 - 2033, USD Million
Table 5 North America PC Market, 2022 - 2033, USD Million
Table 6 North America Virtual Goods Market Market by Type, 2022 - 2033, USD Million
Table 7 North America Digital Collectibles Market, 2022 - 2033, USD Million
Table 8 North America In-Game Market, 2022 - 2033, USD Million
Table 9 North America Virtual Currency Market, 2022 - 2033, USD Million
Table 10 United States Virtual Goods Market Market, 2022 - 2033, USD Million
Table 11 United States Virtual Goods Market Market by Platform, 2022 - 2033, USD Million
Table 12 United States Console Market, 2022 - 2033, USD Million
Table 13 United States Mobile Market, 2022 - 2033, USD Million
Table 14 United States PC Market, 2022 - 2033, USD Million
Table 15 United States Virtual Goods Market Market by Type, 2022 - 2033, USD Million
Table 16 United States Digital Collectibles Market, 2022 - 2033, USD Million
Table 17 United States In-Game Market, 2022 - 2033, USD Million
Table 18 United States Virtual Currency Market, 2022 - 2033, USD Million
Table 19 Canada Virtual Goods Market Market, 2022 - 2033, USD Million
Table 20 Canada Virtual Goods Market Market by Platform, 2022 - 2033, USD Million
Table 21 Canada Console Market, 2022 - 2033, USD Million
Table 22 Canada Mobile Market, 2022 - 2033, USD Million
Table 23 Canada PC Market, 2022 - 2033, USD Million
Table 24 Canada Virtual Goods Market Market by Type, 2022 - 2033, USD Million
Table 25 Canada Digital Collectibles Market, 2022 - 2033, USD Million
Table 26 Canada In-Game Market, 2022 - 2033, USD Million
Table 27 Canada Virtual Currency Market, 2022 - 2033, USD Million
Table 28 Mexico Virtual Goods Market Market, 2022 - 2033, USD Million
Table 29 Mexico Virtual Goods Market Market by Platform, 2022 - 2033, USD Million
Table 30 Mexico Console Market, 2022 - 2033, USD Million
Table 31 Mexico Mobile Market, 2022 - 2033, USD Million
Table 32 Mexico PC Market, 2022 - 2033, USD Million
Table 33 Mexico Virtual Goods Market Market by Type, 2022 - 2033, USD Million
Table 34 Mexico Digital Collectibles Market, 2022 - 2033, USD Million
Table 35 Mexico In-Game Market, 2022 - 2033, USD Million
Table 36 Mexico Virtual Currency Market, 2022 - 2033, USD Million
Table 37 Rest of North America Virtual Goods Market Market, 2022 - 2033, USD Million
Table 38 Rest of North America Virtual Goods Market Market by Platform, 2022 - 2033, USD Million
Table 39 Rest of North America Console Market, 2022 - 2033, USD Million
Table 40 Rest of North America Mobile Market, 2022 - 2033, USD Million
Table 41 Rest of North America PC Market, 2022 - 2033, USD Million
Table 42 Rest of North America Virtual Goods Market Market by Type, 2022 - 2033, USD Million
Table 43 Rest of North America Digital Collectibles Market, 2022 - 2033, USD Million
Table 44 Rest of North America In-Game Market, 2022 - 2033, USD Million
Table 45 Rest of North America Virtual Currency Market, 2022 - 2033, USD Million
List of Figures
FIG 1 Key Factors Impacting Market
FIG 2 Market Consolidation
FIG 3 Key Customer Criteria
FIG 4 Product Life Cycle
FIG 5 North America Virtual Goods Market Market, 2022 - 2033, USD Million
FIG 6 North America Virtual Goods Market Market by Platform, 2022 - 2033, USD Million
FIG 7 North America Console Market, 2022 - 2033, USD Million
FIG 8 North America Mobile Market, 2022 - 2033, USD Million
FIG 9 North America PC Market, 2022 - 2033, USD Million
FIG 10 North America Virtual Goods Market Market by Type, 2022 - 2033, USD Million
FIG 11 North America Digital Collectibles Market, 2022 - 2033, USD Million
FIG 12 North America In-Game Market, 2022 - 2033, USD Million
FIG 13 North America Virtual Currency Market, 2022 - 2033, USD Million
FIG 14 United States Virtual Goods Market Market, 2022 - 2033, USD Million
FIG 15 United States Virtual Goods Market Market by Platform, 2022 - 2033, USD Million
FIG 16 United States Console Market, 2022 - 2033, USD Million
FIG 17 United States Mobile Market, 2022 - 2033, USD Million
FIG 18 United States PC Market, 2022 - 2033, USD Million
FIG 19 United States Virtual Goods Market Market by Type, 2022 - 2033, USD Million
FIG 20 United States Digital Collectibles Market, 2022 - 2033, USD Million
FIG 21 United States In-Game Market, 2022 - 2033, USD Million
FIG 22 United States Virtual Currency Market, 2022 - 2033, USD Million
FIG 23 Canada Virtual Goods Market Market, 2022 - 2033, USD Million
FIG 24 Canada Virtual Goods Market Market by Platform, 2022 - 2033, USD Million
FIG 25 Canada Console Market, 2022 - 2033, USD Million
FIG 26 Canada Mobile Market, 2022 - 2033, USD Million
FIG 27 Canada PC Market, 2022 - 2033, USD Million
FIG 28 Canada Virtual Goods Market Market by Type, 2022 - 2033, USD Million
FIG 29 Canada Digital Collectibles Market, 2022 - 2033, USD Million
FIG 30 Canada In-Game Market, 2022 - 2033, USD Million
FIG 31 Canada Virtual Currency Market, 2022 - 2033, USD Million
FIG 32 Mexico Virtual Goods Market Market, 2022 - 2033, USD Million
FIG 33 Mexico Virtual Goods Market Market by Platform, 2022 - 2033, USD Million
FIG 34 Mexico Console Market, 2022 - 2033, USD Million
FIG 35 Mexico Mobile Market, 2022 - 2033, USD Million
FIG 36 Mexico PC Market, 2022 - 2033, USD Million
FIG 37 Mexico Virtual Goods Market Market by Type, 2022 - 2033, USD Million
FIG 38 Mexico Digital Collectibles Market, 2022 - 2033, USD Million
FIG 39 Mexico In-Game Market, 2022 - 2033, USD Million
FIG 40 Mexico Virtual Currency Market, 2022 - 2033, USD Million
FIG 41 Rest of North America Virtual Goods Market Market, 2022 - 2033, USD Million
FIG 42 Rest of North America Virtual Goods Market Market by Platform, 2022 - 2033, USD Million
FIG 43 Rest of North America Console Market, 2022 - 2033, USD Million
FIG 44 Rest of North America Mobile Market, 2022 - 2033, USD Million
FIG 45 Rest of North America PC Market, 2022 - 2033, USD Million
FIG 46 Rest of North America Virtual Goods Market Market by Type, 2022 - 2033, USD Million
FIG 47 Rest of North America Digital Collectibles Market, 2022 - 2033, USD Million
FIG 48 Rest of North America In-Game Market, 2022 - 2033, USD Million
FIG 49 Rest of North America Virtual Currency Market, 2022 - 2033, USD Million