LAMEA Ride-Hailing Market Size, Share & Industry Analysis Report By Booking Channel (App-Based, and Voice / Phone), By Propulsion Type (ICE, and Battery-Electric), By End User (Personal, and Corporate / Institutional), By Vehicle Type (Passenger Cars, and Two-Wheelers), By Service Type, By Country Outlook and Forecast, 2026 - 2033
Published Date : 02-Sep-2026 |
Pages: 347 |
Report Format: PDF + Excel |
COVID-19 Impact on the LAMEA Ride-Hailing Market
The LAMEA Ride-Hailing Market is expected to reach USD 19.0 billion by 2029, growing at a CAGR of 17.7% during (2026 – 2033).
The LAMEA Ride-Hailing Market originated from the early use of app-based mobility platforms across Latin America, the Middle East, and Africa, where urban commuters needed more reliable alternatives to traditional taxi services. Early adoption was supported by smartphones, GPS tools, and mobile internet, which helped connect riders and drivers through on-demand platforms. As digital payments, real-time tracking, driver ratings, and app-based customer support improved, ride-hailing became more trusted in major cities. The entry of global operators and regional platforms further formalized the market through stronger service standards and localized operations. Today, the market reflects a diverse mobility ecosystem shaped by city congestion, digital inclusion, affordability needs, and regulatory development.
The current LAMEA Ride-Hailing Market is shaped by smartphone penetration, digital payments, urbanization, AI-based route optimization, electric mobility, and localized platform strategies. Operators are adapting to different income levels, languages, payment habits, road conditions, and regulatory systems across the region. Digital wallets, mobile money, app localization, driver verification, and safety tools are improving user confidence and service accessibility. Electric and hybrid vehicle adoption is growing gradually in major cities as governments and operators focus on cleaner transport. These trends are making ride-hailing an important part of flexible urban mobility while supporting new models such as carpooling, subscriptions, and multimodal transport.
Booking Channel Outlook
Based on Booking Channel, the market is segmented into App-Based and Voice / Phone. The App-Based market dominated the LAMEA Ride-Hailing Market by Booking Channel in 2025, and would continue to be a dominant market till 2033; thereby, achieving a market value of USD 16.3 billion by 2029, growing at a CAGR of 17.5 % during the forecast period. The Voice / Phone market is expected to witness a CAGR of 19.4% during (2026 - 2033).
App-based booking leads due to rising smartphone usage, improving broadband connectivity, GPS-enabled ride tracking, fare estimates, driver ratings, and expanding digital payment ecosystems. It is widely used in major cities where consumers prefer faster booking, transparent pricing, and convenient on-demand transport. Voice and phone booking remains relevant in semi-urban and rural areas, among users with limited smartphone access, and in markets where traditional taxi dispatch services are still common. This channel supports accessibility for digitally underserved users while app-based platforms continue to dominate core urban demand.
Propulsion Type Outlook
Based on Propulsion Type, the market is segmented into ICE, Battery-Electric, Hybrid, and CNG/LPG. The ICE market dominated the LAMEA Ride-Hailing Market by Propulsion Type in 2025, and would continue to be a dominant market till 2033; thereby, achieving a market value of USD 13.3 billion by 2029, growing at a CAGR of 17.3 % during the forecast period. The Battery-Electric market is expected to witness a CAGR of 18.2% during (2026 - 2033). The CNG / LPG market is expected to witness a CAGR of 19.2% during (2026 - 2033).
ICE vehicles lead due to affordability, widespread availability, mature refueling networks, and suitability across most urban and peri-urban ride-hailing operations in the region. Battery-electric vehicles are gradually expanding as sustainability initiatives, charging infrastructure investments, and urban emission concerns increase in major markets. Hybrid vehicles are gaining traction among fleet operators seeking better fuel efficiency without full dependence on charging networks. CNG/LPG vehicles remain smaller but useful in countries with alternative fuel infrastructure, lower fuel costs, and supportive clean transport policies.
End User Outlook
Based on End User, the market is segmented into Personal and Corporate / Institutional. The Personal market dominated the LAMEA Ride-Hailing Market by End User in 2025, and would continue to be a dominant market till 2033; thereby, achieving a market value of USD 12.2 billion by 2029, growing at a CAGR of 17.3 % during the forecast period. The Corporate / Institutional market is expected to witness a CAGR of 18.6% during (2026 - 2033).
Personal users lead due to rising urbanization, growing smartphone access, limited public transport reliability in several cities, and increasing preference for affordable point-to-point travel. This segment uses ride-hailing for daily commuting, shopping, social trips, airport transfers, and flexible urban mobility. Corporate and institutional users are expanding as businesses use digital transport platforms for employee commuting, client travel, airport transfers, and event mobility. Centralized billing, scheduled rides, safety tracking, and mobility reporting are strengthening adoption among organizations.
Vehicle Type Outlook
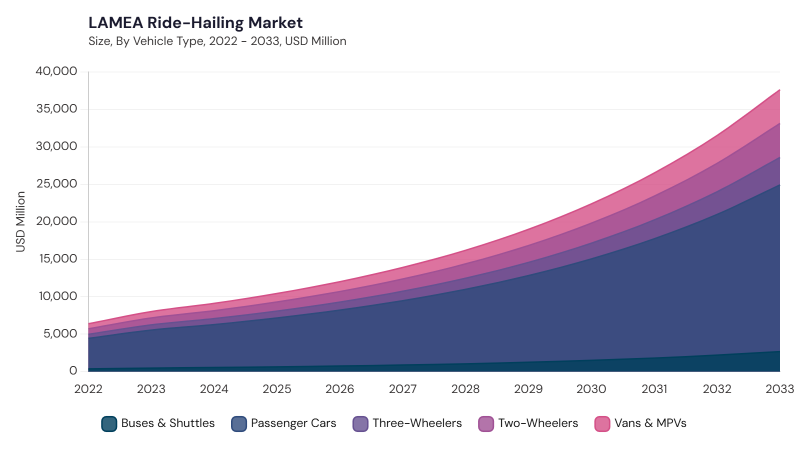
Based on Vehicle Type, the market is segmented into Passenger Cars, Two-Wheelers, Vans & MPVs, Three-Wheelers, and Buses & Shuttles. Passenger cars lead due to their broad availability, comfort, safety perception, and suitability for everyday urban passenger transport. Two-wheelers are gaining traction in dense and congested cities where affordability, maneuverability, and faster short-distance travel improve mobility access.
Vans and MPVs support family travel, shared rides, tourism, airport transfers, and corporate transport needs. Three-wheelers remain meaningful in selected developing markets for economical last-mile travel, while buses and shuttles serve employee transportation, institutional mobility, and organized group travel.
Service Type Outlook
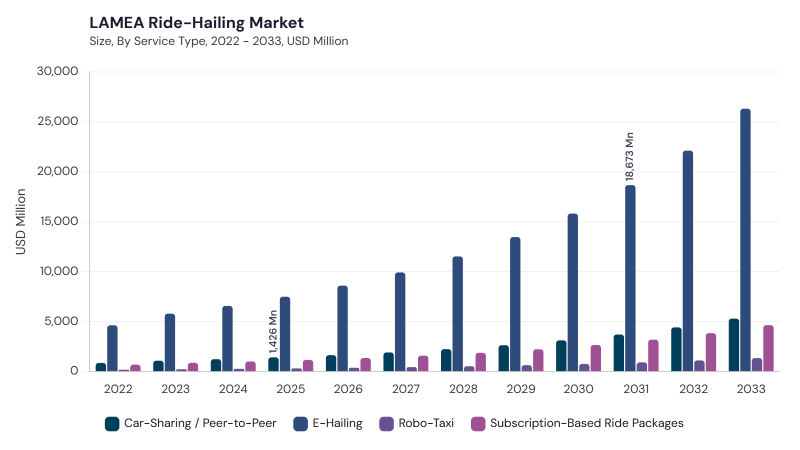
Based on Service Type, the market is segmented into E-Hailing, Car-Sharing / Peer-to-Peer, Subscription-Based Ride Packages, and Robo-Taxi. E-hailing leads due to growing consumer familiarity with app-based transport, real-time booking, flexible payment options, route tracking, and expanding urban service availability. Car-sharing and peer-to-peer services are gradually expanding as consumers seek lower-cost mobility options and better use of privately owned vehicles.
Subscription-based ride packages are gaining acceptance among frequent travelers and corporate users looking for predictable mobility costs. Robo-taxi services remain nascent, with development limited to pilot initiatives where autonomous driving infrastructure, regulation, and smart city programs are still evolving.
Free Valuable Insights: Ride-Hailing Market Size Worth USD 375.7 Billion billion by 2033
Country Outlook
Based on Country, the market is segmented into Brazil, Argentina, UAE, Saudi Arabia, South Africa, Nigeria, and Rest of LAMEA. The Brazil market dominated the LAMEA Ride-Hailing Market by Country in 2025, and would continue to be a dominant market till 2033; thereby, achieving a market value of USD 4.5 billion by 2029, growing at a CAGR of 16.1 % during the forecast period. The Argentina market is expected to witness a CAGR of 19.1% during (2026 - 2033). Additionally, The UAE market is expected to witness a CAGR of 16.6% during (2026 - 2033).
Brazil leads due to strong urban ride-hailing adoption, local and global platform presence, app-based payments, AI-enabled allocation, and increasing use of electric and hybrid vehicles. Argentina contributes through hybrid payment models, improving regulatory clarity, safety-focused features, and localized ride-hailing services. The UAE is supported by smart city initiatives, digital mobility infrastructure, strong regulatory systems, autonomous vehicle pilots, and premium service demand. Saudi Arabia, South Africa, and Nigeria add growth through urbanization, digital payments, financial inclusion, platform localization, and expanding driver networks, while Rest of LAMEA supports gradual demand across emerging mobility markets.
List of Key Companies Profiled
- Uber Technologies, Inc.
- DiDi Global Inc.
- Lyft, Inc.
- Grab Holdings Limited
- Bolt Technology OÜ
- ANI Technologies Pvt. Ltd.
- SUOL Innovations Ltd.
- Yandex Go
- Cabify
LAMEA Ride-Hailing Market Report Segmentation
By Booking Channel
- App-Based
- Voice / Phone
By Propulsion Type
- ICE
- Battery-Electric
- Hybrid
- CNG / LPG
By End User
- Personal
- Corporate / Institutional
By Vehicle Type
- Passenger Cars
- Two-Wheelers
- Vans & MPVs
- Three-Wheelers
- Buses & Shuttles
By Service Type
- E-Hailing
- Car-Sharing / Peer-to-Peer
- Subscription-Based Ride Packages
- Robo-Taxi
By Country
- Brazil
- Argentina
- UAE
- Saudi Arabia
- South Africa
- Nigeria
- Rest of LAMEA
1.1 Market Overview
1.2 Key Factors Impacting Market
1.2.1 Market Drivers
1.2.2 Market Restraints
1.2.3 Market Opportunities
1.2.4 Market Challenges
1.2.5 Market Trends
1.2.6 State of Competition
1.2.7 Market Consolidation
1.2.8 Key Customer Criteria
1.3 Product Life Cycle
1.4 Segmentation By Solution
1.4.1 Software
1.4.2 Services
1.5 Segmentation By Deployment
1.5.1 Cloud
1.5.2 On-premise
1.6 Segmentation By Enterprise Size
1.6.1 Large Enterprise
1.6.2 SMEs
1.7 Segmentation By End-use
1.7.1 IT and Telecom
1.7.2 BFSI
1.7.3 Government & Defense
1.7.4 Healthcare and Life Sciences
1.7.5 Retail & E-commerce
1.7.6 Manufacturing
1.7.7 Energy & Utilities
1.7.8 Other End-use
1.8 Segmentation By Country
1.8.1 Brazil
1.8.1.1 Segmentation By Solution
1.8.1.1.1 Software
1.8.1.1.2 Services
1.8.1.2 Segmentation By Deployment
1.8.1.2.1 Cloud
1.8.1.2.2 On-premise
1.8.1.3 Segmentation By Enterprise Size
1.8.1.3.1 Large Enterprise
1.8.1.3.2 SMEs
1.8.1.4 Segmentation By End-use
1.8.1.4.1 IT and Telecom
1.8.1.4.2 BFSI
1.8.1.4.3 Government & Defense
1.8.1.4.4 Healthcare and Life Sciences
1.8.1.4.5 Retail & E-commerce
1.8.1.4.6 Manufacturing
1.8.1.4.7 Other End-use
1.8.2 Argentina
1.8.2.1 Segmentation By Solution
1.8.2.1.1 Software
1.8.2.1.2 Services
1.8.2.2 Segmentation By Deployment
1.8.2.2.1 Cloud
1.8.2.2.2 On-premise
1.8.2.3 Segmentation By Enterprise Size
1.8.2.3.1 Large Enterprise
1.8.2.3.2 SMEs
1.8.2.4 Segmentation By End-use
1.8.2.4.1 IT and Telecom
1.8.2.4.2 BFSI
1.8.2.4.3 Government & Defense
1.8.2.4.4 Healthcare and Life Sciences
1.8.2.4.5 Retail & E-commerce
1.8.2.4.6 Manufacturing
1.8.2.4.7 Other End-use
1.8.3 UAE
1.8.3.1 Segmentation By Solution
1.8.3.1.1 Software
1.8.3.1.2 Services
1.8.3.2 Segmentation By Deployment
1.8.3.2.1 Cloud
1.8.3.2.2 On-premise
1.8.3.3 Segmentation By Enterprise Size
1.8.3.3.1 Large Enterprise
1.8.3.3.2 SMEs
1.8.3.4 Segmentation By End-use
1.8.3.4.1 IT and Telecom
1.8.3.4.2 BFSI
1.8.3.4.3 Government & Defense
1.8.3.4.4 Healthcare and Life Sciences
1.8.3.4.5 Retail & E-commerce
1.8.3.4.6 Manufacturing
1.8.3.4.7 Other End-use
1.8.4 Saudi Arabia
1.8.4.1 Segmentation By Solution
1.8.4.1.1 Software
1.8.4.1.2 Services
1.8.4.2 Segmentation By Deployment
1.8.4.2.1 Cloud
1.8.4.2.2 On-premise
1.8.4.3 Segmentation By Enterprise Size
1.8.4.3.1 Large Enterprise
1.8.4.3.2 SMEs
1.8.4.4 Segmentation By End-use
1.8.4.4.1 IT and Telecom
1.8.4.4.2 BFSI
1.8.4.4.3 Government & Defense
1.8.4.4.4 Healthcare and Life Sciences
1.8.4.4.5 Retail & E-commerce
1.8.4.4.6 Manufacturing
1.8.4.4.7 Other End-use
1.8.5 South Africa
1.8.5.1 Segmentation By Solution
1.8.5.1.1 Software
1.8.5.1.2 Services
1.8.5.2 Segmentation By Deployment
1.8.5.2.1 Cloud
1.8.5.2.2 On-premise
1.8.5.3 Segmentation By Enterprise Size
1.8.5.3.1 Large Enterprise
1.8.5.3.2 SMEs
1.8.5.4 Segmentation By End-use
1.8.5.4.1 IT and Telecom
1.8.5.4.2 BFSI
1.8.5.4.3 Government & Defense
1.8.5.4.4 Healthcare and Life Sciences
1.8.5.4.5 Retail & E-commerce
1.8.5.4.6 Manufacturing
1.8.5.4.7 Other End-use
1.8.6 Nigeria
1.8.6.1 Segmentation By Solution
1.8.6.1.1 Software
1.8.6.1.2 Services
1.8.6.2 Segmentation By Deployment
1.8.6.2.1 Cloud
1.8.6.2.2 On-premise
1.8.6.3 Segmentation By Enterprise Size
1.8.6.3.1 Large Enterprise
1.8.6.3.2 SMEs
1.8.6.4 Segmentation By End-use
1.8.6.4.1 IT and Telecom
1.8.6.4.2 BFSI
1.8.6.4.3 Government & Defense
1.8.6.4.4 Healthcare and Life Sciences
1.8.6.4.5 Retail & E-commerce
1.8.6.4.6 Manufacturing
1.8.6.4.7 Other End-use
1.8.7 Rest of LAMEA
1.8.7.1 Segmentation By Solution
1.8.7.1.1 Software
1.8.7.1.2 Services
1.8.7.2 Segmentation By Deployment
1.8.7.2.1 Cloud
1.8.7.2.2 On-premise
1.8.7.3 Segmentation By Enterprise Size
1.8.7.3.1 Large Enterprise
1.8.7.3.2 SMEs
1.8.7.4 Segmentation By End-use
1.8.7.4.1 IT and Telecom
1.8.7.4.2 BFSI
1.8.7.4.3 Government & Defense
1.8.7.4.4 Healthcare and Life Sciences
1.8.7.4.5 Retail & E-commerce
1.8.7.4.6 Manufacturing
1.8.7.4.7 Other End-use
Chapter 2. Company Snapshots
2.1 Cisco Systems, Inc.
2.1.1 Business Overview
2.1.2 Key Information
2.1.3 Company Focus on the Security Information and Event Management (SIEM) Market
2.1.4 Strategic Insights on the SIEM Market
2.1.5 Strategy Deployed for the SIEM Market
2.1.6 Product & Service Portfolio
2.1.7 Capability Overview
2.1.8 Technology & Innovation Focus
2.1.9 SWOT Analysis
2.1.10 Customers / End Users
2.1.11 Competitive Positioning
2.1.12 Key Differentiators
2.1.13 Portfolio Matrix
2.1.14 Analyst View
2.1.15 Future Outlook
2.2 Microsoft Corporation
2.2.1 Business Overview
2.2.2 Company Profile
2.2.3 Company Focus on the Security Information and Event Management (SIEM) Market
2.2.4 Strategic Insights
2.2.5 Strategy Deployed
2.2.6 Product & Service Portfolio
2.2.7 Capability Overview
2.2.8 Technology & Innovation Focus
2.2.9 SWOT Analysis
2.2.10 Customers / End Users
2.2.11 Competitive Positioning
2.2.12 Key Differentiators
2.2.13 Portfolio Matrix
2.2.14 Analyst View
2.2.15 Future Outlook
2.3 IBM Corporation
2.3.1 Business Overview
2.3.2 Key Information
2.3.3 Company Focus on the Security Information and Event Management (SIEM) Market
2.3.4 Strategic Insights
2.3.5 Strategy Deployed
2.3.6 Product & Service Portfolio
2.3.7 Capability Overview
2.3.8 Technology & Innovation Focus
2.3.9 SWOT Analysis
2.3.10 Customers / End Users
2.3.11 Competitive Positioning
2.3.12 Key Differentiators
2.3.13 Portfolio Matrix
2.3.14 Analyst View
2.3.15 Future Outlook
2.4 Google LLC
2.4.1 Business Overview
2.4.2 Key Information
2.4.3 Company Focus on the Security Information and Event Management (SIEM) Market
2.4.4 Strategic Insights on the SIEM Market
2.4.5 Strategy Deployed
2.4.6 Product & Service Portfolio
2.4.7 Capability Overview
2.4.8 Technology & Innovation Focus
2.4.9 SWOT Analysis
2.4.10 Customers / End Users
2.4.11 Competitive Positioning
2.4.12 Key Differentiators
2.4.13 Portfolio Matrix
2.4.14 Analyst View
2.4.15 Future Outlook
2.5 Palo Alto Networks, Inc.
2.5.1 Business Overview
2.5.2 Key Information
2.5.3 Company Focus on the Security Information and Event Management (SIEM) Market
2.5.4 Strategic Insights on the SIEM Market
2.5.5 Strategy Deployed
2.5.6 Product & Service Portfolio
2.5.7 Capability Overview
2.5.8 Technology & Innovation Focus
2.5.9 SWOT Analysis
2.5.10 Customers / End Users
2.5.11 Competitive Positioning
2.5.12 Key Differentiators
2.5.13 Portfolio Matrix
2.5.14 Analyst View
2.5.15 Future Outlook
2.6 Elastic N.V.
2.6.1 Business Overview
2.6.2 Key Information
2.6.3 Company Focus on the Security Information and Event Management (SIEM) Market
2.6.4 Strategic Insights
2.6.5 Strategy Deployed 2.6.6 Product & Service Portfolio
2.6.7 Capability Overview
2.6.8 Technology & Innovation Focus
2.6.9 SWOT Analysis
2.6.10 Customers / End Users
2.6.11 Competitive Positioning
2.6.12 Key Differentiators
2.6.13 Portfolio Matrix
2.6.14 Analyst View
2.6.15 Future Outlook
2.7 Exabeam, Inc.
2.7.1 Business Overview
2.7.2 Key Information
2.7.3 Company Focus on the Security Information and Event Management (SIEM) Market
2.7.4 Strategic Insights
2.7.5 Strategy Deployed
2.7.6 Product & Service Portfolio
2.7.7 Capability Overview
2.7.8 Technology & Innovation Focus
2.7.9 SWOT Analysis
2.7.10 Customers / End Users
2.7.11 Competitive Positioning
2.7.12 Key Differentiators
2.7.13 Portfolio Matrix
2.7.14 Analyst View
2.7.15 Future Outlook
2.8 OpenText Corporation
2.8.1 Business Overview
2.8.2 Key Information
2.8.3 Company Focus on the Security Information and Event Management (SIEM) Market
2.8.4 Strategic Insights on the SIEM Market
2.8.5 Strategy Deployed for the SIEM Market
2.8.6 Product & Service Portfolio
2.8.7 Capability Overview
2.8.8 Technology & Innovation Focus
2.8.9 SWOT Analysis
2.8.10 Customers / End Users
2.8.11 Competitive Positioning
2.8.12 Key Differentiators
2.8.13 Portfolio Matrix
2.8.14 Analyst View
2.8.15 Future Outlook
2.9 Fortinet, Inc. (FortiSIEM)
2.9.1 Business Overview
2.9.2 Key Information
2.9.3 Company Focus on the Security Information and Event Management (SIEM) Market
2.9.4 Strategic Insights
2.9.5 Strategy Deployed
2.9.6 Product & Service Portfolio
2.9.7 Capability Overview
2.9.8 Technology & Innovation Focus
2.9.9 SWOT Analysis
2.9.10 Customers / End Users
2.9.11 Competitive Positioning
2.9.12 Key Differentiators
2.9.13 Portfolio Matrix
2.9.14 Analyst View
2.9.15 Future Outlook
2.10 Securonix, Inc.
2.10.1 Business Overview
2.10.2 Key Information
2.10.3 Company Focus on the Security Information and Event Management (SIEM) Market
2.10.4 Strategic Insights
2.10.5 Strategy Deployed
2.10.6 Product & Service Portfolio
2.10.7 Capability Overview
2.10.8 Technology & Innovation Focus
2.10.9 SWOT Analysis
2.10.10 Customers / End Users
2.10.11 Competitive Positioning
2.10.12 Key Differentiators
2.10.13 Portfolio Matrix
2.10.14 Analyst View
2.10.15 Future Outlook
Table 1 LAMEA Security Information And Event Management Market Market, 2022 - 2033, USD Million
Table 2 LAMEA Security Information And Event Management Market Market by Deployment, 2022 - 2033, USD Million
Table 3 LAMEA Cloud Market, 2022 - 2033, USD Million
Table 4 LAMEA On-premise Market, 2022 - 2033, USD Million
Table 5 LAMEA Security Information And Event Management Market Market by End-use, 2022 - 2033, USD Million
Table 6 LAMEA BFSI Market, 2022 - 2033, USD Million
Table 7 LAMEA Energy & Utilities Market, 2022 - 2033, USD Million
Table 8 LAMEA Government & Defense Market, 2022 - 2033, USD Million
Table 9 LAMEA Healthcare and Life Sciences Market, 2022 - 2033, USD Million
Table 10 LAMEA IT and Telecom Market, 2022 - 2033, USD Million
Table 11 LAMEA Manufacturing Market, 2022 - 2033, USD Million
Table 12 LAMEA Other End-use Market, 2022 - 2033, USD Million
Table 13 LAMEA Retail & E-commerce Market, 2022 - 2033, USD Million
Table 14 LAMEA Security Information And Event Management Market Market by Enterprise Size, 2022 - 2033, USD Million
Table 15 LAMEA Large Enterprise Market, 2022 - 2033, USD Million
Table 16 LAMEA SMEs Market, 2022 - 2033, USD Million
Table 17 LAMEA Security Information And Event Management Market Market by Solution, 2022 - 2033, USD Million
Table 18 LAMEA Services Market, 2022 - 2033, USD Million
Table 19 LAMEA Software Market, 2022 - 2033, USD Million
Table 20 Brazil Security Information And Event Management Market Market, 2022 - 2033, USD Million
Table 21 Brazil Security Information And Event Management Market Market by Deployment, 2022 - 2033, USD Million
Table 22 Brazil Cloud Market, 2022 - 2033, USD Million
Table 23 Brazil On-premise Market, 2022 - 2033, USD Million
Table 24 Brazil Security Information And Event Management Market Market by End-use, 2022 - 2033, USD Million
Table 25 Brazil BFSI Market, 2022 - 2033, USD Million
Table 26 Brazil Energy & Utilities Market, 2022 - 2033, USD Million
Table 27 Brazil Government & Defense Market, 2022 - 2033, USD Million
Table 28 Brazil Healthcare and Life Sciences Market, 2022 - 2033, USD Million
Table 29 Brazil IT and Telecom Market, 2022 - 2033, USD Million
Table 30 Brazil Manufacturing Market, 2022 - 2033, USD Million
Table 31 Brazil Other End-use Market, 2022 - 2033, USD Million
Table 32 Brazil Retail & E-commerce Market, 2022 - 2033, USD Million
Table 33 Brazil Security Information And Event Management Market Market by Enterprise Size, 2022 - 2033, USD Million
Table 34 Brazil Large Enterprise Market, 2022 - 2033, USD Million
Table 35 Brazil SMEs Market, 2022 - 2033, USD Million
Table 36 Brazil Security Information And Event Management Market Market by Solution, 2022 - 2033, USD Million
Table 37 Brazil Services Market, 2022 - 2033, USD Million
Table 38 Brazil Software Market, 2022 - 2033, USD Million
Table 39 Argentina Security Information And Event Management Market Market, 2022 - 2033, USD Million
Table 40 Argentina Security Information And Event Management Market Market by Deployment, 2022 - 2033, USD Million
Table 41 Argentina Cloud Market, 2022 - 2033, USD Million
Table 42 Argentina On-premise Market, 2022 - 2033, USD Million
Table 43 Argentina Security Information And Event Management Market Market by End-use, 2022 - 2033, USD Million
Table 44 Argentina BFSI Market, 2022 - 2033, USD Million
Table 45 Argentina Energy & Utilities Market, 2022 - 2033, USD Million
Table 46 Argentina Government & Defense Market, 2022 - 2033, USD Million
Table 47 Argentina Healthcare and Life Sciences Market, 2022 - 2033, USD Million
Table 48 Argentina IT and Telecom Market, 2022 - 2033, USD Million
Table 49 Argentina Manufacturing Market, 2022 - 2033, USD Million
Table 50 Argentina Other End-use Market, 2022 - 2033, USD Million
Table 51 Argentina Retail & E-commerce Market, 2022 - 2033, USD Million
Table 52 Argentina Security Information And Event Management Market Market by Enterprise Size, 2022 - 2033, USD Million
Table 53 Argentina Large Enterprise Market, 2022 - 2033, USD Million
Table 54 Argentina SMEs Market, 2022 - 2033, USD Million
Table 55 Argentina Security Information And Event Management Market Market by Solution, 2022 - 2033, USD Million
Table 56 Argentina Services Market, 2022 - 2033, USD Million
Table 57 Argentina Software Market, 2022 - 2033, USD Million
Table 58 United Arab Emirates Security Information And Event Management Market Market, 2022 - 2033, USD Million
Table 59 United Arab Emirates Security Information And Event Management Market Market by Deployment, 2022 - 2033, USD Million
Table 60 United Arab Emirates Cloud Market, 2022 - 2033, USD Million
Table 61 United Arab Emirates On-premise Market, 2022 - 2033, USD Million
Table 62 United Arab Emirates Security Information And Event Management Market Market by End-use, 2022 - 2033, USD Million
Table 63 United Arab Emirates BFSI Market, 2022 - 2033, USD Million
Table 64 United Arab Emirates Energy & Utilities Market, 2022 - 2033, USD Million
Table 65 United Arab Emirates Government & Defense Market, 2022 - 2033, USD Million
Table 66 United Arab Emirates Healthcare and Life Sciences Market, 2022 - 2033, USD Million
Table 67 United Arab Emirates IT and Telecom Market, 2022 - 2033, USD Million
Table 68 United Arab Emirates Manufacturing Market, 2022 - 2033, USD Million
Table 69 United Arab Emirates Other End-use Market, 2022 - 2033, USD Million
Table 70 United Arab Emirates Retail & E-commerce Market, 2022 - 2033, USD Million
Table 71 United Arab Emirates Security Information And Event Management Market Market by Enterprise Size, 2022 - 2033, USD Million
Table 72 United Arab Emirates Large Enterprise Market, 2022 - 2033, USD Million
Table 73 United Arab Emirates SMEs Market, 2022 - 2033, USD Million
Table 74 United Arab Emirates Security Information And Event Management Market Market by Solution, 2022 - 2033, USD Million
Table 75 United Arab Emirates Services Market, 2022 - 2033, USD Million
Table 76 United Arab Emirates Software Market, 2022 - 2033, USD Million
Table 77 Saudi Arabia Security Information And Event Management Market Market, 2022 - 2033, USD Million
Table 78 Saudi Arabia Security Information And Event Management Market Market by Deployment, 2022 - 2033, USD Million
Table 79 Saudi Arabia Cloud Market, 2022 - 2033, USD Million
Table 80 Saudi Arabia On-premise Market, 2022 - 2033, USD Million
Table 81 Saudi Arabia Security Information And Event Management Market Market by End-use, 2022 - 2033, USD Million
Table 82 Saudi Arabia BFSI Market, 2022 - 2033, USD Million
Table 83 Saudi Arabia Energy & Utilities Market, 2022 - 2033, USD Million
Table 84 Saudi Arabia Government & Defense Market, 2022 - 2033, USD Million
Table 85 Saudi Arabia Healthcare and Life Sciences Market, 2022 - 2033, USD Million
Table 86 Saudi Arabia IT and Telecom Market, 2022 - 2033, USD Million
Table 87 Saudi Arabia Manufacturing Market, 2022 - 2033, USD Million
Table 88 Saudi Arabia Other End-use Market, 2022 - 2033, USD Million
Table 89 Saudi Arabia Retail & E-commerce Market, 2022 - 2033, USD Million
Table 90 Saudi Arabia Security Information And Event Management Market Market by Enterprise Size, 2022 - 2033, USD Million
Table 91 Saudi Arabia Large Enterprise Market, 2022 - 2033, USD Million
Table 92 Saudi Arabia SMEs Market, 2022 - 2033, USD Million
Table 93 Saudi Arabia Security Information And Event Management Market Market by Solution, 2022 - 2033, USD Million
Table 94 Saudi Arabia Services Market, 2022 - 2033, USD Million
Table 95 Saudi Arabia Software Market, 2022 - 2033, USD Million
Table 96 South Africa Security Information And Event Management Market Market, 2022 - 2033, USD Million
Table 97 South Africa Security Information And Event Management Market Market by Deployment, 2022 - 2033, USD Million
Table 98 South Africa Cloud Market, 2022 - 2033, USD Million
Table 99 South Africa On-premise Market, 2022 - 2033, USD Million
Table 100 South Africa Security Information And Event Management Market Market by End-use, 2022 - 2033, USD Million
Table 101 South Africa BFSI Market, 2022 - 2033, USD Million
Table 102 South Africa Energy & Utilities Market, 2022 - 2033, USD Million
Table 103 South Africa Government & Defense Market, 2022 - 2033, USD Million
Table 104 South Africa Healthcare and Life Sciences Market, 2022 - 2033, USD Million
Table 105 South Africa IT and Telecom Market, 2022 - 2033, USD Million
Table 106 South Africa Manufacturing Market, 2022 - 2033, USD Million
Table 107 South Africa Other End-use Market, 2022 - 2033, USD Million
Table 108 South Africa Retail & E-commerce Market, 2022 - 2033, USD Million
Table 109 South Africa Security Information And Event Management Market Market by Enterprise Size, 2022 - 2033, USD Million
Table 110 South Africa Large Enterprise Market, 2022 - 2033, USD Million
Table 111 South Africa SMEs Market, 2022 - 2033, USD Million
Table 112 South Africa Security Information And Event Management Market Market by Solution, 2022 - 2033, USD Million
Table 113 South Africa Services Market, 2022 - 2033, USD Million
Table 114 South Africa Software Market, 2022 - 2033, USD Million
Table 115 Nigeria Security Information And Event Management Market Market, 2022 - 2033, USD Million
Table 116 Nigeria Security Information And Event Management Market Market by Deployment, 2022 - 2033, USD Million
Table 117 Nigeria Cloud Market, 2022 - 2033, USD Million
Table 118 Nigeria On-premise Market, 2022 - 2033, USD Million
Table 119 Nigeria Security Information And Event Management Market Market by End-use, 2022 - 2033, USD Million
Table 120 Nigeria BFSI Market, 2022 - 2033, USD Million
Table 121 Nigeria Energy & Utilities Market, 2022 - 2033, USD Million
Table 122 Nigeria Government & Defense Market, 2022 - 2033, USD Million
Table 123 Nigeria Healthcare and Life Sciences Market, 2022 - 2033, USD Million
Table 124 Nigeria IT and Telecom Market, 2022 - 2033, USD Million
Table 125 Nigeria Manufacturing Market, 2022 - 2033, USD Million
Table 126 Nigeria Other End-use Market, 2022 - 2033, USD Million
Table 127 Nigeria Retail & E-commerce Market, 2022 - 2033, USD Million
Table 128 Nigeria Security Information And Event Management Market Market by Enterprise Size, 2022 - 2033, USD Million
Table 129 Nigeria Large Enterprise Market, 2022 - 2033, USD Million
Table 130 Nigeria SMEs Market, 2022 - 2033, USD Million
Table 131 Nigeria Security Information And Event Management Market Market by Solution, 2022 - 2033, USD Million
Table 132 Nigeria Services Market, 2022 - 2033, USD Million
Table 133 Nigeria Software Market, 2022 - 2033, USD Million
Table 134 Rest of LAMEA Security Information And Event Management Market Market, 2022 - 2033, USD Million
Table 135 Rest of LAMEA Security Information And Event Management Market Market by Deployment, 2022 - 2033, USD Million
Table 136 Rest of LAMEA Cloud Market, 2022 - 2033, USD Million
Table 137 Rest of LAMEA On-premise Market, 2022 - 2033, USD Million
Table 138 Rest of LAMEA Security Information And Event Management Market Market by End-use, 2022 - 2033, USD Million
Table 139 Rest of LAMEA BFSI Market, 2022 - 2033, USD Million
Table 140 Rest of LAMEA Energy & Utilities Market, 2022 - 2033, USD Million
Table 141 Rest of LAMEA Government & Defense Market, 2022 - 2033, USD Million
Table 142 Rest of LAMEA Healthcare and Life Sciences Market, 2022 - 2033, USD Million
Table 143 Rest of LAMEA IT and Telecom Market, 2022 - 2033, USD Million
Table 144 Rest of LAMEA Manufacturing Market, 2022 - 2033, USD Million
Table 145 Rest of LAMEA Other End-use Market, 2022 - 2033, USD Million
Table 146 Rest of LAMEA Retail & E-commerce Market, 2022 - 2033, USD Million
Table 147 Rest of LAMEA Security Information And Event Management Market Market by Enterprise Size, 2022 - 2033, USD Million
Table 148 Rest of LAMEA Large Enterprise Market, 2022 - 2033, USD Million
Table 149 Rest of LAMEA SMEs Market, 2022 - 2033, USD Million
Table 150 Rest of LAMEA Security Information And Event Management Market Market by Solution, 2022 - 2033, USD Million
Table 151 Rest of LAMEA Services Market, 2022 - 2033, USD Million
Table 152 Rest of LAMEA Software Market, 2022 - 2033, USD Million
List of Figures
FIG 1 Key Factors Impacting Market
FIG 2 Market Consolidation
FIG 3 Key Customer Criteria
FIG 4 Product Life Cycle
FIG 5 LAMEA Security Information And Event Management Market Market, 2022 - 2033, USD Million
FIG 6 LAMEA Security Information And Event Management Market Market by Deployment, 2022 - 2033, USD Million
FIG 7 LAMEA Cloud Market, 2022 - 2033, USD Million
FIG 8 LAMEA On-premise Market, 2022 - 2033, USD Million
FIG 9 LAMEA Security Information And Event Management Market Market by End-use, 2022 - 2033, USD Million
FIG 10 LAMEA BFSI Market, 2022 - 2033, USD Million
FIG 11 LAMEA Energy & Utilities Market, 2022 - 2033, USD Million
FIG 12 LAMEA Government & Defense Market, 2022 - 2033, USD Million
FIG 13 LAMEA Healthcare and Life Sciences Market, 2022 - 2033, USD Million
FIG 14 LAMEA IT and Telecom Market, 2022 - 2033, USD Million
FIG 15 LAMEA Manufacturing Market, 2022 - 2033, USD Million
FIG 16 LAMEA Other End-use Market, 2022 - 2033, USD Million
FIG 17 LAMEA Retail & E-commerce Market, 2022 - 2033, USD Million
FIG 18 LAMEA Security Information And Event Management Market Market by Enterprise Size, 2022 - 2033, USD Million
FIG 19 LAMEA Large Enterprise Market, 2022 - 2033, USD Million
FIG 20 LAMEA SMEs Market, 2022 - 2033, USD Million
FIG 21 LAMEA Security Information And Event Management Market Market by Solution, 2022 - 2033, USD Million
FIG 22 LAMEA Services Market, 2022 - 2033, USD Million
FIG 23 LAMEA Software Market, 2022 - 2033, USD Million
FIG 24 Brazil Security Information And Event Management Market Market, 2022 - 2033, USD Million
FIG 25 Brazil Security Information And Event Management Market Market by Deployment, 2022 - 2033, USD Million
FIG 26 Brazil Cloud Market, 2022 - 2033, USD Million
FIG 27 Brazil On-premise Market, 2022 - 2033, USD Million
FIG 28 Brazil Security Information And Event Management Market Market by End-use, 2022 - 2033, USD Million
FIG 29 Brazil BFSI Market, 2022 - 2033, USD Million
FIG 30 Brazil Energy & Utilities Market, 2022 - 2033, USD Million
FIG 31 Brazil Government & Defense Market, 2022 - 2033, USD Million
FIG 32 Brazil Healthcare and Life Sciences Market, 2022 - 2033, USD Million
FIG 33 Brazil IT and Telecom Market, 2022 - 2033, USD Million
FIG 34 Brazil Manufacturing Market, 2022 - 2033, USD Million
FIG 35 Brazil Other End-use Market, 2022 - 2033, USD Million
FIG 36 Brazil Retail & E-commerce Market, 2022 - 2033, USD Million
FIG 37 Brazil Security Information And Event Management Market Market by Enterprise Size, 2022 - 2033, USD Million
FIG 38 Brazil Large Enterprise Market, 2022 - 2033, USD Million
FIG 39 Brazil SMEs Market, 2022 - 2033, USD Million
FIG 40 Brazil Security Information And Event Management Market Market by Solution, 2022 - 2033, USD Million
FIG 41 Brazil Services Market, 2022 - 2033, USD Million
FIG 42 Brazil Software Market, 2022 - 2033, USD Million
FIG 43 Argentina Security Information And Event Management Market Market, 2022 - 2033, USD Million
FIG 44 Argentina Security Information And Event Management Market Market by Deployment, 2022 - 2033, USD Million
FIG 45 Argentina Cloud Market, 2022 - 2033, USD Million
FIG 46 Argentina On-premise Market, 2022 - 2033, USD Million
FIG 47 Argentina Security Information And Event Management Market Market by End-use, 2022 - 2033, USD Million
FIG 48 Argentina BFSI Market, 2022 - 2033, USD Million
FIG 49 Argentina Energy & Utilities Market, 2022 - 2033, USD Million
FIG 50 Argentina Government & Defense Market, 2022 - 2033, USD Million
FIG 51 Argentina Healthcare and Life Sciences Market, 2022 - 2033, USD Million
FIG 52 Argentina IT and Telecom Market, 2022 - 2033, USD Million
FIG 53 Argentina Manufacturing Market, 2022 - 2033, USD Million
FIG 54 Argentina Other End-use Market, 2022 - 2033, USD Million
FIG 55 Argentina Retail & E-commerce Market, 2022 - 2033, USD Million
FIG 56 Argentina Security Information And Event Management Market Market by Enterprise Size, 2022 - 2033, USD Million
FIG 57 Argentina Large Enterprise Market, 2022 - 2033, USD Million
FIG 58 Argentina SMEs Market, 2022 - 2033, USD Million
FIG 59 Argentina Security Information And Event Management Market Market by Solution, 2022 - 2033, USD Million
FIG 60 Argentina Services Market, 2022 - 2033, USD Million
FIG 61 Argentina Software Market, 2022 - 2033, USD Million
FIG 62 United Arab Emirates Security Information And Event Management Market Market, 2022 - 2033, USD Million
FIG 63 United Arab Emirates Security Information And Event Management Market Market by Deployment, 2022 - 2033, USD Million
FIG 64 United Arab Emirates Cloud Market, 2022 - 2033, USD Million
FIG 65 United Arab Emirates On-premise Market, 2022 - 2033, USD Million
FIG 66 United Arab Emirates Security Information And Event Management Market Market by End-use, 2022 - 2033, USD Million
FIG 67 United Arab Emirates BFSI Market, 2022 - 2033, USD Million
FIG 68 United Arab Emirates Energy & Utilities Market, 2022 - 2033, USD Million
FIG 69 United Arab Emirates Government & Defense Market, 2022 - 2033, USD Million
FIG 70 United Arab Emirates Healthcare and Life Sciences Market, 2022 - 2033, USD Million
FIG 71 United Arab Emirates IT and Telecom Market, 2022 - 2033, USD Million
FIG 72 United Arab Emirates Manufacturing Market, 2022 - 2033, USD Million
FIG 73 United Arab Emirates Other End-use Market, 2022 - 2033, USD Million
FIG 74 United Arab Emirates Retail & E-commerce Market, 2022 - 2033, USD Million
FIG 75 United Arab Emirates Security Information And Event Management Market Market by Enterprise Size, 2022 - 2033, USD Million
FIG 76 United Arab Emirates Large Enterprise Market, 2022 - 2033, USD Million
FIG 77 United Arab Emirates SMEs Market, 2022 - 2033, USD Million
FIG 78 United Arab Emirates Security Information And Event Management Market Market by Solution, 2022 - 2033, USD Million
FIG 79 United Arab Emirates Services Market, 2022 - 2033, USD Million
FIG 80 United Arab Emirates Software Market, 2022 - 2033, USD Million
FIG 81 Saudi Arabia Security Information And Event Management Market Market, 2022 - 2033, USD Million
FIG 82 Saudi Arabia Security Information And Event Management Market Market by Deployment, 2022 - 2033, USD Million
FIG 83 Saudi Arabia Cloud Market, 2022 - 2033, USD Million
FIG 84 Saudi Arabia On-premise Market, 2022 - 2033, USD Million
FIG 85 Saudi Arabia Security Information And Event Management Market Market by End-use, 2022 - 2033, USD Million
FIG 86 Saudi Arabia BFSI Market, 2022 - 2033, USD Million
FIG 87 Saudi Arabia Energy & Utilities Market, 2022 - 2033, USD Million
FIG 88 Saudi Arabia Government & Defense Market, 2022 - 2033, USD Million
FIG 89 Saudi Arabia Healthcare and Life Sciences Market, 2022 - 2033, USD Million
FIG 90 Saudi Arabia IT and Telecom Market, 2022 - 2033, USD Million FIG 91 Saudi Arabia Manufacturing Market, 2022 - 2033, USD Million
FIG 92 Saudi Arabia Other End-use Market, 2022 - 2033, USD Million
FIG 93 Saudi Arabia Retail & E-commerce Market, 2022 - 2033, USD Million
FIG 94 Saudi Arabia Security Information And Event Management Market Market by Enterprise Size, 2022 - 2033, USD Million
FIG 95 Saudi Arabia Large Enterprise Market, 2022 - 2033, USD Million
FIG 96 Saudi Arabia SMEs Market, 2022 - 2033, USD Million
FIG 97 Saudi Arabia Security Information And Event Management Market Market by Solution, 2022 - 2033, USD Million
FIG 98 Saudi Arabia Services Market, 2022 - 2033, USD Million
FIG 99 Saudi Arabia Software Market, 2022 - 2033, USD Million
FIG 100 South Africa Security Information And Event Management Market Market, 2022 - 2033, USD Million
FIG 101 South Africa Security Information And Event Management Market Market by Deployment, 2022 - 2033, USD Million
FIG 102 South Africa Cloud Market, 2022 - 2033, USD Million
FIG 103 South Africa On-premise Market, 2022 - 2033, USD Million
FIG 104 South Africa Security Information And Event Management Market Market by End-use, 2022 - 2033, USD Million
FIG 105 South Africa BFSI Market, 2022 - 2033, USD Million
FIG 106 South Africa Energy & Utilities Market, 2022 - 2033, USD Million
FIG 107 South Africa Government & Defense Market, 2022 - 2033, USD Million
FIG 108 South Africa Healthcare and Life Sciences Market, 2022 - 2033, USD Million
FIG 109 South Africa IT and Telecom Market, 2022 - 2033, USD Million
FIG 110 South Africa Manufacturing Market, 2022 - 2033, USD Million
FIG 111 South Africa Other End-use Market, 2022 - 2033, USD Million
FIG 112 South Africa Retail & E-commerce Market, 2022 - 2033, USD Million
FIG 113 South Africa Security Information And Event Management Market Market by Enterprise Size, 2022 - 2033, USD Million
FIG 114 South Africa Large Enterprise Market, 2022 - 2033, USD Million
FIG 115 South Africa SMEs Market, 2022 - 2033, USD Million
FIG 116 South Africa Security Information And Event Management Market Market by Solution, 2022 - 2033, USD Million
FIG 117 South Africa Services Market, 2022 - 2033, USD Million
FIG 118 South Africa Software Market, 2022 - 2033, USD Million
FIG 119 Nigeria Security Information And Event Management Market Market, 2022 - 2033, USD Million
FIG 120 Nigeria Security Information And Event Management Market Market by Deployment, 2022 - 2033, USD Million
FIG 121 Nigeria Cloud Market, 2022 - 2033, USD Million
FIG 122 Nigeria On-premise Market, 2022 - 2033, USD Million
FIG 123 Nigeria Security Information And Event Management Market Market by End-use, 2022 - 2033, USD Million
FIG 124 Nigeria BFSI Market, 2022 - 2033, USD Million
FIG 125 Nigeria Energy & Utilities Market, 2022 - 2033, USD Million
FIG 126 Nigeria Government & Defense Market, 2022 - 2033, USD Million
FIG 127 Nigeria Healthcare and Life Sciences Market, 2022 - 2033, USD Million
FIG 128 Nigeria IT and Telecom Market, 2022 - 2033, USD Million
FIG 129 Nigeria Manufacturing Market, 2022 - 2033, USD Million
FIG 130 Nigeria Other End-use Market, 2022 - 2033, USD Million
FIG 131 Nigeria Retail & E-commerce Market, 2022 - 2033, USD Million
FIG 132 Nigeria Security Information And Event Management Market Market by Enterprise Size, 2022 - 2033, USD Million
FIG 133 Nigeria Large Enterprise Market, 2022 - 2033, USD Million
FIG 134 Nigeria SMEs Market, 2022 - 2033, USD Million
FIG 135 Nigeria Security Information And Event Management Market Market by Solution, 2022 - 2033, USD Million
FIG 136 Nigeria Services Market, 2022 - 2033, USD Million
FIG 137 Nigeria Software Market, 2022 - 2033, USD Million
FIG 138 Rest of LAMEA Security Information And Event Management Market Market, 2022 - 2033, USD Million
FIG 139 Rest of LAMEA Security Information And Event Management Market Market by Deployment, 2022 - 2033, USD Million
FIG 140 Rest of LAMEA Cloud Market, 2022 - 2033, USD Million
FIG 141 Rest of LAMEA On-premise Market, 2022 - 2033, USD Million
FIG 142 Rest of LAMEA Security Information And Event Management Market Market by End-use, 2022 - 2033, USD Million
FIG 143 Rest of LAMEA BFSI Market, 2022 - 2033, USD Million
FIG 144 Rest of LAMEA Energy & Utilities Market, 2022 - 2033, USD Million
FIG 145 Rest of LAMEA Government & Defense Market, 2022 - 2033, USD Million
FIG 146 Rest of LAMEA Healthcare and Life Sciences Market, 2022 - 2033, USD Million
FIG 147 Rest of LAMEA IT and Telecom Market, 2022 - 2033, USD Million
FIG 148 Rest of LAMEA Manufacturing Market, 2022 - 2033, USD Million
FIG 149 Rest of LAMEA Other End-use Market, 2022 - 2033, USD Million
FIG 150 Rest of LAMEA Retail & E-commerce Market, 2022 - 2033, USD Million
FIG 151 Rest of LAMEA Security Information And Event Management Market Market by Enterprise Size, 2022 - 2033, USD Million
FIG 152 Rest of LAMEA Large Enterprise Market, 2022 - 2033, USD Million
FIG 153 Rest of LAMEA SMEs Market, 2022 - 2033, USD Million
FIG 154 Rest of LAMEA Security Information And Event Management Market Market by Solution, 2022 - 2033, USD Million
FIG 155 Rest of LAMEA Services Market, 2022 - 2033, USD Million
FIG 156 Rest of LAMEA Software Market, 2022 - 2033, USD Million