The sample copy of this report is available for access.
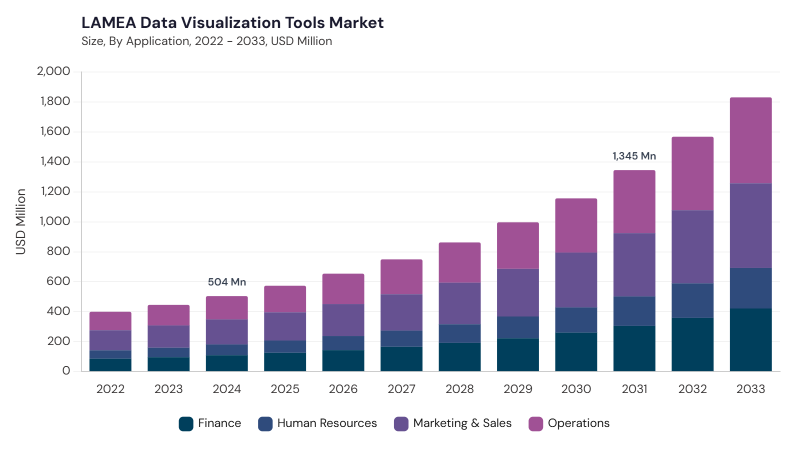
The LAMEA Data Visualization Tools Market is expected to reach USD 996.7 million by 2029, growing at a CAGR of 15.8% during (2026 - 2033).
The LAMEA Data Visualization Tools Market evolved from basic charting and reporting applications into interactive, real-time, and increasingly intelligent analytics platforms. Initial adoption focused on financial and operational reporting, while improvements in computing power, internet connectivity, cloud infrastructure, and enterprise digitization expanded the use of visual analytics across telecommunications, banking, government, retail, healthcare, and other industries. Interactive dashboards and real-time processing marked an important transition toward faster decision-making. More recently, AI and machine learning integration has enabled automated pattern recognition, anomaly detection, forecasting, and more dynamic interpretation of complex datasets.
Cloud adoption, AI-enabled analytics, localization, regulatory compliance, and mobile accessibility are shaping current market development. Cloud-based platforms offer scalable and cost-efficient deployment while improving collaboration across geographically dispersed operations, whereas AI and machine learning increasingly support predictive analytics, automated insights, and natural language interaction. Vendors are also adapting interfaces, language support, data-governance functionality, and compliance features to regional requirements. Growing emphasis on data sovereignty, cybersecurity, embedded analytics, mobile-friendly dashboards, SaaS delivery, and real-time decision support is further expanding visualization adoption across diverse LAMEA economies.
Based on Component, the market is segmented into Software and Services. The Software market dominated the LAMEA Data Visualization Tools Market by Component in 2025, and would continue to be a dominant market till 2033; thereby, achieving a market value of USD 683.0 million by 2029, growing at a CAGR of 15.4 % during the forecast period. The Services market is expected to witness a CAGR of 16.8% during (2026 - 2033).
Software provides the core environment for dashboards, reporting, visual analytics, real-time monitoring, and AI-assisted interpretation of complex datasets. Demand is increasingly influenced by cloud deployment, intuitive interfaces, augmented analytics, IoT integration, and requirements for governance and compliance. Services include consulting, implementation, system integration, customization, dashboard localization, training, maintenance, and technical support. Their importance is particularly strong where organizations face fragmented legacy infrastructure, limited internal analytics skills, regulatory complexity, or requirements for industry-specific visualization environments.
Based on Organization Size, the market is segmented into Large Enterprises and Small & Medium Enterprises (SMEs). The Large Enterprises market dominated the LAMEA Data Visualization Tools Market by Organization Size in 2025, and would continue to be a dominant market till 2033; thereby, achieving a market value of USD 711.5 million by 2029, growing at a CAGR of 15.5 % during the forecast period. The Small & Medium Enterprises (SMEs) market is expected to witness a CAGR of 16.7% during (2026 - 2033).
Large Enterprises require scalable visualization platforms capable of integrating ERP, CRM, IoT, financial, operational, and other enterprise data while supporting real-time analytics, predictive insights, governance, and cross-functional reporting. Their adoption is shaped by digital transformation, regulatory compliance, security, and the need to manage extensive data estates across distributed operations. Small & Medium Enterprises (SMEs) prioritize affordability, ease of deployment, intuitive interfaces, and rapid time to value. SaaS subscriptions, pre-built templates, cloud access, self-service functionality, and simplified analytics are lowering barriers for smaller businesses seeking stronger sales, financial, and operational insight.
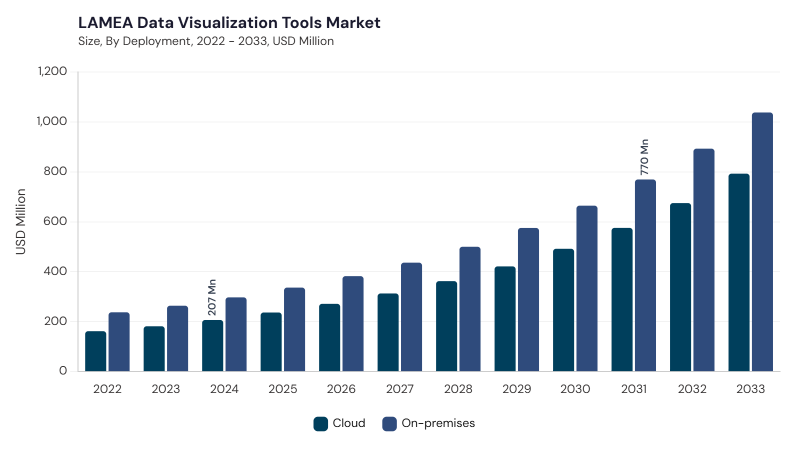
Based on Deployment, the market is segmented into On-premises and Cloud. The On-premises market dominated the LAMEA Data Visualization Tools Market by Deployment in 2025, and would continue to be a dominant market till 2033; thereby, achieving a market value of USD 575.3 million by 2029, growing at a CAGR of 15.3 % during the forecast period. The Cloud market is expected to witness a CAGR of 16.5% during (2026 - 2033).
On-premises deployment provides direct control over data, security, customization, governance, and integration with established enterprise systems, making it relevant for regulated and mission-critical environments. It also supports organizations operating under data-sovereignty requirements or inconsistent connectivity conditions. Cloud deployment offers rapid implementation, scalable computing, reduced infrastructure dependence, collaborative dashboards, and subscription-based access. Regional data-center expansion, SaaS adoption, mobile connectivity, multi-cloud strategies, and demand for flexible analytics are strengthening cloud usage, while hybrid models help balance agility with compliance and data-control requirements.
Based on Application, the market is segmented into Marketing & Sales, Operations, Finance, and Human Resources. Marketing & Sales uses visualization for campaign performance, customer behavior, sales funnels, digital engagement, acquisition, retention, and multi-channel analysis. Operations relies on dashboards to monitor mining sites, oil and gas assets, telecommunications infrastructure, logistics networks, manufacturing processes, and supply chains across dispersed locations.
Finance applies visualization to budgeting, cash-flow monitoring, currency exposure, investment appraisal, risk management, and management reporting across varied economic environments. Human Resources uses visual analytics for recruitment, skills planning, workforce localization, productivity monitoring, employee deployment, attrition, and distributed workforce management.
Based on End Use, the market is segmented into BFSI, IT and Telecommunication, Manufacturing, Healthcare & Life Sciences, Retail & E-commerce, Government, Transportation & Logistics, and Other End Uses. BFSI applies visualization to fraud monitoring, credit risk, customer analytics, compliance, financial forecasting, and transaction analysis, while IT and Telecommunication uses it for network performance, subscriber analytics, service quality, infrastructure planning, IoT data, and capacity management.
Manufacturing relies on dashboards for productivity, equipment performance, supply chains, quality control, and Industry 4.0 initiatives, whereas Healthcare & Life Sciences uses visual analytics for patient flows, clinical information, hospital resources, pharmaceutical distribution, telemedicine, and research. Retail & E-commerce applies visualization to customer behavior, inventory, digital payments, marketplace activity, sales trends, and marketing performance, while Government uses it for smart cities, public services, economic development, infrastructure monitoring, and policy analysis. Transportation & Logistics supports fleet, freight, route, port, shipment, and last-mile visibility, while Other End Uses includes oil and gas, mining, education, tourism, utilities, media, agriculture, and professional services.
Free Valuable Insights: Data Visualization Tools Market Size Worth USD 28.9 Billion billion by 2033
Based on Country, the market is segmented into Brazil, Argentina, UAE, Saudi Arabia, South Africa, Nigeria, and Rest of LAMEA. The Brazil market dominated the LAMEA Data Visualization Tools Market by Country in 2025, and would continue to be a dominant market till 2033; thereby, achieving a market value of USD 294.6 million by 2029, growing at a CAGR of 14.6 % during the forecast period. The Argentina market is expected to witness a CAGR of 17.4% during (2026 - 2033). Additionally, The UAE market is expected to witness a CAGR of 14.8% during (2026 - 2033).
Across LAMEA, data visualization adoption is being shaped by cloud expansion, AI-enabled analytics, localization, real-time insight requirements, data governance, and digital-transformation initiatives. Brazil emphasizes advanced analytics, mobile and cloud accessibility, localization, AI-driven visualization, and regulatory adaptation, while Argentina focuses on self-service analytics, AI-powered insights, cloud platforms, local compliance, and language-specific customization. The UAE is advancing augmented analytics, cloud-based integrated platforms, self-service visualization, cybersecurity, and enterprise digitalization, whereas Saudi Arabia emphasizes AI-powered analytics, cloud adoption, industry-specific customization, localization, and data-sovereignty requirements. South Africa focuses on AI-driven visualization, cloud deployment, localization, regulatory compliance, and wider analytics accessibility, while Nigeria emphasizes low-code and no-code platforms, cloud-based visualization, predictive analytics, local customization, and expanding data literacy. Rest of LAMEA continues to develop AI-augmented analytics, SaaS platforms, multilingual interfaces, localized compliance, flexible pricing, and scalable visualization suited to diverse infrastructure conditions.
By Component
By Organization Size
By Deployment
By Application
By End Use
By Country
Set to reach $996.7 Million by 2029, growing at 15.8% CAGR during 2026-2033.
Brazil leads with $294.6 million by 2029, growing at a CAGR of 14.6% during 2026-2033.
Rising demand for cloud deployments, with a CAGR of 16.5% during 2026-2033, is a key growth driver.
The software segment will reach $683.0 million by 2029, growing at a CAGR of 15.4% during 2026-2033.
The Argentina market is expected to witness a CAGR of 17.4% during 2026-2033.
Large enterprises will reach $711.5 million by 2029, growing at a CAGR of 15.5% during 2026-2033.
Our team of dedicated experts can provide you with attractive expansion opportunities for your business.




 Unique Offerings