The sample copy of this report is available for access.
The Asia Pacific Data Visualization Tools Market is expected to reach USD 5.2 billion by 2030, growing at a CAGR of 14.7% during (2026 - 2033).
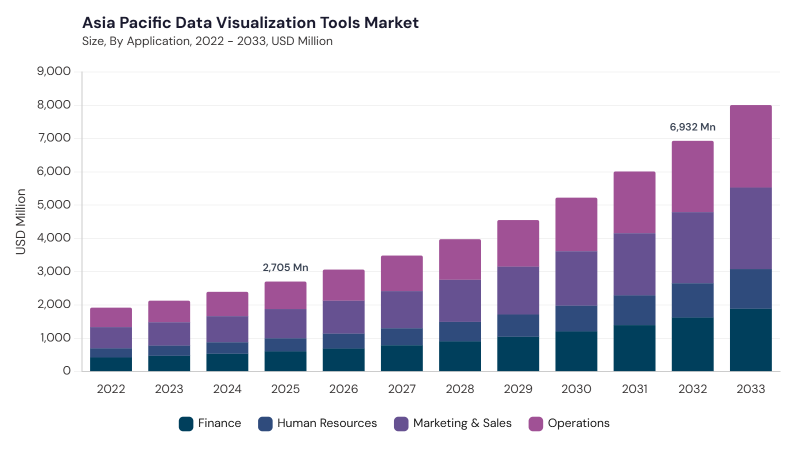
The Asia Pacific Data Visualization Tools Market evolved from basic charting and static reporting tools into dynamic analytics platforms capable of processing complex and high-volume enterprise data. Growth in cloud infrastructure, computing power, business intelligence, and digital ecosystems enabled interactive dashboards, real-time analytics, and broader enterprise adoption. As organizations increasingly treated data as a strategic asset, visualization expanded into sales optimization, customer analytics, supply-chain management, and operational intelligence. AI and machine learning have further transformed the market toward predictive, prescriptive, and automated insight generation across increasingly data-driven regional economies.
AI and generative AI integration, data governance, cloud deployment, localization, and industry-specific visualization are shaping current market development. AI-powered platforms increasingly support automated insight generation, anomaly detection, natural language querying, predictive analytics, and contextual recommendations, reducing dependence on specialist users. Cloud platforms improve scalability, collaboration, and accessibility, while stronger data-governance capabilities support reliability, privacy, and regulatory compliance. Regional language requirements, data-localization rules, mobile-first business environments, IoT adoption, and sector-specific analytics are also encouraging vendors to provide customizable platforms suited to diverse Asia Pacific markets.
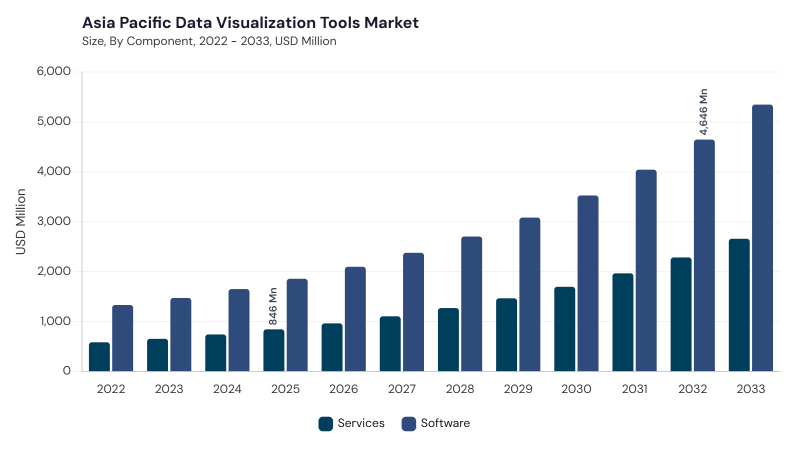
Based on Component, the market is segmented into Software and Services. The Software market dominated the Asia Pacific Data Visualization Tools Market by Component in 2025, and would continue to be a dominant market till 2033; thereby, achieving a market value of USD 3.5 billion by 2030, growing at a CAGR of 14.3 % during the forecast period. The Services market is expected to witness a CAGR of 15.6% during (2026 - 2033).
Software forms the core environment for dashboards, charts, interactive reports, heat maps, predictive analytics, and self-service visualization across enterprise data environments. AI, augmented analytics, real-time processing, cloud connectivity, and integration with ERP, CRM, BI, IoT, and enterprise data platforms are expanding software capabilities. Services support implementation, data integration, dashboard localization, customization, consulting, governance, training, and technical assistance. Their importance is particularly strong where organizations operate heterogeneous IT systems, lack specialist expertise, or require industry- and country-specific configurations.
Based on Organization Size, the market is segmented into Large Enterprises and Small & Medium Enterprises (SMEs). The Large Enterprises market dominated the Asia Pacific Data Visualization Tools Market by Organization Size in 2025, and would continue to be a dominant market till 2033; thereby, achieving a market value of USD 3.6 billion by 2030, growing at a CAGR of 14.4 % during the forecast period. The Small & Medium Enterprises (SMEs) market is expected to witness a CAGR of 15.4% during (2026 - 2033).
Large Enterprises require sophisticated visualization platforms capable of processing extensive datasets, integrating multiple systems, supporting cross-functional analytics, and meeting security, scalability, and compliance requirements. AI-enabled analytics, enterprise data lakes, cloud integration, predictive insights, and advanced customization are strengthening adoption. Small & Medium Enterprises (SMEs) prioritize intuitive, affordable, and rapidly deployable tools that minimize technical overhead. SaaS subscriptions, self-service interfaces, automated templates, API connectivity, and integration with common business applications are widening access to visual analytics among smaller organizations.
Based on Deployment, the market is segmented into On-premises and Cloud. The On-premises market dominated the Asia Pacific Data Visualization Tools Market by Deployment in 2025, and would continue to be a dominant market till 2033; thereby, achieving a market value of USD 2.9 billion by 2030, growing at a CAGR of 14.2 % during the forecast period. The Cloud market is expected to witness a CAGR of 15.4% during (2026 - 2033).
On-premises deployment enables direct control over sensitive information, infrastructure, software configuration, security, and integration with established enterprise systems, making it relevant where data residency and governance requirements are significant. Cloud deployment provides scalable processing, remote access, real-time collaboration, automatic updates, subscription-based economics, and integration with cloud-native analytics environments. Regional data centers, cloud zones, digital-native companies, distributed workforces, and expanding internet infrastructure are increasing cloud adoption, while hybrid architectures help organizations balance flexibility with regulatory and security requirements.
Based on Application, the market is segmented into Marketing & Sales, Operations, Finance, and Human Resources. Marketing & Sales uses visualization for customer behavior, campaign effectiveness, conversion tracking, sales forecasting, omnichannel analysis, and customer segmentation across digital platforms. Operations applies visual analytics to production, logistics, inventory, supplier coordination, resource utilization, predictive maintenance, and real-time process monitoring.
Finance relies on visualization for budgeting, cash-flow analysis, forecasting, investment evaluation, compliance, risk monitoring, and performance reporting across multiple currencies and markets. Human Resources uses dashboards for recruitment, workforce planning, productivity, attrition, skills assessment, engagement, and talent management across large and diverse employee populations.
Based on End Use, the market is segmented into BFSI, IT and Telecommunication, Manufacturing, Healthcare & Life Sciences, Retail & E-commerce, Government, Transportation & Logistics, and Other End Uses. BFSI applies visualization to fraud detection, customer analytics, risk assessment, regulatory reporting, portfolio monitoring, and financial forecasting, while IT and Telecommunication uses it for network performance, subscriber behavior, 5G infrastructure, service monitoring, and cloud operations.
Manufacturing relies on visual analytics for factory utilization, quality management, predictive maintenance, supplier visibility, and Industry 4.0 operations, whereas Healthcare & Life Sciences uses it for hospital planning, clinical research, patient information, telehealth, and pharmaceutical analytics. Retail & E-commerce applies visualization to merchandising, digital commerce, inventory, customer journeys, pricing, and demand analysis, while Government uses it for smart cities, public services, economic planning, infrastructure monitoring, and open-data initiatives. Transportation & Logistics supports fleet, shipment, port, warehouse, route, and last-mile monitoring, while Other End Uses includes education, energy, travel, media, agriculture, and professional services.
Free Valuable Insights: Data Visualization Tools Market is Predicted to reach USD 28.9 Billion billion by 2033, at a CAGR of 14.1%
Based on Country, the market is segmented into China, Japan, India, South Korea, Singapore, Malaysia, and Rest of Asia Pacific. The China market dominated the Asia Pacific Data Visualization Tools Market by Country in 2025, and would continue to be a dominant market till 2033; thereby, achieving a market value of USD 1.4 billion by 2030, growing at a CAGR of 12.7 % during the forecast period. The Japan market is expected to witness a CAGR of 13.9% during (2026 - 2033). Additionally, The India market is expected to witness a CAGR of 15.4% during (2026 - 2033).
Across Asia Pacific, data visualization adoption is being shaped by AI integration, cloud infrastructure, localization, real-time analytics, data governance, and sector-specific digitalization. China emphasizes generative AI, real-time analytics, data security, localization, and industry-specific platforms, while Japan focuses on AI-driven insights, cloud visualization, compliance, multilingual functionality, and advanced predictive applications. India is advancing real-time dashboards, AI-assisted analytics, self-service BI, data security, cloud-first platforms, and localized enterprise integration, whereas South Korea emphasizes AI analytics, cloud migration, Korean-language customization, advanced UX, and embedded analytics. Singapore focuses on data quality, AI automation, fintech visualization, governance, interoperability, and smart-city analytics, while Malaysia is strengthening AI-powered visualization, cloud adoption, localization, regulatory alignment, and expanding digital infrastructure. Rest of Asia Pacific continues to develop AI-embedded platforms, scalable cloud services, multilingual interfaces, localized compliance, predictive analytics, and cost-effective visualization solutions for emerging markets.
By Component
By Organization Size
By Deployment
By Application
By End Use
By Country
Set to reach $5.2 Billion by 2030, growing at 14.7% CAGR during 2026-2033.
China leads with a market value of USD 1.4 billion by 2030, growing at a CAGR of 12.7% during 2026-2033.
Rising enterprise cloud adoption and AI-driven workloads are the main catalysts.
The software segment will reach USD 3.5 billion by 2030, growing at a CAGR of 14.3% during 2026-2033.
The India market is expected to witness a CAGR of 15.4% during 2026-2033.
The cloud deployment segment is expected to witness a CAGR of 15.4% during 2026-2033.
Our team of dedicated experts can provide you with attractive expansion opportunities for your business.




 Unique Offerings