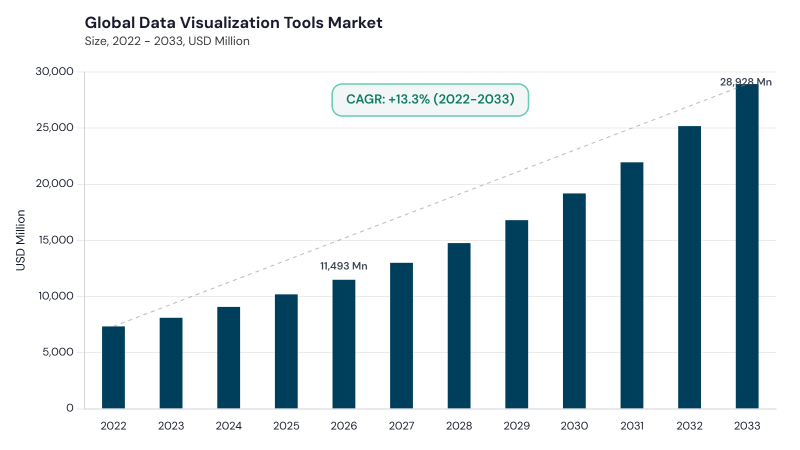
“Global Data Visualization Tools Market to reach a market value of USD 28,928.12 Million by 2033 growing at a CAGR of 14.1%”
The Global Data Visualization Tools Market is expected to reach USD 28.9 billion by 2033, growing at a CAGR of 14.1% during (2026 - 2033).
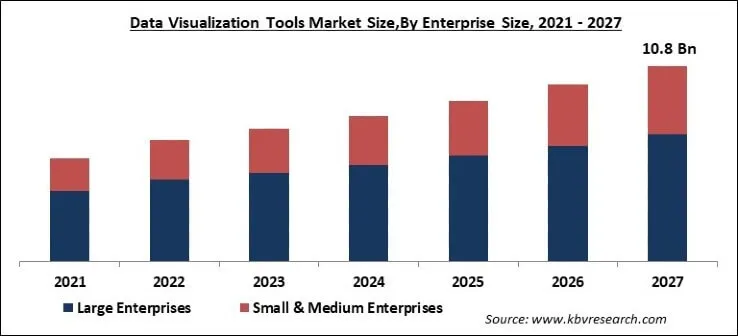
Data visualization tools market is experiencing growth across government, BFSI, enterprise, healthcare, manufacturing, retail, and technology sector because of rising reliance on real-time business intelligence, data-driven decision-making, faster performance communication, and simplified dataset interpretation. Market growth is further supported by cloud analytics, big data, embedded analytics, collaborative dashboards, artificial intelligence, natural-language querying, and self-service BI platforms. Market emerged from the needs to convert complex datasets into visual formats that faster decisions, and easier analysis.
Data visualization tools market is experiencing strong growth as enterprises largely depend on charts, dashboards, geographic analytics, and automated reporting to translate expanding data volumes into actionable insights. Market demand is growing across marketing, finance, operations, BFSI, HR, IT, manufacturing, government, retail, healthcare, and logistics functions. Real-time data streams, AI-driven visualization, cloud collaboration, embedded analytics, and governed self-service BI are reducing reliance on technical teams, enhancing decision speed, and expanding visualization usage among business users.
Competitive landscape is platform-driven with enterprise BI vendors, hyperscale technology companies, specialized visualization software companies, and cloud analytics providers competing through cloud-data connectivity, AI-enabled analytics, embedded BI, semantic modeling, pricing flexibility, interoperability, and user experience. Qlik, SAP, Microsoft, Salesforce, and Alphabet represent the leading competitive tier, while IBM, Oracle, Strategy, SAS, and Domo maintain their market positions through governed analytics, enterprise reporting, cloud-native dashboards, and specialized analytics platforms.
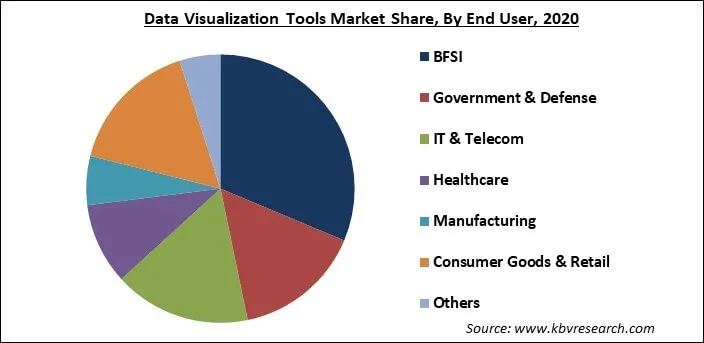
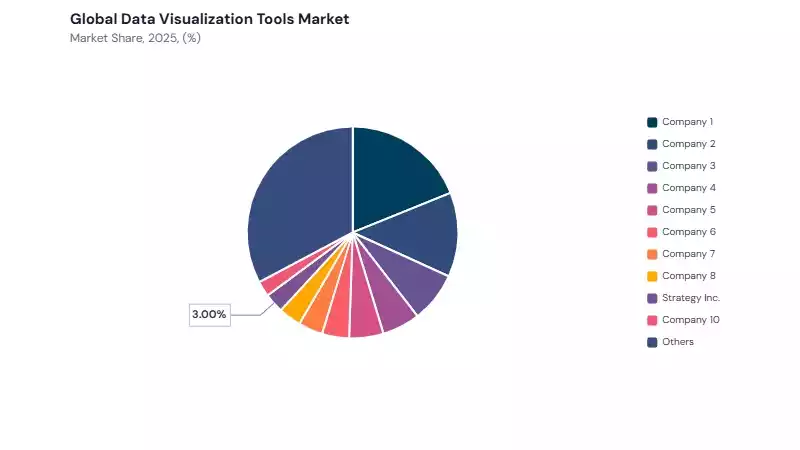
The global Data Visualization Tools Market is moderately fragmented but strongly platform-driven, with Microsoft Corporation leading the competitive landscape through Power BI, Microsoft Fabric, Azure, Microsoft 365, and Excel integration. Salesforce, Inc. holds a strong position through Tableau and its broader CRM and data ecosystem, while Qlik, SAP SE, and Alphabet Inc. through Google Cloud and Looker strengthen the platform-led competitive tier. Oracle Corporation, IBM Corporation, SAS Institute Inc., Strategy Inc., and Domo, Inc. further support competition through enterprise reporting, governed analytics, embedded dashboards, cloud-native visualization, and real-time business intelligence capabilities.
Based on Component, the market is segmented into Software and Services. The Software market dominated the Global Data Visualization Tools Market by Component in 2025, and would continue to be a dominant market till 2033; thereby, achieving a market value of USD 19.2 billion by 2033, growing at a CAGR of 13.7 % during the forecast period. The Services market is expected to witness a CAGR of 14.9% during (2026 - 2033).
Software dominates the market as enterprises increasingly rely on visualization platforms, dashboards, analytics engines, self-service BI, and embedded reporting tools to transform raw data into actionable insights. Demand is supported by AI-assisted analytics, natural-language querying, automated chart creation, real-time dashboards, and integration with business applications. Services remain important as organizations require consulting, implementation, customization, integration, training, and support to deploy visualization platforms effectively across complex data environments.
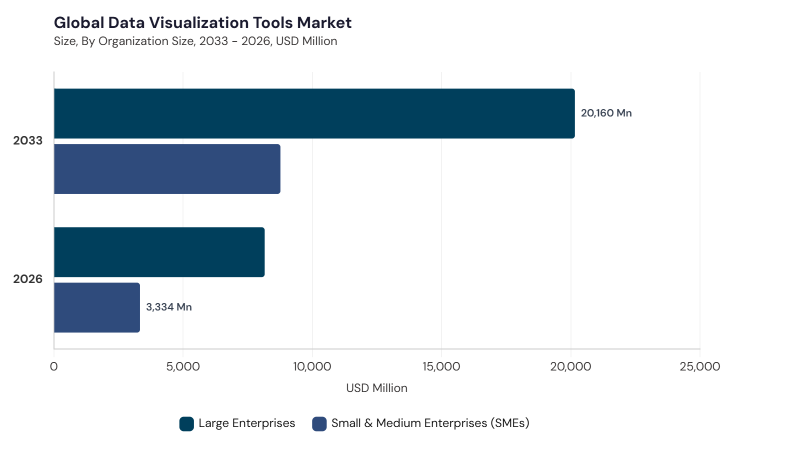
Based on Organization Size, the market is segmented into Large Enterprises and Small & Medium Enterprises (SMEs). The Large Enterprises market dominated the Global Data Visualization Tools Market by Organization Size in 2025, and would continue to be a dominant market till 2033; thereby, achieving a market value of USD 20.1 billion by 2033, growing at a CAGR of 13.8 % during the forecast period. The Small & Medium Enterprises (SMEs) market is expected to witness a CAGR of 14.8% during (2026 - 2033).
Large Enterprises lead the market due to extensive data estates, complex reporting needs, multiple business functions, and higher investment in enterprise-wide analytics platforms. These organizations use visualization tools for performance monitoring, compliance reporting, predictive insights, and executive dashboards. SMEs are gaining adoption as cloud-based visualization platforms, subscription pricing, prebuilt templates, low-code/no-code interfaces, and simplified self-service analytics make business intelligence more accessible without heavy IT investment.
Based on Deployment, the market is segmented into On-premises and Cloud. The On-premises market dominated the Global Data Visualization Tools Market by Deployment in 2025, and would continue to be a dominant market till 2033; thereby, achieving a market value of USD 16.2 billion by 2033, growing at a CAGR of 13.6 % during the forecast period. The Cloud market is expected to witness a CAGR of 14.7% during (2026 - 2033).
On-premises deployment leads the market due to demand from organizations requiring stronger control over sensitive datasets, internal infrastructure integration, customized analytics environments, and stringent governance capabilities. This model remains relevant in regulated sectors such as BFSI, healthcare, government, and large enterprises. Cloud deployment is expanding rapidly due to scalability, faster implementation, lower infrastructure burden, remote access, collaborative dashboards, SaaS models, and integration with cloud-based data warehouses, lakehouses, and enterprise applications.
Based on Application, the market is segmented into Marketing & Sales, Operations, Finance, and Human Resources. The Marketing & Sales market dominated the Global Data Visualization Tools Market by Application in 2025, and would continue to be a dominant market till 2033; thereby, achieving a market value of USD 8.8 billion by 2033, growing at a CAGR of 13.2 % during the forecast period. The Operations market is expected to witness a CAGR of 14.3% during (2026 - 2033). Additionally, The Finance market is expected to witness highest CAGR of 14.8% during (2026 - 2033).
Marketing & Sales leads the market as organizations use visualization tools for customer analytics, campaign measurement, sales funnel monitoring, market trend analysis, and revenue forecasting. Operations is supported by demand for process optimization, real-time performance monitoring, supply-chain visibility, and productivity analysis. Finance uses visualization for budgeting, risk assessment, forecasting, profitability analysis, and management reporting. Human Resources adoption is rising through workforce analytics, recruitment dashboards, employee performance tracking, retention planning, and diversity metrics.
Based on End Use, the market is segmented into BFSI, IT and Telecommunication, Manufacturing, Healthcare & Life Sciences, Retail & E-commerce, Government, Transportation & logistics, and Other End Uses. The BFSI market dominated the Global Data Visualization Tools Market by End Use in 2025, and would continue to be a dominant market till 2033; thereby, achieving a market value of USD 5.6 billion by 2033, growing at a CAGR of 12.7 % during the forecast period. The IT and Telecommunication market is expected to witness a CAGR of 12.8% during (2026 - 2033). Additionally, The Manufacturing market is expected to witness highest CAGR of 13.5% during (2026 - 2033).
BFSI dominates the market due to extensive use of visualization for risk analytics, fraud detection, financial reporting, portfolio monitoring, customer intelligence, and compliance dashboards. IT and Telecommunication demand is supported by network monitoring, service-performance analytics, cybersecurity dashboards, and cloud-resource visibility. Manufacturing uses visualization for production monitoring, predictive maintenance, quality control, and supply-chain intelligence. Healthcare & Life Sciences, Retail & E-commerce, Government, Transportation & logistics, and Other End Uses continue to adopt visualization tools to simplify complex datasets, improve operational decisions, and strengthen real-time insight generation.
Free Valuable Insights: Data Visualization Tools Market Size to reach $28.9 Billion by 2033
Region-wise, the Data Visualization Tools Market is analyzed across North America, Europe, Asia Pacific, and LAMEA. In 2025, the North America led the data visualization tools market and is anticipated to remain dominant till 2033, capturing a market value of USD 10.9 billion, expanding at a CAGR of 13.6%. The Asia Pacific region is predicted to grow at a CAGR of 14.7% during 2026-2033. Moreover, the Europe market is predicted to witness a CAGR of 13.9% during the forecast period.
North America region is experiencing growth because strong cloud infrastructure, mature enterprise analytics adoption, significant investment in AI-enabled business intelligence, and high digitalization levels. Europe is driven by data governance requirements, enterprise digital transformation, and adoption of self-service analytics across business functions. Asia Pacific is developing through rising enterprise data volumes, cloud adoption, analytics-led business transformation, and digital ecosystem development. Moreover, LAMEA is benefiting modernization of enterprise IT environments, rising through cloud penetration, and growing awareness of data-driven decision-making.
| Report Attribute | Details |
|---|---|
| Market size value in 2026 | USD 11.4 billion |
| Market size forecast in 2033 | USD 28.9 billion |
| Base Year | 2025 |
| Historical Period | 2022 to 2024 |
| Forecast Period | 2026 to 2033 |
| Revenue Growth Rate | CAGR of 14.1% from 2026 to 2033 |
| Number of Pages | 826 |
| Tables | 930 |
| Report Coverage | Market Trends, Revenue Estimation and Forecast, Segmentation Analysis, Regional and Country Breakdown, Competitive Landscape, Market Share Analysis, Company Profiling, Companies Strategic Developments, SWOT Analysis, Product Life Cycle Analysis, Value Chain Analysis, Market Consolidation Analysis, Key Customer Criteria, Pandemic Impact Analysis, and Winning Imperatives |
| Segments Covered | Component, Organization Size, Deployment, Application, End Use, Region |
| Country Scope |
|
| Companies Included | Microsoft Corporation, Salesforce, Inc., Qlik, SAP SE, Alphabet Inc., Oracle Corporation, IBM Corporation, SAS Institute Inc., and Domo, Inc. |
By Component
By Organization Size
By Deployment
By Application
By End Use
By Geography
The market is currently valued at USD 11.4 billion in 2026.
The Software segment leads, projected to reach USD 19.2 billion by 2033.
Microsoft Corporation, Salesforce, Inc., Qlik, and SAP SE are key players in the market.
North America dominates with a market value of USD 10.9 billion by 2033.
Demand for real-time data visualization and augmented analytics expansion drive growth.
The market is growing at a 14.1% CAGR during the forecast period (2026-2033).
Our team of dedicated experts can provide you with attractive expansion opportunities for your business.








 Unique Offerings