Europe Virtual Goods Market Size, Share & Industry Analysis Report By Type (In-Game, and Virtual Currency), By Platform (Mobile, and Console), By Country Outlook and Forecast, 2026 - 2033
Published Date : 25-Oct-2026 |
Pages: 168 |
Report Format: PDF + Excel |
COVID-19 Impact on the Europe Virtual Goods Market
The Europe Virtual Goods Market is expected to reach USD 35.6 billion by 2031, growing at a CAGR of 9.5% during (2026 - 2033).
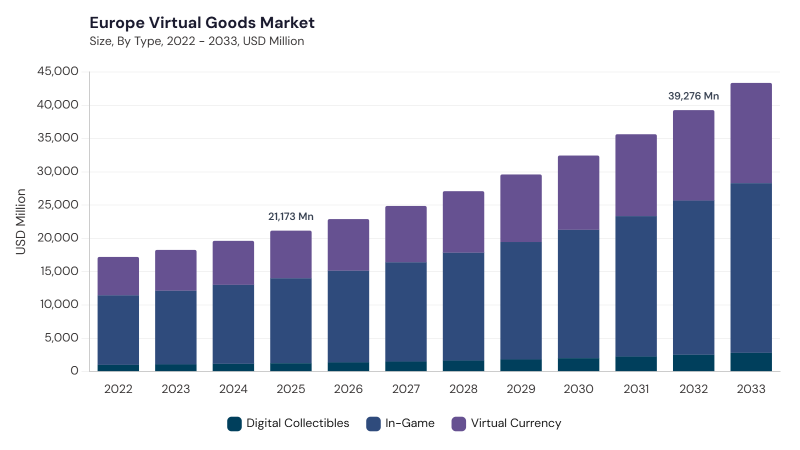
The Europe Virtual Goods Market originated in the early 2000s with the rise of online gaming platforms and digital content ecosystems, initially centered on in-game currency and basic cosmetic items. Early adoption was limited by basic digital distribution and payment systems, but increasing broadband penetration, mature digital payments, smartphones, blockchain, NFTs, AR, VR, and metaverse initiatives expanded virtual goods into more immersive and tradable digital assets. The market has since evolved into a blended ecosystem of entertainment, social interaction, gaming, commerce, personalization, and digital ownership.
Current market growth is shaped by blockchain-enabled ownership, NFTs, social metaverse environments, regulatory compliance, AR/VR adoption, and AI-driven personalization. Consumers are increasingly using virtual goods for identity expression, digital collectibles, avatar customization, gaming status, and interactive experiences across platforms. At the same time, European regulatory focus on data privacy, digital transactions, consumer protection, and transparent ownership is encouraging platforms to build secure, compliant, and trust-based virtual goods ecosystems.
Type Outlook
Based on Type, the market is segmented into In-Game, Virtual Currency, and Digital Collectibles. The In-Game market dominated the Europe Virtual Goods Market by Type in 2025, and would continue to be a dominant market till 2033; thereby, achieving a market value of USD 21.1 billion by 2031, growing at a CAGR of 9.2 % during the forecast period. The Virtual Currency market is expected to witness a CAGR of 9.9% during (2026 - 2033). The Digital Collectibles market is expected to witness a CAGR of 10.7% during (2026 - 2033).
In-Game virtual goods remain central as users purchase skins, weapons, avatars, gameplay enhancements, event-based items, and customization assets that support engagement and recurring monetization. Virtual Currency maintains a considerable position as platform-specific digital money helps users purchase content, unlock features, access digital marketplaces, and complete microtransactions with lower payment friction. Digital Collectibles hold a promising role through NFTs, digital art, trading cards, exclusive virtual merchandise, entertainment-linked collectibles, and blockchain-supported ownership models that emphasize scarcity, provenance, and tradability.
Platform Outlook
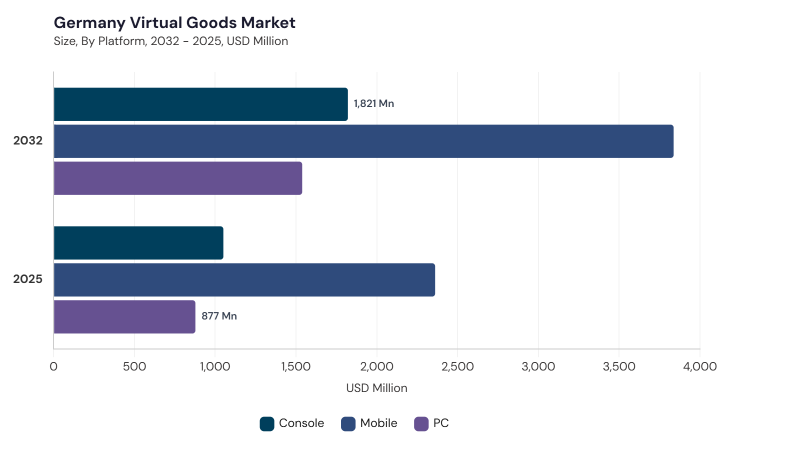
Based on Platform, the market is segmented into Mobile, Console, and PC. Mobile platforms remain highly important because casual gaming, social apps, in-app currency, subscription services, short-session entertainment, 5G connectivity, social commerce, and mobile wallets support frequent low-value virtual goods purchases.
Console platforms maintain a considerable share through PlayStation, Xbox, Nintendo, premium franchises, downloadable content, expansion packs, exclusive skins, subscription ecosystems, and persistent multiplayer environments. PC platforms hold a promising position through hardcore gaming communities, digital distribution platforms, mods, skins, virtual currencies, access passes, esports, streaming influence, blockchain applications, and user-driven marketplaces.
Free Valuable Insights: The Worldwide Virtual Goods Market is projected to reach USD 217.5 Billion billion by 2033, at a CAGR of 9.8%
Country Outlook
Based on Country, the market is segmented into Germany, UK, France, Russia, Spain, Italy, and Rest of Europe. The Germany market dominated the Europe Virtual Goods Market by Country in 2025, and would continue to be a dominant market till 2033; thereby, achieving a market value of USD 6.6 billion by 2031, growing at a CAGR of 7.9 % during the forecast period. The UK market is expected to witness a CAGR of 8.6% during (2026 - 2033). Additionally, The France market is expected to witness a CAGR of 10.5% during (2026 - 2033).
Germany is supported by AR/VR adoption, blockchain-based ownership, NFTs, secure payment systems, and strong regulatory compliance, while the UK is shaped by NFTs, social platforms, metaverse experiences, esports, streaming culture, and consumer-protection scrutiny. France reflects blockchain authentication, AR/VR experiences, digital wallets, fintech-backed payments, and EU-aligned digital asset regulation, whereas Russia emphasizes mobile gaming, microtransactions, fintech partnerships, localized payment systems, and blockchain-based virtual assets. Spain is advancing through AR/VR-compatible goods, social media-linked digital identity, NFTs, consumer protection, and localized virtual goods experiences; Italy is driven by AI personalization, blockchain verification, secure transactions, and localized digital assets; and Rest of Europe is supported by mobile gaming, virtual currencies, NFTs, blockchain ownership, metaverse-linked assets, personalization, and stronger digital transaction transparency.
List of Key Companies Profiled
- Tencent
- NetEase
- Sony
- Roblox
- Microsoft
- Electronic Arts
- Epic Games
- Take-Two
- Scopely
- Valve
Europe Virtual Goods Market Report Segmentation
By Type
- In-Game
- Virtual Currency
- Digital Collectibles
By Platform
- Mobile
- Console
- PC
By Country
- Germany
- UK
- France
- Russia
- Spain
- Italy
- Rest of Europe
1.1 Market Overview
1.2 Key Factors Impacting Market
1.2.1 Market Drivers
1.2.2 Market Restraints
1.2.3 Market Opportunities
1.2.4 Market Challenges
1.2.5 Market Trends
1.2.6 State of Competition
1.2.7 Market Consolidation
1.2.8 Key Customer Criteria
1.3 Product Life Cycle
1.4 Segmentation By Type
1.4.1 In-Game
1.4.2 Virtual Currency
1.4.3 Digital Collectibles
1.5 Segmentation By Platform
1.5.1 Mobile
1.5.2 Console
1.5.3 PC
1.6 Segmentation By Country
1.6.1 Germany
1.6.1.1 Segmentation By Type
1.6.1.1.1 In-Game
1.6.1.1.2 Virtual Currency
1.6.1.1.3 Digital Collectibles
1.6.1.2 Segmentation By Platform
1.6.1.2.1 Mobile
1.6.1.2.2 Console
1.6.1.2.3 PC
1.6.2 UK
1.6.2.1 Segmentation By Type
1.6.2.1.1 In-Game
1.6.2.1.2 Virtual Currency
1.6.2.1.3 Digital Collectibles
1.6.2.2 Segmentation By Platform
1.6.2.2.1 Mobile
1.6.2.2.2 Console
1.6.2.2.3 PC
1.6.3 France
1.6.3.1 Segmentation By Type
1.6.3.1.1 In-Game
1.6.3.1.2 Virtual Currency
1.6.3.1.3 Digital Collectibles
1.6.3.2 Segmentation By Platform
1.6.3.2.1 Mobile
1.6.3.2.2 Console
1.6.3.2.3 PC
1.6.4 Russia
1.6.4.1 Segmentation By Type
1.6.4.1.1 In-Game
1.6.4.1.2 Virtual Currency
1.6.4.1.3 Digital Collectibles
1.6.4.2 Segmentation By Platform
1.6.4.2.1 Mobile
1.6.4.2.2 Console
1.6.4.2.3 PC
1.6.5 Spain
1.6.5.1 Segmentation By Type
1.6.5.1.1 In-Game
1.6.5.1.2 Virtual Currency
1.6.5.1.3 Digital Collectibles
1.6.5.2 Segmentation By Platform
1.6.5.2.1 Mobile
1.6.5.2.2 Console
1.6.5.2.3 PC
1.6.6 Italy
1.6.6.1 Segmentation By Type
1.6.6.1.1 In-Game
1.6.6.1.2 Virtual Currency
1.6.6.1.3 Digital Collectibles
1.6.6.2 Segmentation By Platform
1.6.6.2.1 Mobile
1.6.6.2.2 Console
1.6.6.2.3 PC
1.6.7 Rest of Europe
1.6.7.1 Segmentation By Type
1.6.7.1.1 In-Game
1.6.7.1.2 Virtual Currency
1.6.7.1.3 Digital Collectibles
1.6.7.2 Segmentation By Platform
1.6.7.2.1 Mobile
1.6.7.2.2 Console
1.6.7.2.3 PC
Chapter 2. Company Snapshots
2.1 Tencent
2.1.1 Business Overview
2.1.2 Key Information
2.1.3 Company Focus on Virtual Goods Market
2.1.4 Strategic Insights
2.1.5 Strategy Deployed
2.1.6 Product & Service Portfolio
2.1.7 Technology & Innovation Focus
2.1.8 SWOT Analysis
2.1.9 Key Differentiators
2.1.10 Future Outlook
2.2 NetEase
2.2.1 Business Overview
2.2.2 Key Information
2.2.3 Company Focus on Virtual Goods Market
2.2.4 Strategic Insights
2.2.5 Strategy Deployed
2.2.6 Portfolio Matrix
2.2.7 SWOT Analysis
2.2.8 Key Differentiators
2.2.9 Future Outlook
2.3 Sony
2.3.1 Business Overview
2.3.2 Key Information
2.3.3 Company Focus on Virtual Goods Market
2.3.4 Strategic Insights / Strategy Deployed
2.3.5 Portfolio Matrix
2.3.6 SWOT Analysis
2.3.7 Key Differentiators
2.3.8 Future Outlook
2.4 Roblox
2.4.1 Business Overview
2.4.2 Key Information
2.4.3 Company Focus on Virtual Goods Market
2.4.4 Strategic Insights
2.4.5 Strategy Deployed
2.4.6 Portfolio Matrix
2.4.7 SWOT Analysis
2.4.8 Key Differentiators
2.4.9 Future Outlook
2.5 Microsoft
2.5.1 Business Overview
2.5.2 Key Information
2.5.3 Company Focus on Virtual Goods Market
2.5.4 Strategic Insights / Strategy Deployed
2.5.5 Portfolio Matrix
2.5.6 SWOT Analysis
2.5.7 Key Differentiators
2.5.8 Future Outlook
2.6 Electronic Arts
2.6.1 Business Overview
2.6.2 Key Information
2.6.3 Company Focus on Virtual Goods Market
2.6.4 Strategic Insights / Strategy Deployed
2.6.5 Portfolio Matrix
2.6.6 SWOT Analysis
2.6.7 Key Differentiators
2.6.8 Future Outlook
2.7 Epic Games
2.7.1 Business Overview
2.7.2 Key Information
2.7.3 Company Focus on Virtual Goods Market
2.7.4 Strategic Insights / Strategy Deployed
2.7.5 Portfolio Matrix
2.7.6 SWOT Analysis
2.7.7 Key Differentiators
2.7.8 Future Outlook
2.8 Take-Two
2.8.1 Business Overview
2.8.2 Key Information
2.8.3 Company Focus on Virtual Goods Market
2.8.4 Strategic Insights / Strategy Deployed
2.8.5 Portfolio Matrix
2.8.6 SWOT Analysis
2.8.7 Key Differentiators
2.8.8 Future Outlook
2.9 Scopely
2.9.1 Business Overview
2.9.2 Key Information
2.9.3 Company Focus on Virtual Goods Market
2.9.4 Strategic Insights / Strategy Deployed
2.9.5 Portfolio Matrix
2.9.6 SWOT Analysis
2.9.7 Key Differentiators
2.9.8 Future Outlook
2.10 Valve
2.10.1 Business Overview
2.10.2 Key Information
2.10.3 Company Focus on Virtual Goods Market
2.10.4 Strategic Insights
2.10.5 Strategy Deployed
2.10.6 Portfolio Matrix
2.10.7 SWOT Analysis
2.10.8 Key Differentiators
2.10.9 Future Outlook
Table 1 Europe Virtual Goods Market Market, 2022 - 2033, USD Million
Table 2 Europe Virtual Goods Market Market by Platform, 2022 - 2033, USD Million
Table 3 Europe Console Market, 2022 - 2033, USD Million
Table 4 Europe Mobile Market, 2022 - 2033, USD Million
Table 5 Europe PC Market, 2022 - 2033, USD Million
Table 6 Europe Virtual Goods Market Market by Type, 2022 - 2033, USD Million
Table 7 Europe Digital Collectibles Market, 2022 - 2033, USD Million
Table 8 Europe In-Game Market, 2022 - 2033, USD Million
Table 9 Europe Virtual Currency Market, 2022 - 2033, USD Million
Table 10 Germany Virtual Goods Market Market, 2022 - 2033, USD Million
Table 11 Germany Virtual Goods Market Market by Platform, 2022 - 2033, USD Million
Table 12 Germany Console Market, 2022 - 2033, USD Million
Table 13 Germany Mobile Market, 2022 - 2033, USD Million
Table 14 Germany PC Market, 2022 - 2033, USD Million
Table 15 Germany Virtual Goods Market Market by Type, 2022 - 2033, USD Million
Table 16 Germany Digital Collectibles Market, 2022 - 2033, USD Million
Table 17 Germany In-Game Market, 2022 - 2033, USD Million
Table 18 Germany Virtual Currency Market, 2022 - 2033, USD Million
Table 19 United Kingdom Virtual Goods Market Market, 2022 - 2033, USD Million
Table 20 United Kingdom Virtual Goods Market Market by Platform, 2022 - 2033, USD Million
Table 21 United Kingdom Console Market, 2022 - 2033, USD Million
Table 22 United Kingdom Mobile Market, 2022 - 2033, USD Million
Table 23 United Kingdom PC Market, 2022 - 2033, USD Million
Table 24 United Kingdom Virtual Goods Market Market by Type, 2022 - 2033, USD Million
Table 25 United Kingdom Digital Collectibles Market, 2022 - 2033, USD Million
Table 26 United Kingdom In-Game Market, 2022 - 2033, USD Million
Table 27 United Kingdom Virtual Currency Market, 2022 - 2033, USD Million
Table 28 France Virtual Goods Market Market, 2022 - 2033, USD Million
Table 29 France Virtual Goods Market Market by Platform, 2022 - 2033, USD Million
Table 30 France Console Market, 2022 - 2033, USD Million
Table 31 France Mobile Market, 2022 - 2033, USD Million
Table 32 France PC Market, 2022 - 2033, USD Million
Table 33 France Virtual Goods Market Market by Type, 2022 - 2033, USD Million
Table 34 France Digital Collectibles Market, 2022 - 2033, USD Million
Table 35 France In-Game Market, 2022 - 2033, USD Million
Table 36 France Virtual Currency Market, 2022 - 2033, USD Million
Table 37 Russia Virtual Goods Market Market, 2022 - 2033, USD Million
Table 38 Russia Virtual Goods Market Market by Platform, 2022 - 2033, USD Million
Table 39 Russia Console Market, 2022 - 2033, USD Million
Table 40 Russia Mobile Market, 2022 - 2033, USD Million
Table 41 Russia PC Market, 2022 - 2033, USD Million
Table 42 Russia Virtual Goods Market Market by Type, 2022 - 2033, USD Million
Table 43 Russia Digital Collectibles Market, 2022 - 2033, USD Million
Table 44 Russia In-Game Market, 2022 - 2033, USD Million
Table 45 Russia Virtual Currency Market, 2022 - 2033, USD Million
Table 46 Spain Virtual Goods Market Market, 2022 - 2033, USD Million
Table 47 Spain Virtual Goods Market Market by Platform, 2022 - 2033, USD Million
Table 48 Spain Console Market, 2022 - 2033, USD Million
Table 49 Spain Mobile Market, 2022 - 2033, USD Million
Table 50 Spain PC Market, 2022 - 2033, USD Million
Table 51 Spain Virtual Goods Market Market by Type, 2022 - 2033, USD Million
Table 52 Spain Digital Collectibles Market, 2022 - 2033, USD Million
Table 53 Spain In-Game Market, 2022 - 2033, USD Million
Table 54 Spain Virtual Currency Market, 2022 - 2033, USD Million
Table 55 Italy Virtual Goods Market Market, 2022 - 2033, USD Million
Table 56 Italy Virtual Goods Market Market by Platform, 2022 - 2033, USD Million
Table 57 Italy Console Market, 2022 - 2033, USD Million
Table 58 Italy Mobile Market, 2022 - 2033, USD Million
Table 59 Italy PC Market, 2022 - 2033, USD Million
Table 60 Italy Virtual Goods Market Market by Type, 2022 - 2033, USD Million
Table 61 Italy Digital Collectibles Market, 2022 - 2033, USD Million
Table 62 Italy In-Game Market, 2022 - 2033, USD Million
Table 63 Italy Virtual Currency Market, 2022 - 2033, USD Million
Table 64 Rest of Europe Virtual Goods Market Market, 2022 - 2033, USD Million
Table 65 Rest of Europe Virtual Goods Market Market by Platform, 2022 - 2033, USD Million
Table 66 Rest of Europe Console Market, 2022 - 2033, USD Million
Table 67 Rest of Europe Mobile Market, 2022 - 2033, USD Million
Table 68 Rest of Europe PC Market, 2022 - 2033, USD Million
Table 69 Rest of Europe Virtual Goods Market Market by Type, 2022 - 2033, USD Million
Table 70 Rest of Europe Digital Collectibles Market, 2022 - 2033, USD Million
Table 71 Rest of Europe In-Game Market, 2022 - 2033, USD Million
Table 72 Rest of Europe Virtual Currency Market, 2022 - 2033, USD Million
List of Figures
FIG 1 Key Factors Impacting Market
FIG 2 Market Consolidation
FIG 3 Key Customer Criteria
FIG 4 Product Life Cycle
FIG 5 Europe Virtual Goods Market Market, 2022 - 2033, USD Million
FIG 6 Europe Virtual Goods Market Market by Platform, 2022 - 2033, USD Million
FIG 7 Europe Console Market, 2022 - 2033, USD Million
FIG 8 Europe Mobile Market, 2022 - 2033, USD Million
FIG 9 Europe PC Market, 2022 - 2033, USD Million
FIG 10 Europe Virtual Goods Market Market by Type, 2022 - 2033, USD Million
FIG 11 Europe Digital Collectibles Market, 2022 - 2033, USD Million
FIG 12 Europe In-Game Market, 2022 - 2033, USD Million
FIG 13 Europe Virtual Currency Market, 2022 - 2033, USD Million
FIG 14 Germany Virtual Goods Market Market, 2022 - 2033, USD Million
FIG 15 Germany Virtual Goods Market Market by Platform, 2022 - 2033, USD Million
FIG 16 Germany Console Market, 2022 - 2033, USD Million
FIG 17 Germany Mobile Market, 2022 - 2033, USD Million
FIG 18 Germany PC Market, 2022 - 2033, USD Million
FIG 19 Germany Virtual Goods Market Market by Type, 2022 - 2033, USD Million
FIG 20 Germany Digital Collectibles Market, 2022 - 2033, USD Million
FIG 21 Germany In-Game Market, 2022 - 2033, USD Million
FIG 22 Germany Virtual Currency Market, 2022 - 2033, USD Million
FIG 23 United Kingdom Virtual Goods Market Market, 2022 - 2033, USD Million
FIG 24 United Kingdom Virtual Goods Market Market by Platform, 2022 - 2033, USD Million
FIG 25 United Kingdom Console Market, 2022 - 2033, USD Million
FIG 26 United Kingdom Mobile Market, 2022 - 2033, USD Million
FIG 27 United Kingdom PC Market, 2022 - 2033, USD Million
FIG 28 United Kingdom Virtual Goods Market Market by Type, 2022 - 2033, USD Million
FIG 29 United Kingdom Digital Collectibles Market, 2022 - 2033, USD Million
FIG 30 United Kingdom In-Game Market, 2022 - 2033, USD Million
FIG 31 United Kingdom Virtual Currency Market, 2022 - 2033, USD Million
FIG 32 France Virtual Goods Market Market, 2022 - 2033, USD Million
FIG 33 France Virtual Goods Market Market by Platform, 2022 - 2033, USD Million
FIG 34 France Console Market, 2022 - 2033, USD Million
FIG 35 France Mobile Market, 2022 - 2033, USD Million
FIG 36 France PC Market, 2022 - 2033, USD Million
FIG 37 France Virtual Goods Market Market by Type, 2022 - 2033, USD Million
FIG 38 France Digital Collectibles Market, 2022 - 2033, USD Million
FIG 39 France In-Game Market, 2022 - 2033, USD Million
FIG 40 France Virtual Currency Market, 2022 - 2033, USD Million
FIG 41 Russia Virtual Goods Market Market, 2022 - 2033, USD Million
FIG 42 Russia Virtual Goods Market Market by Platform, 2022 - 2033, USD Million
FIG 43 Russia Console Market, 2022 - 2033, USD Million
FIG 44 Russia Mobile Market, 2022 - 2033, USD Million
FIG 45 Russia PC Market, 2022 - 2033, USD Million
FIG 46 Russia Virtual Goods Market Market by Type, 2022 - 2033, USD Million
FIG 47 Russia Digital Collectibles Market, 2022 - 2033, USD Million
FIG 48 Russia In-Game Market, 2022 - 2033, USD Million
FIG 49 Russia Virtual Currency Market, 2022 - 2033, USD Million
FIG 50 Spain Virtual Goods Market Market, 2022 - 2033, USD Million
FIG 51 Spain Virtual Goods Market Market by Platform, 2022 - 2033, USD Million
FIG 52 Spain Console Market, 2022 - 2033, USD Million
FIG 53 Spain Mobile Market, 2022 - 2033, USD Million
FIG 54 Spain PC Market, 2022 - 2033, USD Million
FIG 55 Spain Virtual Goods Market Market by Type, 2022 - 2033, USD Million
FIG 56 Spain Digital Collectibles Market, 2022 - 2033, USD Million
FIG 57 Spain In-Game Market, 2022 - 2033, USD Million
FIG 58 Spain Virtual Currency Market, 2022 - 2033, USD Million
FIG 59 Italy Virtual Goods Market Market, 2022 - 2033, USD Million
FIG 60 Italy Virtual Goods Market Market by Platform, 2022 - 2033, USD Million
FIG 61 Italy Console Market, 2022 - 2033, USD Million
FIG 62 Italy Mobile Market, 2022 - 2033, USD Million
FIG 63 Italy PC Market, 2022 - 2033, USD Million
FIG 64 Italy Virtual Goods Market Market by Type, 2022 - 2033, USD Million
FIG 65 Italy Digital Collectibles Market, 2022 - 2033, USD Million
FIG 66 Italy In-Game Market, 2022 - 2033, USD Million
FIG 67 Italy Virtual Currency Market, 2022 - 2033, USD Million
FIG 68 Rest of Europe Virtual Goods Market Market, 2022 - 2033, USD Million
FIG 69 Rest of Europe Virtual Goods Market Market by Platform, 2022 - 2033, USD Million
FIG 70 Rest of Europe Console Market, 2022 - 2033, USD Million
FIG 71 Rest of Europe Mobile Market, 2022 - 2033, USD Million
FIG 72 Rest of Europe PC Market, 2022 - 2033, USD Million
FIG 73 Rest of Europe Virtual Goods Market Market by Type, 2022 - 2033, USD Million
FIG 74 Rest of Europe Digital Collectibles Market, 2022 - 2033, USD Million
FIG 75 Rest of Europe In-Game Market, 2022 - 2033, USD Million
FIG 76 Rest of Europe Virtual Currency Market, 2022 - 2033, USD Million