The sample copy of this report is available for access.
The Asia Pacific Inventory Tags Market is expected to reach USD 2070.0 million by 2030, growing at a CAGR of 5.4% during (2026 - 2033).
The Asia Pacific Inventory Tags Market originated from the broader adoption of inventory management and tracking systems as regional supply chains expanded through industrialization and globalization. Early adoption relied mainly on barcode technology for warehousing and retail accuracy, while later transitions toward QR codes, RFID, NFC, and IoT-enabled tags improved real-time visibility, automation, and ERP integration. The market has since evolved into an intelligent inventory ecosystem where tags support cloud-based tracking, AI-driven analytics, regulatory compliance, and data-led supply chain decisions.
Current market growth is shaped by RFID and IoT-enabled smart tags, traceability requirements, anti-counterfeiting needs, sustainability, and e-commerce expansion. Smart inventory tags are enabling real-time tracking, predictive replenishment, automated audits, and better stock accuracy across retail, logistics, manufacturing, and healthcare. At the same time, secure and tamper-evident tags are gaining relevance in pharmaceuticals, food, and electronics, while recyclable and biodegradable materials are becoming important as regional businesses align inventory systems with green supply chain practices.
Based on Application, the market is segmented into Inventory Tracking & Monitoring, Asset Management, Supply Chain Tracking & Visibility, Outdoor & Travel Safety, and Other Application. The Inventory Tracking & Monitoring market dominated the Asia Pacific Inventory Tags Market by Application in 2025, and would continue to be a dominant market till 2033; thereby, achieving a market value of USD 752.1 million by 2030, growing at a CAGR of 4.7 % during the forecast period. The Asset Management market is expected to witness a CAGR of 5.2% during (2026 - 2033). The Other Application market is expected to witness a CAGR of 6.9% during (2026 - 2033).
Inventory Tracking & Monitoring remains central as warehouses, retailers, manufacturers, and distribution centers use RFID, barcode, and smart sensor tags for real-time stock visibility, automated audits, and reduced inventory errors. Asset Management maintains substantial adoption through lifecycle tracking, equipment utilization, preventive maintenance, and high-value asset control across healthcare, construction, transportation, and IT infrastructure. Supply Chain Tracking & Visibility supports end-to-end movement tracking, customs transit visibility, last-mile delivery monitoring, and anti-counterfeiting across complex logistics networks. Outdoor & Travel Safety serves equipment, personnel, luggage, and field asset tracking in mining, tourism, logistics, and event environments. Other Application includes animal tracking, library assets, document monitoring, waste management, agriculture, government, and institutional uses.
Based on End Use, the market is segmented into Retail & E-commerce, Transportation & Logistics, Manufacturing, Healthcare, and Other End Use. The Retail & E-commerce market dominated the Asia Pacific Inventory Tags Market by End Use in 2025, and would continue to be a dominant market till 2033; thereby, achieving a market value of USD 695.5 million by 2030, growing at a CAGR of 4.6 % during the forecast period. The Transportation & Logistics market is expected to witness a CAGR of 5.2% during (2026 - 2033). Additionally, The Manufacturing market is expected to witness highest CAGR of 5.7% during (2026 - 2033).
Retail & E-commerce uses inventory tags to support real-time stock visibility, theft prevention, warehouse automation, omnichannel fulfillment, and faster replenishment. Transportation & Logistics relies on tags for pallet, container, package, shipment, fleet, and warehouse tracking across ports, courier networks, freight operators, and distribution centers. Manufacturing applies tags for asset management, work-in-progress tracking, raw material monitoring, production visibility, and ERP-linked factory automation. Healthcare adoption is supported by pharmaceutical traceability, medical equipment tracking, consumable inventory control, sterilization-cycle monitoring, and patient-safety requirements. Other End Use includes agriculture, education, government, hospitality, public infrastructure, and other specialized sectors requiring customized inventory visibility.
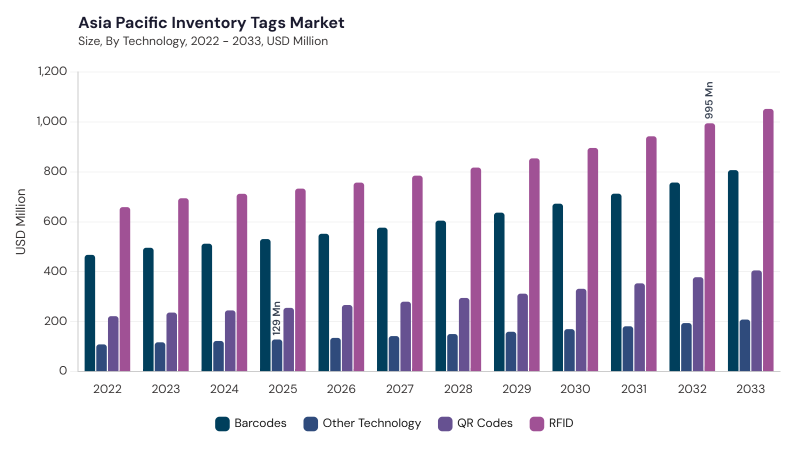
Based on Technology, the market is segmented into RFID, Barcodes, QR Codes, and Other Technology. RFID remains the leading technology due to fast contactless scanning, non-line-of-sight identification, item-level visibility, automation support, and integration with IoT-enabled supply chain systems. Barcodes retain strong adoption because of affordability, ease of implementation, established scanning infrastructure, and suitability for cost-sensitive businesses and straightforward inventory workflows.
QR Codes continue to expand through smartphone accessibility, higher data capacity, cloud linkage, authentication, and product information access. Other Technology includes NFC, Bluetooth Low Energy, Data Matrix codes, BLE beacons, and sensor-based smart tags used for anti-counterfeiting, indoor asset tracking, proximity-based interaction, secure authentication, and specialized monitoring applications.
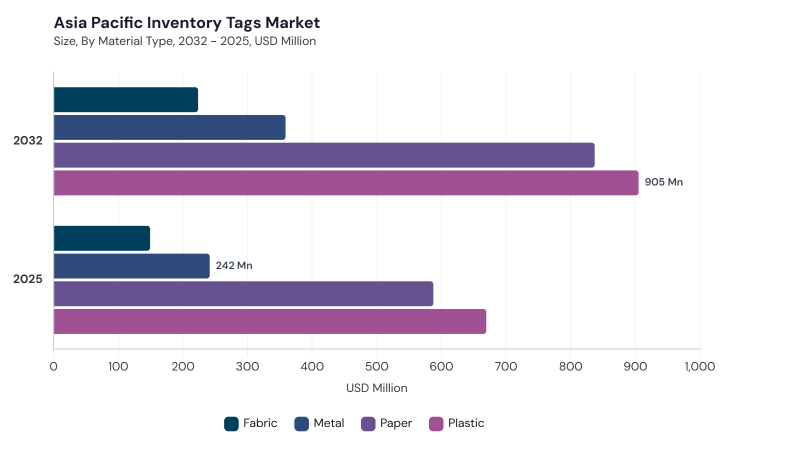
Based on Material Type, the market is segmented into Plastic, Paper, Metal, and Fabric. Plastic tags are widely used because they offer durability, moisture resistance, chemical resistance, cost efficiency, customization flexibility, and compatibility with RFID or barcode systems. Paper tags maintain significant adoption in high-volume retail, e-commerce, publishing, and light manufacturing applications due to low cost, printability, biodegradability, and suitability for temporary labeling.
Metal tags serve automotive, machinery, aerospace, mining, and heavy industrial environments where heat, corrosion, abrasion, and long-term asset traceability are critical. Fabric tags hold a promising role in textiles, apparel, hospitality, hotel linen, garment tracking, reusable textile assets, and applications requiring flexible, washable identification.
Free Valuable Insights: Inventory Tags Market is Predicted to reach USD 8.2 Billion billion by 2033, at a CAGR of 4.9%
Based on Country, the market is segmented into China, Japan, India, South Korea, Singapore, Malaysia, and Rest of Asia Pacific. The China market dominated the Asia Pacific Inventory Tags Market by Country in 2025, and would continue to be a dominant market till 2033; thereby, achieving a market value of USD 661.2 million by 2030, growing at a CAGR of 3.8 % during the forecast period. The Japan market is expected to witness a CAGR of 4.6% during (2026 - 2033). Additionally, The India market is expected to witness a CAGR of 6.2% during (2026 - 2033).
China is shaped by RFID adoption, IoT integration, cloud platforms, AI analytics, and sustainable tag materials, while Japan reflects smart RFID, IoT infrastructure, eco-friendly tags, and sensor-enabled monitoring for quality-sensitive sectors. India is driven by RFID and IoT integration, sector-specific compliance, cloud-based inventory systems, and e-commerce-led inventory control. South Korea is supported by IoT and AI-enabled tags, warehouse automation, sustainable materials, and robotics-compatible systems, whereas Singapore is influenced by RFID-IoT adoption, cloud-based inventory platforms, eco-friendly tags, and smart logistics. Malaysia is progressing through RFID adoption, cloud inventory platforms, sustainable tags, IoT-enabled monitoring, and localized digital ecosystems, while Rest of Asia Pacific is shaped by smart inventory tags, IoT sensors, AI analytics, sustainable materials, labor automation, and region-specific inventory digitization.
By Application
By Technology
By Material Type
By End Use
By Country
Set to reach $2070.0 Million by 2030, growing at 5.4% CAGR during 2026-2033.
China leads with $661.2 million by 2030, growing at 3.8% CAGR during 2026-2033.
Retail & E-commerce segment dominates, reaching $695.5 million by 2030 at 4.6% CAGR during 2026-2033.
Inventory Tracking & Monitoring hits $752.1 million by 2030, growing at 4.7% CAGR during 2026-2033.
India is expected to witness a CAGR of 6.2% during 2026-2033.
Manufacturing is expected to witness the highest CAGR of 5.7% during 2026-2033.
Our team of dedicated experts can provide you with attractive expansion opportunities for your business.



 Unique Offerings
