Asia Pacific Healthcare Business Intelligence Market Size, Share & Industry Analysis Report By Component (Software, and Services), By Mode of Delivery (Cloud-based, Hybrid, and On-premise), By Application (Financial Analysis, Operational Analysis, and Clinical Analysis), By End Use (Payers, and Healthcare Providers), By Country Outlook and Forecast, 2026 - 2033
Published Date : 02-Sep-2026 |
Pages: 300 |
Report Format: PDF + Excel |
COVID-19 Impact on the Asia Pacific Healthcare Business Intelligence Market
The Asia Pacific Healthcare Business Intelligence Market is expected to reach USD 4.8 billion by 2030, growing at a CAGR of 14.5% during (2026 – 2033).
The Asia Pacific Healthcare Business Intelligence Market developed as hospitals, public health agencies, payers, and healthcare networks began using digital tools to manage growing clinical and administrative data. Early adoption centered on electronic health records, basic analytics, and reporting systems designed to improve patient records and operational visibility. As cloud computing, big data analytics, AI, and interoperable platforms advanced, healthcare BI shifted from fragmented reporting to predictive and real-time decision support. Telehealth expansion, remote monitoring, and digital infrastructure upgrades further widened the role of analytics across the region.
The Asia Pacific Healthcare Business Intelligence Market is being shaped by rising healthcare digitalization, AI adoption, remote care expansion, disease management needs, and increasing pressure to improve healthcare accessibility and efficiency. Healthcare providers, payers, and manufacturers are using BI solutions to support claims analysis, clinical decisions, operational planning, revenue management, supply chain visibility, and population health programs. Demand is supported by EHR adoption, predictive analytics, telehealth data, wearable devices, cloud platforms, edge computing, and regulatory progress around privacy and data governance.
Component Outlook
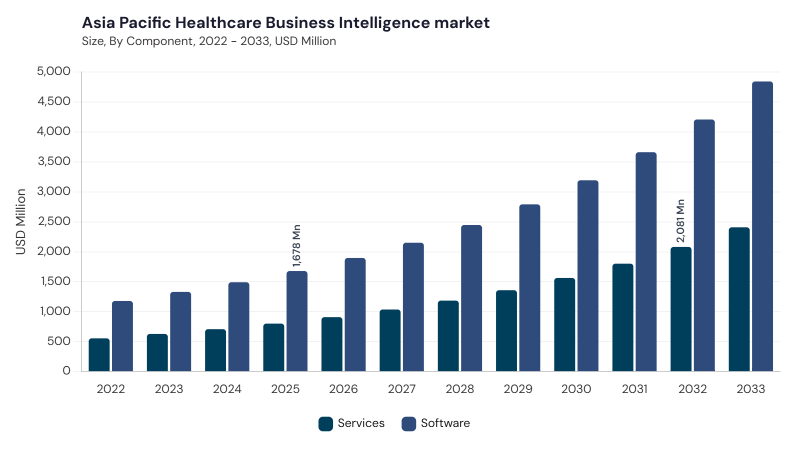
Based on Component, the market is segmented into Software and Services. The Software market dominated the Asia Pacific Healthcare Business Intelligence Market by Component in 2025, and would continue to be a dominant market till 2033; thereby, achieving a market value of USD 3.2 billion by 2030, growing at a CAGR of 14.3 % during the forecast period. The Services market is expected to witness a CAGR of 14.9% during (2026 - 2033).
Software leads because healthcare organizations depend on analytics platforms, dashboards, predictive models, reporting tools, and AI-enabled systems to manage large clinical, financial, and operational datasets. These solutions support EHR analytics, population health management, remote care monitoring, financial planning, and patient outcome improvement. Services remain significant as healthcare institutions need consulting, implementation, integration, customization, training, maintenance, and compliance support. This segment benefits from fragmented IT systems, shortage of in-house BI talent, cloud migration, AI deployment, and the need for tailored implementation across diverse Asia Pacific healthcare environments.
Mode of Delivery Outlook
Based on Mode of Delivery, the market is segmented into Cloud-based, On-premise, and Hybrid. The Cloud-based market dominated the Asia Pacific Healthcare Business Intelligence Market by Mode of Delivery in 2025, and would continue to be a dominant market till 2033; thereby, achieving a market value of USD 2.2 billion by 2030, growing at a CAGR of 13.9 % during the forecast period. The On-premise market is expected to witness a CAGR of 14.9% during (2026 - 2033). The Hybrid market is expected to witness a CAGR of 15.2% during (2026 - 2033).
Cloud-based delivery leads as healthcare organizations seek scalable, flexible, cost-efficient, and remotely accessible analytics platforms across distributed care settings. Cloud BI supports real-time reporting, telehealth analytics, population health management, AI processing, and collaboration across hospitals, clinics, payers, and public health systems. On-premise deployment remains important for large hospitals, research organizations, and institutions requiring direct control over sensitive patient data and legacy system integration. Hybrid deployment is gaining traction as healthcare providers combine secure local data management with cloud-based analytics, phased modernization, and compliance-driven flexibility.
Application Outlook
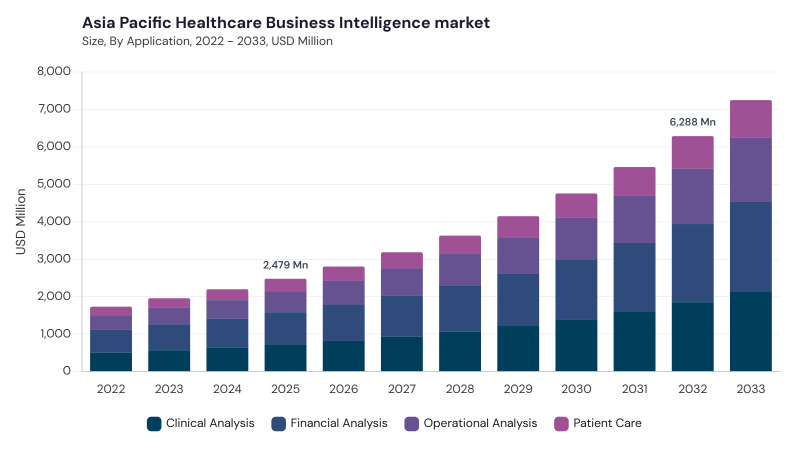
Based on Application, the market is segmented into Financial Analysis, Clinical Analysis, Operational Analysis, and Patient Care. The Financial Analysis market dominated the Asia Pacific Healthcare Business Intelligence Market by Application in 2025, and would continue to be a dominant market till 2033; thereby, achieving a market value of USD 1.6 billion by 2030, growing at a CAGR of 13.7 % during the forecast period. The Clinical Analysis market is expected to witness a CAGR of 14.7% during (2026 - 2033). Additionally, The Operational Analysis market is expected to witness highest CAGR of 15.1% during (2026 - 2033).
Financial Analysis leads as healthcare organizations focus on revenue management, budgeting, insurance claims, expenditure control, fraud detection, and financial transparency across varied funding models. BI tools help providers and payers monitor costs, improve reimbursement workflows, support audit readiness, and strengthen resource planning. Clinical Analysis remains significant through disease surveillance, diagnosis support, evidence-based treatment planning, predictive modeling, and clinical trial analytics. Operational Analysis supports workforce allocation, patient flow, inventory planning, and facility utilization, while Patient Care applications advance telehealth, remote monitoring, personalized medicine, engagement analytics, and population health management.
End Use Outlook
Based on End Use, the market is segmented into Payers, Healthcare Providers, and Healthcare Manufacturers. Payers lead due to expanding use of BI for claims administration, fraud detection, member risk assessment, healthcare cost management, reimbursement planning, and insurance analytics. These organizations use predictive tools to evaluate utilization patterns, identify high-risk groups, improve policy design, and support value-based care models.
Healthcare Providers remain significant as hospitals, clinics, diagnostic centers, and physician groups adopt BI for clinical efficiency, patient outcomes, operational visibility, and regulatory reporting. Healthcare Manufacturers use BI for pharmaceutical research, medical device development, regulatory planning, demand forecasting, production optimization, supply chain visibility, and market intelligence.
Free Valuable Insights: Healthcare Business Intelligence Market is Predicted to reach USD 30.7 Billion billion by 2033, at a CAGR of 13.8%
Country Outlook
Based on Country, the market is segmented into China, Japan, India, South Korea, Singapore, Malaysia, and Rest of Asia Pacific. The China market dominated the Asia Pacific Healthcare Business Intelligence Market by Country in 2025, and would continue to be a dominant market till 2033; thereby, achieving a market value of USD 1.3 billion by 2030, growing at a CAGR of 12.5 % during the forecast period. The Japan market is expected to witness a CAGR of 13.9% during (2026 - 2033). Additionally, The India market is expected to witness a CAGR of 15.3% during (2026 - 2033).
China leads due to healthcare modernization, AI-led analytics, strong digital health initiatives, cloud adoption, hospital informatization, and growing use of BI in public health and clinical decision-making. Japan supports market growth through advanced healthcare infrastructure, aging population needs, predictive analytics, patient-centric data management, and cloud-based BI adoption. India is advancing through digital health platforms, telemedicine expansion, AI-enabled analytics, localized data solutions, and growing demand from hospitals and MedTech firms. South Korea, Singapore, and Malaysia add momentum through strong digital infrastructure, regulatory governance, smart healthcare programs, and secure BI platforms, while Rest of Asia Pacific benefits from cloud adoption, regional partnerships, and localized healthcare intelligence solutions.
List of Key Companies Profiled
- Microsoft Corporation
- Oracle Corporation
- Salesforce, Inc.
- Health Catalyst, Inc.
- QlikTech International AB
- Innovaccer Inc.
- SAP SE
- SAS Institute Inc.
- Infor, Inc.
- Epic Systems Corporation
Asia Pacific Healthcare Business Intelligence Market Report Segmentation
By Component
- Software
- Services
By Mode of Delivery
- Cloud-based
- On-premise
- Hybrid
By Application
- Financial Analysis
- Clinical Analysis
- Operational Analysis
- Patient Care
By End Use
- Payers
- Healthcare Providers
- Healthcare Manufacturers
By Country
- China
- Japan
- India
- South Korea
- Singapore
- Malaysia
- Rest of Asia Pacific
1.1 Market Overview
1.2 Key Factors Impacting Market
1.2.1 Market Drivers
1.2.2 Market Restraints
1.2.3 Market Opportunities
1.2.4 Market Challenges
1.2.5 Market Trends
1.2.6 State of Competition
1.2.7 Market Consolidation
1.2.8 Key Customer Criteria
1.3 Product Life Cycle
1.4 Segmentation By Application
1.4.1 Telecom Backbone Networks
1.4.2 Data Center Interconnect
1.4.3 G and 6G Transport Networks
1.4.4 Quantum Networks
1.4.5 Other Application
1.5 Segmentation By End User Industry
1.5.1 Telecom Operators
1.5.2 Hyperscalers and Cloud Providers
1.5.3 Research and Defense Organizations
1.5.4 Enterprises and Financial Institutions
1.5.5 Other End User Industry
1.6 Segmentation By Fiber Type
1.6.1 Anti-Resonant
1.6.2 Nested Anti-Resonant
1.6.3 Photonic Bandgap
1.6.4 Other Fiber
1.7 Segmentation By Country
1.7.1 China
1.7.1.1 Segmentation By Application
1.7.1.1.1 Telecom Backbone Networks
1.7.1.1.2 Data Center Interconnect
1.7.1.1.3 G and 6G Transport Networks
1.7.1.1.4 Quantum Networks
1.7.1.1.5 Other Application
1.7.1.2 Segmentation By End User Industry
1.7.1.2.1 Telecom Operators
1.7.1.2.2 Hyperscalers and Cloud Providers
1.7.1.2.3 Research and Defense Organizations
1.7.1.2.4 Enterprises and Financial Institutions
1.7.1.2.5 Other End User Industry
1.7.1.3 Segmentation By Fiber Type
1.7.1.3.1 Anti-Resonant
1.7.1.3.2 Nested Anti-Resonant
1.7.1.3.3 Photonic Bandgap
1.7.1.3.4 Other Fiber Type
1.7.2 Japan
1.7.2.1 Segmentation By Application
1.7.2.1.1 Telecom Backbone Networks
1.7.2.1.2 Data Center Interconnect
1.7.2.1.3 G and 6G Transport Networks
1.7.2.1.4 Quantum Networks
1.7.2.1.5 Other Application
1.7.2.2 Segmentation By End User Industry
1.7.2.2.1 Telecom Operators
1.7.2.2.2 Hyperscalers and Cloud Providers
1.7.2.2.3 Research and Defense Organizations
1.7.2.2.4 Enterprises and Financial Institutions
1.7.2.2.5 Other End User Industry
1.7.2.3 Segmentation By Fiber Type
1.7.2.3.1 Anti-Resonant
1.7.2.3.2 Nested Anti-Resonant
1.7.2.3.3 Photonic Bandgap
1.7.2.3.4 Other Fiber Type
1.7.3 India
1.7.3.1 Segmentation By Application
1.7.3.1.1 Telecom Backbone Networks
1.7.3.1.2 Data Center Interconnect
1.7.3.1.3 G and 6G Transport Networks
1.7.3.1.4 Quantum Networks
1.7.3.1.5 Other Application
1.7.3.2 Segmentation By End User Industry
1.7.3.2.1 Telecom Operators
1.7.3.2.2 Hyperscalers and Cloud Providers
1.7.3.2.3 Research and Defense Organizations
1.7.3.2.4 Enterprises and Financial Institutions
1.7.3.2.5 Other End User Industry
1.7.3.3 Segmentation By Fiber Type
1.7.3.3.1 Anti-Resonant
1.7.3.3.2 Nested Anti-Resonant
1.7.3.3.3 Photonic Bandgap
1.7.3.3.4 Other Fiber Type
1.7.4 South Korea
1.7.4.1 Segmentation By Application
1.7.4.1.1 Telecom Backbone Networks
1.7.4.1.2 Data Center Interconnect
1.7.4.1.3 G and 6G Transport Networks
1.7.4.1.4 Quantum Networks
1.7.4.1.5 Other Application
1.7.4.2 Segmentation By End User Industry
1.7.4.2.1 Telecom Operators
1.7.4.2.2 Hyperscalers and Cloud Providers
1.7.4.2.3 Research and Defense Organizations
1.7.4.2.4 Enterprises and Financial Institutions
1.7.4.2.5 Other End User Industry
1.7.4.3 Segmentation By Fiber Type
1.7.4.3.1 Anti-Resonant
1.7.4.3.2 Nested Anti-Resonant
1.7.4.3.3 Photonic Bandgap
1.7.4.3.4 Other Fiber Type
1.7.5 Singapore
1.7.5.1 Segmentation By Application
1.7.5.1.1 Telecom Backbone Networks
1.7.5.1.2 Data Center Interconnect
1.7.5.1.3 G and 6G Transport Networks
1.7.5.1.4 Quantum Networks
1.7.5.1.5 Other Application
1.7.5.2 Segmentation By End User Industry
1.7.5.2.1 Telecom Operators
1.7.5.2.2 Hyperscalers and Cloud Providers
1.7.5.2.3 Research and Defense Organizations
1.7.5.2.4 Enterprises and Financial Institutions
1.7.5.2.5 Other End User Industry
1.7.5.3 Segmentation By Fiber Type
1.7.5.3.1 Anti-Resonant
1.7.5.3.2 Nested Anti-Resonant
1.7.5.3.3 Photonic Bandgap
1.7.5.3.4 Other Fiber Type
1.7.6 Malaysia
1.7.6.1 Segmentation By Application
1.7.6.1.1 Telecom Backbone Networks
1.7.6.1.2 Data Center Interconnect
1.7.6.1.3 G and 6G Transport Networks
1.7.6.1.4 Quantum Networks
1.7.6.1.5 Other Application
1.7.6.2 Segmentation By End User Industry
1.7.6.2.1 Telecom Operators
1.7.6.2.2 Hyperscalers and Cloud Providers
1.7.6.2.3 Research and Defense Organizations
1.7.6.2.4 Enterprises and Financial Institutions
1.7.6.2.5 Other End User Industry
1.7.6.3 Segmentation By Fiber Type
1.7.6.3.1 Anti-Resonant
1.7.6.3.2 Nested Anti-Resonant
1.7.6.3.3 Photonic Bandgap
1.7.6.3.4 Other Fiber Type
1.7.7 Rest of Asia Pacific
1.7.7.1 Segmentation By Application
1.7.7.1.1 Telecom Backbone Networks
1.7.7.1.2 Data Center Interconnect
1.7.7.1.3 G and 6G Transport Networks
1.7.7.1.4 Quantum Networks
1.7.7.1.5 Other Application
1.7.7.2 Segmentation By End User Industry
1.7.7.2.1 Telecom Operators
1.7.7.2.2 Hyperscalers and Cloud Providers
1.7.7.2.3 Research and Defense Organizations
1.7.7.2.4 Enterprises and Financial Institutions
1.7.7.2.5 Other End User Industry
1.7.7.3 Segmentation By Fiber Type
1.7.7.3.1 Anti-Resonant
1.7.7.3.2 Nested Anti-Resonant
1.7.7.3.3 Photonic Bandgap
1.7.7.3.4 Other Fiber Type
Chapter 2. Company Snapshots
2.1 Furukawa Electric Co., Ltd.
2.1.1 Business Overview
2.1.2 Key Information
2.1.3 Company Focus on Hollow-Core Fiber Backbone Network Market
2.1.4 Strategic Insights
2.1.5 Strategy Deployed
2.1.6 Product & Service Portfolio
2.1.7 Capability Overview
2.1.8 Technology & Innovation Focus
2.1.9 SWOT Analysis
2.1.10 Customers / End Users
2.1.11 Competitive Positioning
2.1.12 Key Differentiators
2.1.13 Portfolio Matrix
2.1.14 Analyst View
2.1.15 Future Outlook
2.2 Microsoft Corporation
2.2.1 Business Overview
2.2.2 Key Information
2.2.3 Company Focus on Hollow-Core Fiber Backbone Network Market
2.2.4 Strategic Insights
2.2.5 Strategy Deployed
2.2.6 Product & Service Portfolio
2.2.7 Capability Overview
2.2.8 Technology & Innovation Focus
2.2.9 SWOT Analysis
2.2.10 Customers / End Users
2.2.11 Competitive Positioning
2.2.12 Key Differentiators
2.2.13 Portfolio Matrix
2.2.14 Analyst View
2.2.15 Future Outlook
2.3 NKT Photonics A/S
2.3.1 Business Overview
2.3.2 Key Information
2.3.3 Company Focus on Hollow-Core Fiber Backbone Network Market
2.3.4 Strategic Insights
2.3.5 Strategy Deployed
2.3.6 Product & Service Portfolio
2.3.7 Capability Overview
2.3.8 Technology & Innovation Focus
2.3.9 SWOT Analysis
2.3.10 Customers / End Users
2.3.11 Competitive Positioning
2.3.12 Key Differentiators
2.3.13 Portfolio Matrix
2.3.14 Analyst View
2.3.15 Future Outlook
2.4 Relativity Networks, Inc.
2.4.1 Business Overview
2.4.2 Key Information
2.4.3 Company Focus on Hollow-Core Fiber Backbone Network Market
2.4.4 Strategic Insights
2.4.5 Strategy Deployed
2.4.6 Product & Service Portfolio
2.4.7 Capability Overview
2.4.8 Technology & Innovation Focus
2.4.9 SWOT Analysis
2.4.10 Customers / End Users
2.4.11 Competitive Positioning
2.4.12 Key Differentiators
2.4.13 Portfolio Matrix
2.4.14 Analyst View
2.4.15 Future Outlook
2.5 Linfiber Technology (Nantong) Co., Ltd.
2.5.1 Business Overview
2.5.2 Key Information
2.5.3 Company Focus on Hollow-Core Fiber Backbone Network Market
2.5.4 Strategic Insights
2.5.5 Strategy Deployed
2.5.6 Product & Service Portfolio
2.5.7 Capability Overview
2.5.8 Technology & Innovation Focus
2.5.9 SWOT Analysis
2.5.10 Customers / End Users
2.5.11 Competitive Positioning
2.5.12 Key Differentiators
2.5.13 Portfolio Matrix
2.5.14 Analyst View
2.5.15 Future Outlook
2.6 GLOphotonics SAS
2.6.1 Business Overview
2.6.2 Key Information
2.6.3 Company Focus on Hollow-Core Fiber Backbone Network Market
2.6.4 Strategic Insights
2.6.5 Strategy Deployed
2.6.6 Product & Service Portfolio 2.6.7 Capability Overview
2.6.8 Technology & Innovation Focus
2.6.9 SWOT Analysis
2.6.10 Customers / End Users
2.6.11 Competitive Positioning
2.6.12 Key Differentiators
2.6.13 Portfolio Matrix
2.6.14 Analyst View
2.6.15 Future Outlook
2.7 Yangtze Optical Fibre and Cable Joint Stock Limited Company
2.7.1 Business Overview
2.7.2 Key Information
2.7.3 Company Focus on Hollow-Core Fiber Backbone Network Market
2.7.4 Strategic Insights
2.7.5 Strategy Deployed
2.7.6 Product & Service Portfolio
2.7.7 Capability Overview
2.7.8 Technology & Innovation Focus
2.7.9 SWOT Analysis
2.7.10 Customers / End Users
2.7.11 Competitive Positioning
2.7.12 Key Differentiators
2.7.13 Portfolio Matrix
2.7.14 Analyst View
2.7.15 Future Outlook
2.8 Corning Incorporated
2.8.1 Business Overview
2.8.2 Key Information
2.8.3 Company Focus on Hollow-Core Fiber Backbone Network Market
2.8.4 Strategic Insights
2.8.5 Strategy Deployed
2.8.6 Product & Service Portfolio
2.8.7 Capability Overview
2.8.8 Technology & Innovation Focus
2.8.9 SWOT Analysis
2.8.10 Customers / End Users
2.8.11 Competitive Positioning
2.8.12 Key Differentiators
2.8.13 Portfolio Matrix
2.8.14 Analyst View
2.8.15 Future Outlook
2.9 Fujikura Ltd.
2.9.1 Business Overview
2.9.2 Key Information
2.9.3 Company Focus on Hollow-Core Fiber Backbone Network Market
2.9.4 Strategic Insights
2.9.5 Strategy Deployed
2.9.6 Product & Service Portfolio
2.9.7 Capability Overview
2.9.8 Technology & Innovation Focus
2.9.9 SWOT Analysis
2.9.10 Customers / End Users
2.9.11 Competitive Positioning
2.9.12 Key Differentiators
2.9.13 Portfolio Matrix
2.9.14 Analyst View
2.9.15 Future Outlook
2.10 Heraeus Holding GmbH
2.10.1 Business Overview
2.10.2 Key Information
2.10.3 Company Focus on Hollow-Core Fiber Backbone Network Market
2.10.4 Strategic Insights
2.10.5 Strategy Deployed
2.10.6 Product & Service Portfolio
2.10.7 Capability Overview
2.10.8 Technology & Innovation Focus
2.10.9 SWOT Analysis
2.10.10 Customers / End Users
2.10.11 Competitive Positioning
2.10.12 Key Differentiators
2.10.13 Portfolio Matrix
2.10.14 Analyst View
2.10.15 Future Outlook
Table 1 Asia Pacific Hollow-Core Fiber Backbone Network Market Market, 2022 - 2033, USD Million
Table 2 Asia Pacific Hollow-Core Fiber Backbone Network Market Market by Application, 2022 - 2033, USD Million
Table 3 Asia Pacific 5G and 6G Transport Networks Market, 2022 - 2033, USD Million
Table 4 Asia Pacific Data Center Interconnect Market, 2022 - 2033, USD Million
Table 5 Asia Pacific Other Application Market, 2022 - 2033, USD Million
Table 6 Asia Pacific Quantum Networks Market, 2022 - 2033, USD Million
Table 7 Asia Pacific Telecom Backbone Networks Market, 2022 - 2033, USD Million
Table 8 Asia Pacific Hollow-Core Fiber Backbone Network Market Market by End User Industry, 2022 - 2033, USD Million
Table 9 Asia Pacific Enterprises and Financial Institutions Market, 2022 - 2033, USD Million
Table 10 Asia Pacific Hyperscalers and Cloud Providers Market, 2022 - 2033, USD Million
Table 11 Asia Pacific Other End User Industry Market, 2022 - 2033, USD Million
Table 12 Asia Pacific Research and Defense Organizations Market, 2022 - 2033, USD Million
Table 13 Asia Pacific Telecom Operators Market, 2022 - 2033, USD Million
Table 14 Asia Pacific Hollow-Core Fiber Backbone Network Market Market by Fiber Type, 2022 - 2033, USD Million
Table 15 Asia Pacific Anti-Resonant Market, 2022 - 2033, USD Million
Table 16 Asia Pacific Nested Anti-Resonant Market, 2022 - 2033, USD Million
Table 17 Asia Pacific Other Fiber Type Market, 2022 - 2033, USD Million
Table 18 Asia Pacific Photonic Bandgap Market, 2022 - 2033, USD Million
Table 19 China Hollow-Core Fiber Backbone Network Market Market, 2022 - 2033, USD Million
Table 20 China Hollow-Core Fiber Backbone Network Market Market by Application, 2022 - 2033, USD Million
Table 21 China 5G and 6G Transport Networks Market, 2022 - 2033, USD Million
Table 22 China Data Center Interconnect Market, 2022 - 2033, USD Million
Table 23 China Other Application Market, 2022 - 2033, USD Million
Table 24 China Quantum Networks Market, 2022 - 2033, USD Million
Table 25 China Telecom Backbone Networks Market, 2022 - 2033, USD Million
Table 26 China Hollow-Core Fiber Backbone Network Market Market by End User Industry, 2022 - 2033, USD Million
Table 27 China Enterprises and Financial Institutions Market, 2022 - 2033, USD Million
Table 28 China Hyperscalers and Cloud Providers Market, 2022 - 2033, USD Million
Table 29 China Other End User Industry Market, 2022 - 2033, USD Million
Table 30 China Research and Defense Organizations Market, 2022 - 2033, USD Million
Table 31 China Telecom Operators Market, 2022 - 2033, USD Million
Table 32 China Hollow-Core Fiber Backbone Network Market Market by Fiber Type, 2022 - 2033, USD Million
Table 33 China Anti-Resonant Market, 2022 - 2033, USD Million
Table 34 China Nested Anti-Resonant Market, 2022 - 2033, USD Million
Table 35 China Other Fiber Type Market, 2022 - 2033, USD Million
Table 36 China Photonic Bandgap Market, 2022 - 2033, USD Million
Table 37 Japan Hollow-Core Fiber Backbone Network Market Market, 2022 - 2033, USD Million
Table 38 Japan Hollow-Core Fiber Backbone Network Market Market by Application, 2022 - 2033, USD Million
Table 39 Japan 5G and 6G Transport Networks Market, 2022 - 2033, USD Million
Table 40 Japan Data Center Interconnect Market, 2022 - 2033, USD Million
Table 41 Japan Other Application Market, 2022 - 2033, USD Million
Table 42 Japan Quantum Networks Market, 2022 - 2033, USD Million
Table 43 Japan Telecom Backbone Networks Market, 2022 - 2033, USD Million
Table 44 Japan Hollow-Core Fiber Backbone Network Market Market by End User Industry, 2022 - 2033, USD Million
Table 45 Japan Enterprises and Financial Institutions Market, 2022 - 2033, USD Million
Table 46 Japan Hyperscalers and Cloud Providers Market, 2022 - 2033, USD Million
Table 47 Japan Other End User Industry Market, 2022 - 2033, USD Million
Table 48 Japan Research and Defense Organizations Market, 2022 - 2033, USD Million
Table 49 Japan Telecom Operators Market, 2022 - 2033, USD Million
Table 50 Japan Hollow-Core Fiber Backbone Network Market Market by Fiber Type, 2022 - 2033, USD Million
Table 51 Japan Anti-Resonant Market, 2022 - 2033, USD Million
Table 52 Japan Nested Anti-Resonant Market, 2022 - 2033, USD Million
Table 53 Japan Other Fiber Type Market, 2022 - 2033, USD Million
Table 54 Japan Photonic Bandgap Market, 2022 - 2033, USD Million
Table 55 India Hollow-Core Fiber Backbone Network Market Market, 2022 - 2033, USD Million
Table 56 India Hollow-Core Fiber Backbone Network Market Market by Application, 2022 - 2033, USD Million
Table 57 India 5G and 6G Transport Networks Market, 2022 - 2033, USD Million
Table 58 India Data Center Interconnect Market, 2022 - 2033, USD Million
Table 59 India Other Application Market, 2022 - 2033, USD Million
Table 60 India Quantum Networks Market, 2022 - 2033, USD Million
Table 61 India Telecom Backbone Networks Market, 2022 - 2033, USD Million
Table 62 India Hollow-Core Fiber Backbone Network Market Market by End User Industry, 2022 - 2033, USD Million
Table 63 India Enterprises and Financial Institutions Market, 2022 - 2033, USD Million
Table 64 India Hyperscalers and Cloud Providers Market, 2022 - 2033, USD Million
Table 65 India Other End User Industry Market, 2022 - 2033, USD Million
Table 66 India Research and Defense Organizations Market, 2022 - 2033, USD Million
Table 67 India Telecom Operators Market, 2022 - 2033, USD Million
Table 68 India Hollow-Core Fiber Backbone Network Market Market by Fiber Type, 2022 - 2033, USD Million
Table 69 India Anti-Resonant Market, 2022 - 2033, USD Million
Table 70 India Nested Anti-Resonant Market, 2022 - 2033, USD Million
Table 71 India Other Fiber Type Market, 2022 - 2033, USD Million
Table 72 India Photonic Bandgap Market, 2022 - 2033, USD Million
Table 73 South Korea Hollow-Core Fiber Backbone Network Market Market, 2022 - 2033, USD Million
Table 74 South Korea Hollow-Core Fiber Backbone Network Market Market by Application, 2022 - 2033, USD Million
Table 75 South Korea 5G and 6G Transport Networks Market, 2022 - 2033, USD Million
Table 76 South Korea Data Center Interconnect Market, 2022 - 2033, USD Million
Table 77 South Korea Other Application Market, 2022 - 2033, USD Million
Table 78 South Korea Quantum Networks Market, 2022 - 2033, USD Million
Table 79 South Korea Telecom Backbone Networks Market, 2022 - 2033, USD Million
Table 80 South Korea Hollow-Core Fiber Backbone Network Market Market by End User Industry, 2022 - 2033, USD Million
Table 81 South Korea Enterprises and Financial Institutions Market, 2022 - 2033, USD Million
Table 82 South Korea Hyperscalers and Cloud Providers Market, 2022 - 2033, USD Million
Table 83 South Korea Other End User Industry Market, 2022 - 2033, USD Million
Table 84 South Korea Research and Defense Organizations Market, 2022 - 2033, USD Million
Table 85 South Korea Telecom Operators Market, 2022 - 2033, USD Million
Table 86 South Korea Hollow-Core Fiber Backbone Network Market Market by Fiber Type, 2022 - 2033, USD Million
Table 87 South Korea Anti-Resonant Market, 2022 - 2033, USD Million
Table 88 South Korea Nested Anti-Resonant Market, 2022 - 2033, USD Million
Table 89 South Korea Other Fiber Type Market, 2022 - 2033, USD Million
Table 90 South Korea Photonic Bandgap Market, 2022 - 2033, USD Million
Table 91 Singapore Hollow-Core Fiber Backbone Network Market Market, 2022 - 2033, USD Million
Table 92 Singapore Hollow-Core Fiber Backbone Network Market Market by Application, 2022 - 2033, USD Million
Table 93 Singapore 5G and 6G Transport Networks Market, 2022 - 2033, USD Million
Table 94 Singapore Data Center Interconnect Market, 2022 - 2033, USD Million
Table 95 Singapore Other Application Market, 2022 - 2033, USD Million
Table 96 Singapore Quantum Networks Market, 2022 - 2033, USD Million
Table 97 Singapore Telecom Backbone Networks Market, 2022 - 2033, USD Million
Table 98 Singapore Hollow-Core Fiber Backbone Network Market Market by End User Industry, 2022 - 2033, USD Million
Table 99 Singapore Enterprises and Financial Institutions Market, 2022 - 2033, USD Million
Table 100 Singapore Hyperscalers and Cloud Providers Market, 2022 - 2033, USD Million
Table 101 Singapore Other End User Industry Market, 2022 - 2033, USD Million
Table 102 Singapore Research and Defense Organizations Market, 2022 - 2033, USD Million
Table 103 Singapore Telecom Operators Market, 2022 - 2033, USD Million
Table 104 Singapore Hollow-Core Fiber Backbone Network Market Market by Fiber Type, 2022 - 2033, USD Million
Table 105 Singapore Anti-Resonant Market, 2022 - 2033, USD Million
Table 106 Singapore Nested Anti-Resonant Market, 2022 - 2033, USD Million
Table 107 Singapore Other Fiber Type Market, 2022 - 2033, USD Million
Table 108 Singapore Photonic Bandgap Market, 2022 - 2033, USD Million
Table 109 Malaysia Hollow-Core Fiber Backbone Network Market Market, 2022 - 2033, USD Million
Table 110 Malaysia Hollow-Core Fiber Backbone Network Market Market by Application, 2022 - 2033, USD Million
Table 111 Malaysia 5G and 6G Transport Networks Market, 2022 - 2033, USD Million
Table 112 Malaysia Data Center Interconnect Market, 2022 - 2033, USD Million
Table 113 Malaysia Other Application Market, 2022 - 2033, USD Million
Table 114 Malaysia Quantum Networks Market, 2022 - 2033, USD Million
Table 115 Malaysia Telecom Backbone Networks Market, 2022 - 2033, USD Million
Table 116 Malaysia Hollow-Core Fiber Backbone Network Market Market by End User Industry, 2022 - 2033, USD Million
Table 117 Malaysia Enterprises and Financial Institutions Market, 2022 - 2033, USD Million
Table 118 Malaysia Hyperscalers and Cloud Providers Market, 2022 - 2033, USD Million
Table 119 Malaysia Other End User Industry Market, 2022 - 2033, USD Million
Table 120 Malaysia Research and Defense Organizations Market, 2022 - 2033, USD Million
Table 121 Malaysia Telecom Operators Market, 2022 - 2033, USD Million
Table 122 Malaysia Hollow-Core Fiber Backbone Network Market Market by Fiber Type, 2022 - 2033, USD Million
Table 123 Malaysia Anti-Resonant Market, 2022 - 2033, USD Million
Table 124 Malaysia Nested Anti-Resonant Market, 2022 - 2033, USD Million
Table 125 Malaysia Other Fiber Type Market, 2022 - 2033, USD Million
Table 126 Malaysia Photonic Bandgap Market, 2022 - 2033, USD Million
Table 127 Rest of Asia Pacific Hollow-Core Fiber Backbone Network Market Market, 2022 - 2033, USD Million
Table 128 Rest of Asia Pacific Hollow-Core Fiber Backbone Network Market Market by Application, 2022 - 2033, USD Million
Table 129 Rest of Asia Pacific 5G and 6G Transport Networks Market, 2022 - 2033, USD Million
Table 130 Rest of Asia Pacific Data Center Interconnect Market, 2022 - 2033, USD Million
Table 131 Rest of Asia Pacific Other Application Market, 2022 - 2033, USD Million
Table 132 Rest of Asia Pacific Quantum Networks Market, 2022 - 2033, USD Million
Table 133 Rest of Asia Pacific Telecom Backbone Networks Market, 2022 - 2033, USD Million
Table 134 Rest of Asia Pacific Hollow-Core Fiber Backbone Network Market Market by End User Industry, 2022 - 2033, USD Million
Table 135 Rest of Asia Pacific Enterprises and Financial Institutions Market, 2022 - 2033, USD Million
Table 136 Rest of Asia Pacific Hyperscalers and Cloud Providers Market, 2022 - 2033, USD Million
Table 137 Rest of Asia Pacific Other End User Industry Market, 2022 - 2033, USD Million
Table 138 Rest of Asia Pacific Research and Defense Organizations Market, 2022 - 2033, USD Million
Table 139 Rest of Asia Pacific Telecom Operators Market, 2022 - 2033, USD Million
Table 140 Rest of Asia Pacific Hollow-Core Fiber Backbone Network Market Market by Fiber Type, 2022 - 2033, USD Million
Table 141 Rest of Asia Pacific Anti-Resonant Market, 2022 - 2033, USD Million
Table 142 Rest of Asia Pacific Nested Anti-Resonant Market, 2022 - 2033, USD Million
Table 143 Rest of Asia Pacific Other Fiber Type Market, 2022 - 2033, USD Million
Table 144 Rest of Asia Pacific Photonic Bandgap Market, 2022 - 2033, USD Million
List of Figures
FIG 1 Key Factors Impacting Market
FIG 2 Market Consolidation
FIG 3 Key Customer Criteria
FIG 4 Product Life Cycle
FIG 5 Asia Pacific Hollow-Core Fiber Backbone Network Market Market, 2022 - 2033, USD Million
FIG 6 Asia Pacific Hollow-Core Fiber Backbone Network Market Market by Application, 2022 - 2033, USD Million
FIG 7 Asia Pacific 5G and 6G Transport Networks Market, 2022 - 2033, USD Million
FIG 8 Asia Pacific Data Center Interconnect Market, 2022 - 2033, USD Million
FIG 9 Asia Pacific Other Application Market, 2022 - 2033, USD Million
FIG 10 Asia Pacific Quantum Networks Market, 2022 - 2033, USD Million
FIG 11 Asia Pacific Telecom Backbone Networks Market, 2022 - 2033, USD Million
FIG 12 Asia Pacific Hollow-Core Fiber Backbone Network Market Market by End User Industry, 2022 - 2033, USD Million
FIG 13 Asia Pacific Enterprises and Financial Institutions Market, 2022 - 2033, USD Million
FIG 14 Asia Pacific Hyperscalers and Cloud Providers Market, 2022 - 2033, USD Million
FIG 15 Asia Pacific Other End User Industry Market, 2022 - 2033, USD Million
FIG 16 Asia Pacific Research and Defense Organizations Market, 2022 - 2033, USD Million
FIG 17 Asia Pacific Telecom Operators Market, 2022 - 2033, USD Million
FIG 18 Asia Pacific Hollow-Core Fiber Backbone Network Market Market by Fiber Type, 2022 - 2033, USD Million
FIG 19 Asia Pacific Anti-Resonant Market, 2022 - 2033, USD Million
FIG 20 Asia Pacific Nested Anti-Resonant Market, 2022 - 2033, USD Million
FIG 21 Asia Pacific Other Fiber Type Market, 2022 - 2033, USD Million
FIG 22 Asia Pacific Photonic Bandgap Market, 2022 - 2033, USD Million
FIG 23 China Hollow-Core Fiber Backbone Network Market Market, 2022 - 2033, USD Million
FIG 24 China Hollow-Core Fiber Backbone Network Market Market by Application, 2022 - 2033, USD Million
FIG 25 China 5G and 6G Transport Networks Market, 2022 - 2033, USD Million
FIG 26 China Data Center Interconnect Market, 2022 - 2033, USD Million
FIG 27 China Other Application Market, 2022 - 2033, USD Million
FIG 28 China Quantum Networks Market, 2022 - 2033, USD Million
FIG 29 China Telecom Backbone Networks Market, 2022 - 2033, USD Million
FIG 30 China Hollow-Core Fiber Backbone Network Market Market by End User Industry, 2022 - 2033, USD Million
FIG 31 China Enterprises and Financial Institutions Market, 2022 - 2033, USD Million
FIG 32 China Hyperscalers and Cloud Providers Market, 2022 - 2033, USD Million
FIG 33 China Other End User Industry Market, 2022 - 2033, USD Million
FIG 34 China Research and Defense Organizations Market, 2022 - 2033, USD Million
FIG 35 China Telecom Operators Market, 2022 - 2033, USD Million
FIG 36 China Hollow-Core Fiber Backbone Network Market Market by Fiber Type, 2022 - 2033, USD Million
FIG 37 China Anti-Resonant Market, 2022 - 2033, USD Million
FIG 38 China Nested Anti-Resonant Market, 2022 - 2033, USD Million
FIG 39 China Other Fiber Type Market, 2022 - 2033, USD Million
FIG 40 China Photonic Bandgap Market, 2022 - 2033, USD Million
FIG 41 Japan Hollow-Core Fiber Backbone Network Market Market, 2022 - 2033, USD Million
FIG 42 Japan Hollow-Core Fiber Backbone Network Market Market by Application, 2022 - 2033, USD Million
FIG 43 Japan 5G and 6G Transport Networks Market, 2022 - 2033, USD Million
FIG 44 Japan Data Center Interconnect Market, 2022 - 2033, USD Million
FIG 45 Japan Other Application Market, 2022 - 2033, USD Million
FIG 46 Japan Quantum Networks Market, 2022 - 2033, USD Million
FIG 47 Japan Telecom Backbone Networks Market, 2022 - 2033, USD Million
FIG 48 Japan Hollow-Core Fiber Backbone Network Market Market by End User Industry, 2022 - 2033, USD Million
FIG 49 Japan Enterprises and Financial Institutions Market, 2022 - 2033, USD Million
FIG 50 Japan Hyperscalers and Cloud Providers Market, 2022 - 2033, USD Million
FIG 51 Japan Other End User Industry Market, 2022 - 2033, USD Million
FIG 52 Japan Research and Defense Organizations Market, 2022 - 2033, USD Million
FIG 53 Japan Telecom Operators Market, 2022 - 2033, USD Million
FIG 54 Japan Hollow-Core Fiber Backbone Network Market Market by Fiber Type, 2022 - 2033, USD Million
FIG 55 Japan Anti-Resonant Market, 2022 - 2033, USD Million
FIG 56 Japan Nested Anti-Resonant Market, 2022 - 2033, USD Million
FIG 57 Japan Other Fiber Type Market, 2022 - 2033, USD Million
FIG 58 Japan Photonic Bandgap Market, 2022 - 2033, USD Million
FIG 59 India Hollow-Core Fiber Backbone Network Market Market, 2022 - 2033, USD Million
FIG 60 India Hollow-Core Fiber Backbone Network Market Market by Application, 2022 - 2033, USD Million
FIG 61 India 5G and 6G Transport Networks Market, 2022 - 2033, USD Million
FIG 62 India Data Center Interconnect Market, 2022 - 2033, USD Million
FIG 63 India Other Application Market, 2022 - 2033, USD Million
FIG 64 India Quantum Networks Market, 2022 - 2033, USD Million
FIG 65 India Telecom Backbone Networks Market, 2022 - 2033, USD Million
FIG 66 India Hollow-Core Fiber Backbone Network Market Market by End User Industry, 2022 - 2033, USD Million
FIG 67 India Enterprises and Financial Institutions Market, 2022 - 2033, USD Million
FIG 68 India Hyperscalers and Cloud Providers Market, 2022 - 2033, USD Million
FIG 69 India Other End User Industry Market, 2022 - 2033, USD Million
FIG 70 India Research and Defense Organizations Market, 2022 - 2033, USD Million
FIG 71 India Telecom Operators Market, 2022 - 2033, USD Million
FIG 72 India Hollow-Core Fiber Backbone Network Market Market by Fiber Type, 2022 - 2033, USD Million
FIG 73 India Anti-Resonant Market, 2022 - 2033, USD Million
FIG 74 India Nested Anti-Resonant Market, 2022 - 2033, USD Million
FIG 75 India Other Fiber Type Market, 2022 - 2033, USD Million
FIG 76 India Photonic Bandgap Market, 2022 - 2033, USD Million
FIG 77 South Korea Hollow-Core Fiber Backbone Network Market Market, 2022 - 2033, USD Million
FIG 78 South Korea Hollow-Core Fiber Backbone Network Market Market by Application, 2022 - 2033, USD Million
FIG 79 South Korea 5G and 6G Transport Networks Market, 2022 - 2033, USD Million
FIG 80 South Korea Data Center Interconnect Market, 2022 - 2033, USD Million
FIG 81 South Korea Other Application Market, 2022 - 2033, USD Million
FIG 82 South Korea Quantum Networks Market, 2022 - 2033, USD Million
FIG 83 South Korea Telecom Backbone Networks Market, 2022 - 2033, USD Million
FIG 84 South Korea Hollow-Core Fiber Backbone Network Market Market by End User Industry, 2022 - 2033, USD Million
FIG 85 South Korea Enterprises and Financial Institutions Market, 2022 - 2033, USD Million
FIG 86 South Korea Hyperscalers and Cloud Providers Market, 2022 - 2033, USD Million
FIG 87 South Korea Other End User Industry Market, 2022 - 2033, USD Million
FIG 88 South Korea Research and Defense Organizations Market, 2022 - 2033, USD Million
FIG 89 South Korea Telecom Operators Market, 2022 - 2033, USD Million
FIG 90 South Korea Hollow-Core Fiber Backbone Network Market Market by Fiber Type, 2022 - 2033, USD Million
FIG 91 South Korea Anti-Resonant Market, 2022 - 2033, USD Million
FIG 92 South Korea Nested Anti-Resonant Market, 2022 - 2033, USD Million
FIG 93 South Korea Other Fiber Type Market, 2022 - 2033, USD Million
FIG 94 South Korea Photonic Bandgap Market, 2022 - 2033, USD Million
FIG 95 Singapore Hollow-Core Fiber Backbone Network Market Market, 2022 - 2033, USD Million
FIG 96 Singapore Hollow-Core Fiber Backbone Network Market Market by Application, 2022 - 2033, USD Million
FIG 97 Singapore 5G and 6G Transport Networks Market, 2022 - 2033, USD Million
FIG 98 Singapore Data Center Interconnect Market, 2022 - 2033, USD Million FIG 99 Singapore Other Application Market, 2022 - 2033, USD Million
FIG 100 Singapore Quantum Networks Market, 2022 - 2033, USD Million
FIG 101 Singapore Telecom Backbone Networks Market, 2022 - 2033, USD Million
FIG 102 Singapore Hollow-Core Fiber Backbone Network Market Market by End User Industry, 2022 - 2033, USD Million
FIG 103 Singapore Enterprises and Financial Institutions Market, 2022 - 2033, USD Million
FIG 104 Singapore Hyperscalers and Cloud Providers Market, 2022 - 2033, USD Million
FIG 105 Singapore Other End User Industry Market, 2022 - 2033, USD Million
FIG 106 Singapore Research and Defense Organizations Market, 2022 - 2033, USD Million
FIG 107 Singapore Telecom Operators Market, 2022 - 2033, USD Million
FIG 108 Singapore Hollow-Core Fiber Backbone Network Market Market by Fiber Type, 2022 - 2033, USD Million
FIG 109 Singapore Anti-Resonant Market, 2022 - 2033, USD Million
FIG 110 Singapore Nested Anti-Resonant Market, 2022 - 2033, USD Million
FIG 111 Singapore Other Fiber Type Market, 2022 - 2033, USD Million
FIG 112 Singapore Photonic Bandgap Market, 2022 - 2033, USD Million
FIG 113 Malaysia Hollow-Core Fiber Backbone Network Market Market, 2022 - 2033, USD Million
FIG 114 Malaysia Hollow-Core Fiber Backbone Network Market Market by Application, 2022 - 2033, USD Million
FIG 115 Malaysia 5G and 6G Transport Networks Market, 2022 - 2033, USD Million
FIG 116 Malaysia Data Center Interconnect Market, 2022 - 2033, USD Million
FIG 117 Malaysia Other Application Market, 2022 - 2033, USD Million
FIG 118 Malaysia Quantum Networks Market, 2022 - 2033, USD Million
FIG 119 Malaysia Telecom Backbone Networks Market, 2022 - 2033, USD Million
FIG 120 Malaysia Hollow-Core Fiber Backbone Network Market Market by End User Industry, 2022 - 2033, USD Million
FIG 121 Malaysia Enterprises and Financial Institutions Market, 2022 - 2033, USD Million
FIG 122 Malaysia Hyperscalers and Cloud Providers Market, 2022 - 2033, USD Million
FIG 123 Malaysia Other End User Industry Market, 2022 - 2033, USD Million
FIG 124 Malaysia Research and Defense Organizations Market, 2022 - 2033, USD Million
FIG 125 Malaysia Telecom Operators Market, 2022 - 2033, USD Million
FIG 126 Malaysia Hollow-Core Fiber Backbone Network Market Market by Fiber Type, 2022 - 2033, USD Million
FIG 127 Malaysia Anti-Resonant Market, 2022 - 2033, USD Million
FIG 128 Malaysia Nested Anti-Resonant Market, 2022 - 2033, USD Million
FIG 129 Malaysia Other Fiber Type Market, 2022 - 2033, USD Million
FIG 130 Malaysia Photonic Bandgap Market, 2022 - 2033, USD Million
FIG 131 Rest of Asia Pacific Hollow-Core Fiber Backbone Network Market Market, 2022 - 2033, USD Million
FIG 132 Rest of Asia Pacific Hollow-Core Fiber Backbone Network Market Market by Application, 2022 - 2033, USD Million
FIG 133 Rest of Asia Pacific 5G and 6G Transport Networks Market, 2022 - 2033, USD Million
FIG 134 Rest of Asia Pacific Data Center Interconnect Market, 2022 - 2033, USD Million
FIG 135 Rest of Asia Pacific Other Application Market, 2022 - 2033, USD Million
FIG 136 Rest of Asia Pacific Quantum Networks Market, 2022 - 2033, USD Million
FIG 137 Rest of Asia Pacific Telecom Backbone Networks Market, 2022 - 2033, USD Million
FIG 138 Rest of Asia Pacific Hollow-Core Fiber Backbone Network Market Market by End User Industry, 2022 - 2033, USD Million
FIG 139 Rest of Asia Pacific Enterprises and Financial Institutions Market, 2022 - 2033, USD Million
FIG 140 Rest of Asia Pacific Hyperscalers and Cloud Providers Market, 2022 - 2033, USD Million
FIG 141 Rest of Asia Pacific Other End User Industry Market, 2022 - 2033, USD Million
FIG 142 Rest of Asia Pacific Research and Defense Organizations Market, 2022 - 2033, USD Million
FIG 143 Rest of Asia Pacific Telecom Operators Market, 2022 - 2033, USD Million
FIG 144 Rest of Asia Pacific Hollow-Core Fiber Backbone Network Market Market by Fiber Type, 2022 - 2033, USD Million
FIG 145 Rest of Asia Pacific Anti-Resonant Market, 2022 - 2033, USD Million
FIG 146 Rest of Asia Pacific Nested Anti-Resonant Market, 2022 - 2033, USD Million
FIG 147 Rest of Asia Pacific Other Fiber Type Market, 2022 - 2033, USD Million
FIG 148 Rest of Asia Pacific Photonic Bandgap Market, 2022 - 2033, USD Million