Asia Pacific Embodied AI Market Size, Share & Industry Analysis Report By Component (Hardware, and Software), By Product (Robots, and Autonomous Systems), By End Use (Automation & Manufacturing, and Logistics & Supply Chain), By Country Outlook and Forecast, 2026 - 2033
Published Date : 02-Sep-2026 |
Pages: 309 |
Report Format: PDF + Excel |
COVID-19 Impact on the Asia Pacific Embodied AI Market
The Asia Pacific Embodied AI Market is expected to reach USD 7.9 billion by 2030, growing at a CAGR of 38.6% during (2026 – 2033).
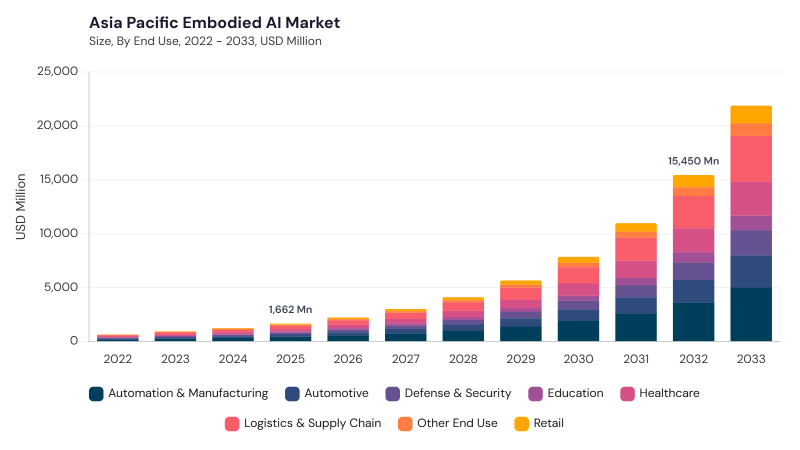
The Asia Pacific Embodied AI Market took shape through the meeting point of robotics, artificial intelligence, sensors, and intelligent control systems. Earlier activity was largely concentrated in laboratories, industrial automation pilots, and robotics-focused research programs where machines were trained to perform structured physical tasks. As AI chips, machine vision, sensor fusion, edge computing, and autonomous decision-making improved, embodied AI began moving into real operating environments. The region’s strong electronics manufacturing base, robotics ecosystem, and government-backed AI programs helped accelerate this transition.
Asia Pacific is progressing through localized embodied AI development, agentic robotics, 5G-enabled physical intelligence, and deployment-ready automation platforms. Countries such as China, Japan, South Korea, Singapore, and India are investing in AI infrastructure, robotics centers, smart manufacturing, and edge-based computing to support real-time embodied intelligence. Market participants are building robots and autonomous systems that can handle labor shortages, improve industrial productivity, support healthcare delivery, and enable intelligent logistics. The region is also seeing stronger attention toward responsible AI governance, safety rules, interoperability, and locally adapted robotic behavior.
Component Outlook
Based on Component, the market is segmented into Hardware, Software, and Services. The Hardware market dominated the Asia Pacific Embodied AI Market by Component in 2025, and would continue to be a dominant market till 2033; thereby, achieving a market value of USD 4.0 billion by 2030, growing at a CAGR of 38.1 % during the forecast period. The Software market is expected to witness a CAGR of 38.8% during (2026 - 2033).
Hardware remains the strongest component because embodied AI requires physical systems such as robotic bodies, cameras, LiDAR, tactile sensors, actuators, processors, embedded devices, batteries, and AI-optimized chips. Asia Pacific’s electronics production strength and robotics manufacturing capacity give this segment a strong base across industrial and service applications. Software is growing as perception models, navigation algorithms, simulation tools, reinforcement learning, computer vision, and human-robot interaction platforms improve autonomy. Services are becoming more important as enterprises require integration, customization, training, maintenance, compliance support, and lifecycle management to make embodied AI function effectively in real-world settings.
Product Outlook
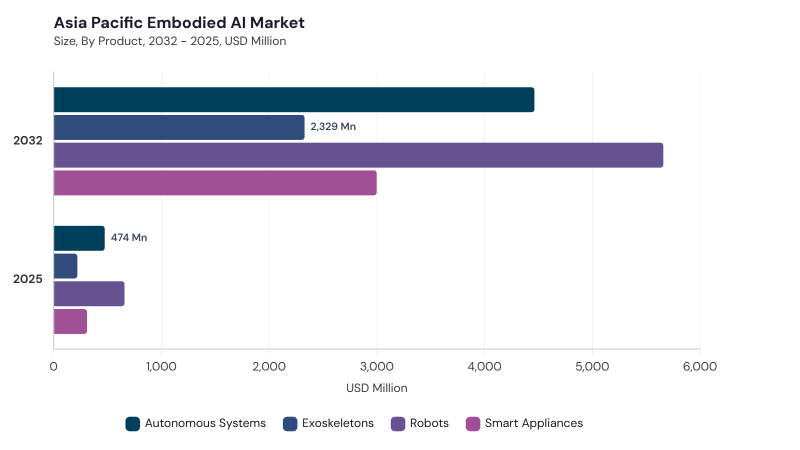
Based on Product, the market is segmented into Robots, Autonomous Systems, Smart Appliances, and Exoskeletons. The Robots market dominated the Asia Pacific Embodied AI Market by Product in 2025, and would continue to be a dominant market till 2033; thereby, achieving a market value of USD 2.9 billion by 2030, growing at a CAGR of 37 % during the forecast period. The Autonomous Systems market is expected to witness a CAGR of 38.8% during (2026 - 2033). Additionally, The Smart Appliances market is expected to witness highest CAGR of 39.4% during (2026 - 2033).
Robots lead the market due to their wide deployment in manufacturing, logistics, healthcare, customer service, smart factories, and public-facing automation. Industrial robots, humanoid robots, service robots, collaborative robots, and mobile robots are increasingly being designed with stronger perception, movement, reasoning, and interaction capabilities. Autonomous Systems are gaining ground through drones, autonomous vehicles, AGVs, inspection platforms, agricultural robots, and defense systems that require independent navigation and situational awareness. Smart Appliances are expanding through connected homes and AI-enabled consumer devices, while Exoskeletons are growing through rehabilitation, elderly care, industrial workforce support, and defense-related human augmentation.
End Use Outlook
Based on End Use, the market is segmented into Automation & Manufacturing, Logistics & Supply Chain, Healthcare, Automotive, Defense & Security, Retail, Education, and Other End Use. Automation & Manufacturing leads because Asia Pacific hosts major production hubs that are adopting AI-powered robots, smart assembly systems, quality inspection robots, machine tending solutions, and human-machine collaboration tools.
These systems help improve precision, reduce labor pressure, increase factory resilience, and support flexible production across automotive, electronics, semiconductors, and industrial goods. Logistics & Supply Chain is expanding through warehouse automation, robotic sorting, inventory handling, autonomous mobile robots, and last-mile delivery systems. Healthcare, Automotive, and Defense & Security are gaining demand through robotic surgery, rehabilitation, autonomous mobility, surveillance, and intelligent defense platforms, while Retail, Education, and Other End Use are emerging through service robots, interactive learning systems, agriculture, hospitality, and smart city applications.
Free Valuable Insights: Embodied AI Market is Predicted to reach USD 71.3 Billion billion by 2033, at a CAGR of 37.9%
Country Outlook
Based on Country, the market is segmented into China, Japan, India, South Korea, Singapore, Malaysia, and Rest of Asia Pacific. The China market dominated the Asia Pacific Embodied AI Market by Country in 2025, and would continue to be a dominant market till 2033; thereby, achieving a market value of USD 2.4 billion by 2030, growing at a CAGR of 36.4 % during the forecast period. The Japan market is expected to witness a CAGR of 37.7% during (2026 - 2033). Additionally, The India market is expected to witness a CAGR of 39.8% during (2026 - 2033).
China leads due to national AI priorities, strong robotics manufacturing, large-scale industrial automation, humanoid robot development, AI chip deployment, and rapid commercialization of physical AI systems. Japan contributes through advanced robotics heritage, labor shortage-driven automation, 5G and edge IoT integration, and strong demand for service and industrial robots. India is advancing through AI infrastructure investments, digital manufacturing initiatives, robotics startups, healthcare automation, and localized deployment models. South Korea, Singapore, and Malaysia add momentum through smart city programs, AI research hubs, domain-specific robotics, semiconductor capabilities, and service automation, while Rest of Asia Pacific benefits from adoption in logistics, agriculture, healthcare, and localized AI-enabled automation.
List of Key Companies Profiled
- NVIDIA Corporation
- Tesla, Inc.
- Amazon Robotics (Amazon.com, Inc.)
- Google DeepMind / Google LLC (Alphabet Inc.)
- Boston Dynamics, Inc. (Hyundai Motor Group)
- Figure AI, Inc.
- Agility Robotics, Inc.
- Apptronik, Inc.
- Unitree Robotics
- Sanctuary Cognitive Systems Corporation
Asia Pacific Embodied AI Market Report Segmentation
By Component
- Hardware
- Software
- Services
By Product
- Robots
- Autonomous Systems
- Smart Appliances
- Exoskeletons
By End Use
- Automation & Manufacturing
- Logistics & Supply Chain
- Healthcare
- Automotive
- Defense & Security
- Retail
- Education
- Other End Use
By Country
- China
- Japan
- India
- South Korea
- Singapore
- Malaysia
- Rest of Asia Pacific
1.1 Market Overview
1.2 Key Factors Impacting Market
1.2.1 Market Drivers
1.2.2 Market Restraints
1.2.3 Market Opportunities
1.2.4 Market Challenges
1.2.5 Market Trends
1.2.6 State of Competition
1.2.7 Market Consolidation
1.2.8 Key Customer Criteria
1.3 Product Life Cycle
1.4 Segmentation By Deployment
1.4.1 On-Premise
1.4.2 Cloud-based
1.5 Segmentation By Enterprise Size
1.5.1 Large Enterprises
1.5.2 SMEs
1.6 Segmentation By Component
1.6.1 Hardware
1.6.2 Software
1.6.3 Services
1.7 Segmentation By End Use
1.7.1 BFSI
1.7.2 IT & Telecom
1.7.3 Healthcare
1.7.4 Manufacturing
1.7.5 Government & Defense
1.7.6 E-commerce & Retail
1.7.7 Other End Use
1.8 Segmentation By Country
1.8.1 China
1.8.1.1 Segmentation By Deployment
1.8.1.1.1 On-Premise
1.8.1.1.2 Cloud-Based
1.8.1.2 Segmentation By Enterprise Size
1.8.1.2.1 Large Enterprises
1.8.1.2.2 SMEs
1.8.1.3 Segmentation By Component
1.8.1.3.1 Hardware
1.8.1.3.2 Software
1.8.1.3.3 Services
1.8.1.4 Segmentation By End Use
1.8.1.4.1 BFSI
1.8.1.4.2 IT & Telecom
1.8.1.4.3 Healthcare
1.8.1.4.4 Manufacturing
1.8.1.4.5 Government & Defense
1.8.1.4.6 E-commerce & Retail
1.8.1.4.7 Other End Use
1.8.2 Japan
1.8.2.1 Segmentation By Deployment
1.8.2.1.1 On-Premise
1.8.2.1.2 Cloud-Based
1.8.2.2 Segmentation By Enterprise Size
1.8.2.2.1 Large Enterprises
1.8.2.2.2 SMEs
1.8.2.3 Segmentation By Component
1.8.2.3.1 Hardware
1.8.2.3.2 Software
1.8.2.3.3 Services
1.8.2.4 Segmentation By End Use
1.8.2.4.1 BFSI
1.8.2.4.2 IT & Telecom
1.8.2.4.3 Healthcare
1.8.2.4.4 Manufacturing
1.8.2.4.5 Government & Defense
1.8.2.4.6 E-commerce & Retail
1.8.2.4.7 Other End Use
1.8.3 India
1.8.3.1 Segmentation By Deployment
1.8.3.1.1 On-Premise
1.8.3.1.2 Cloud-Based
1.8.3.2 Segmentation By Enterprise Size
1.8.3.2.1 Large Enterprises
1.8.3.2.2 SMEs
1.8.3.3 Segmentation By Component
1.8.3.3.1 Hardware
1.8.3.3.2 Software
1.8.3.3.3 Services
1.8.3.4 Segmentation By End Use
1.8.3.4.1 BFSI
1.8.3.4.2 IT & Telecom
1.8.3.4.3 Healthcare
1.8.3.4.4 Manufacturing
1.8.3.4.5 Government & Defense
1.8.3.4.6 E-commerce & Retail
1.8.3.4.7 Other End Use
1.8.4 South Korea
1.8.4.1 Segmentation By Deployment
1.8.4.1.1 On-Premise
1.8.4.1.2 Cloud-Based
1.8.4.2 Segmentation By Enterprise Size
1.8.4.2.1 Large Enterprises
1.8.4.2.2 SMEs
1.8.4.3 Segmentation By Component
1.8.4.3.1 Hardware
1.8.4.3.2 Software
1.8.4.3.3 Services
1.8.4.4 Segmentation By End Use
1.8.4.4.1 BFSI
1.8.4.4.2 IT & Telecom
1.8.4.4.3 Healthcare
1.8.4.4.4 Manufacturing
1.8.4.4.5 Government & Defense
1.8.4.4.6 E-commerce & Retail
1.8.4.4.7 Other End Use
1.8.5 Singapore
1.8.5.1 Segmentation By Deployment
1.8.5.1.1 On-Premise
1.8.5.1.2 Cloud-Based
1.8.5.2 Segmentation By Enterprise Size
1.8.5.2.1 Large Enterprises
1.8.5.2.2 SMEs
1.8.5.3 Segmentation By Component
1.8.5.3.1 Hardware
1.8.5.3.2 Software
1.8.5.3.3 Services
1.8.5.4 Segmentation By End Use
1.8.5.4.1 BFSI
1.8.5.4.2 IT & Telecom
1.8.5.4.3 Healthcare
1.8.5.4.4 Manufacturing
1.8.5.4.5 Government & Defense
1.8.5.4.6 E-commerce & Retail
1.8.5.4.7 Other End Use
1.8.6 Malaysia
1.8.6.1 Segmentation By Deployment
1.8.6.1.1 On-Premise
1.8.6.1.2 Cloud-Based
1.8.6.2 Segmentation By Enterprise Size
1.8.6.2.1 Large Enterprises
1.8.6.2.2 SMEs
1.8.6.3 Segmentation By Component
1.8.6.3.1 Hardware
1.8.6.3.2 Software
1.8.6.3.3 Services
1.8.6.4 Segmentation By End Use
1.8.6.4.1 BFSI
1.8.6.4.2 IT & Telecom
1.8.6.4.3 Healthcare
1.8.6.4.4 Manufacturing
1.8.6.4.5 Government & Defense
1.8.6.4.6 E-commerce & Retail
1.8.6.4.7 Other End Use
1.8.7 Rest of Asia Pacific
1.8.7.1 Segmentation By Deployment
1.8.7.1.1 On-Premise
1.8.7.1.2 Cloud-Based
1.8.7.2 Segmentation By Enterprise Size
1.8.7.2.1 Large Enterprises
1.8.7.2.2 SMEs
1.8.7.3 Segmentation By Component
1.8.7.3.1 Hardware
1.8.7.3.2 Software
1.8.7.3.3 Services
1.8.7.4 Segmentation By End Use
1.8.7.4.1 BFSI
1.8.7.4.2 IT & Telecom
1.8.7.4.3 Healthcare
1.8.7.4.4 Manufacturing
1.8.7.4.5 Government & Defense
1.8.7.4.6 E-commerce & Retail
1.8.7.4.7 Other End Use
Chapter 2. Company Snaphots
2.1 Hewlett Packard Enterprise (HPE)
2.1.1 Business Overview
2.1.2 Key Information
2.1.3 Company Focus on Fault-tolerant Servers Market
2.1.4 Strategic Insights
2.1.5 Strategy Deployed
2.1.6 Product & Service Portfolio
2.1.7 Representative Products
2.1.8 Capability Overview
2.1.9 Technology & Innovation Focus
2.1.10 SWOT Analysis
2.1.11 Customers / End Users
2.1.12 Competitive Positioning
2.1.13 Key Differentiators
2.1.14 Portfolio Matrix
2.1.15 Analyst View
2.1.16 Future Outlook
2.2 Penguin Solutions
2.2.1 Business Overview
2.2.2 Key Information
2.2.3 Company Focus on Fault-tolerant Servers Market
2.2.4 Strategic Insights
2.2.5 Strategy Deployed
2.2.6 Product & Service Portfolio
2.2.7 Representative Products
2.2.8 Capability Overview
2.2.9 Technology & Innovation Focus
2.2.10 SWOT Analysis
2.2.11 Customers / End Users
2.2.12 Competitive Positioning
2.2.13 Key Differentiators
2.2.14 Portfolio Matrix
2.2.15 Analyst View
2.2.16 Future Outlook
2.3 NEC Corporation
2.3.1 Business Overview
2.3.2 Key Information
2.3.3 Company Focus on Fault-tolerant Servers Market
2.3.4 Strategic Insights
2.3.5 Strategy Deployed
2.3.6 Product & Service Portfolio
2.3.7 Capability Overview
2.3.8 Technology & Innovation Focus
2.3.9 SWOT Analysis
2.3.10 Customers / End Users
2.3.11 Competitive Positioning
2.3.12 Key Differentiators
2.3.13 Portfolio Matrix
2.3.14 Analyst View
2.3.15 Future Outlook
2.4 IBM Corporation
2.4.1 Business Overview
2.4.2 Key Information
2.4.3 Company Focus on Fault-tolerant Servers Market
2.4.4 Strategic Insights
2.4.5 Strategy Deployed
2.4.6 Product & Service Portfolio
2.4.7 Representative Products
2.4.8 Capability Overview
2.4.9 Technology & Innovation Focus
2.4.10 SWOT Analysis
2.4.11 Customers / End Users
2.4.12 Competitive Positioning
2.4.13 Key Differentiators
2.4.14 Portfolio Matrix
2.4.15 Analyst View
2.4.16 Future Outlook
2.5 Fujitsu Limited
2.5.1 Business Overview
2.5.2 Key Information
2.5.3 Company Focus on Fault-tolerant Servers Market
2.5.4 Strategic Insights
2.5.5 Strategy Deployed
2.5.6 Product & Service Portfolio
2.5.7 Representative Products
2.5.8 Capability Overview
2.5.9 Technology & Innovation Focus
2.5.10 SWOT Analysis
2.5.11 Customers / End Users 2.5.12 Competitive Positioning
2.5.13 Key Differentiators
2.5.14 Portfolio Matrix
2.5.15 Analyst View
2.5.16 Future Outlook
2.6 Oracle Corporation
2.6.1 Business Overview
2.6.2 Key Information
2.6.3 Company Focus on Fault-tolerant Servers Market
2.6.4 Strategic Insights
2.6.5 Strategy Deployed
2.6.6 Product & Service Portfolio
2.6.7 Representative Products
2.6.8 Capability Overview
2.6.9 Technology & Innovation Focus
2.6.10 SWOT Analysis
2.6.11 Customers / End Users
2.6.12 Competitive Positioning
2.6.13 Key Differentiators
2.6.14 Portfolio Matrix
2.6.15 Analyst View
2.6.16 Future Outlook
2.7 Dell Technologies
2.7.1 Business Overview
2.7.2 Key Information
2.7.3 Company Focus on Fault-tolerant Servers Market
2.7.4 Strategic Insights
2.7.5 Strategy Deployed
2.7.6 Product & Service Portfolio
2.7.7 Representative Products
2.7.8 Capability Overview
2.7.9 Technology & Innovation Focus
2.7.10 SWOT Analysis
2.7.11 Customers / End Users
2.7.12 Competitive Positioning
2.7.13 Key Differentiators
2.7.14 Portfolio Matrix
2.7.15 Analyst View
2.7.16 Future Outlook
2.8 Lenovo Group
2.8.1 Business Overview
2.8.2 Key Information
2.8.3 Company Focus on Fault-tolerant Servers Market
2.8.4 Strategic Insights
2.8.5 Strategy Deployed
2.8.6 Product & Service Portfolio
2.8.7 Capability Overview
2.8.8 Technology & Innovation Focus
2.8.9 SWOT Analysis
2.8.10 Customers / End Users
2.8.11 Competitive Positioning
2.8.12 Key Differentiators
2.8.13 Portfolio Matrix
2.8.14 Analyst View
2.8.15 Future Outlook
2.9 Super Micro Computer, Inc.
2.9.1 Business Overview
2.9.2 Key Information
2.9.3 Company Focus on Fault-tolerant Servers Market
2.9.4 Strategic Insights
2.9.5 Strategy Deployed
2.9.6 Product & Service Portfolio
2.9.7 Representative Products
2.9.8 Capability Overview
2.9.9 Technology & Innovation Focus
2.9.10 SWOT Analysis
2.9.11 Customers / End Users
2.9.12 Competitive Positioning
2.9.13 Key Differentiators
2.9.14 Portfolio Matrix
2.9.15 Analyst View
2.9.16 Future Outlook
2.10 Cisco Systems, Inc.
2.10.1 Business Overview
2.10.2 Key Information
2.10.3 Company Focus on Fault-tolerant Servers Market
2.10.4 Strategic Insights
2.10.5 Strategy Deployed
2.10.6 Product & Service Portfolio
2.10.7 Representative Products
2.10.8 Capability Overview
2.10.9 Technology & Innovation Focus
2.10.10 SWOT Analysis
2.10.11 Customers / End Users
2.10.12 Competitive Positioning
2.10.13 Key Differentiators
2.10.14 Portfolio Matrix
2.10.15 Analyst View
2.10.16 Future Outlook
Table 1 Asia Pacific Fault-tolerant Servers Market Market, 2022 - 2033, USD Million
Table 2 Asia Pacific Fault-tolerant Servers Market Market by Component, 2022 - 2033, USD Million
Table 3 Asia Pacific Hardware Market, 2022 - 2033, USD Million
Table 4 Asia Pacific Services Market, 2022 - 2033, USD Million
Table 5 Asia Pacific Software Market, 2022 - 2033, USD Million
Table 6 Asia Pacific Fault-tolerant Servers Market Market by Deployment, 2022 - 2033, USD Million
Table 7 Asia Pacific Cloud-based Market, 2022 - 2033, USD Million
Table 8 Asia Pacific On-Premise Market, 2022 - 2033, USD Million
Table 9 Asia Pacific Fault-tolerant Servers Market Market by End Use, 2022 - 2033, USD Million
Table 10 Asia Pacific BFSI Market, 2022 - 2033, USD Million
Table 11 Asia Pacific E-commerce & Retail Market, 2022 - 2033, USD Million
Table 12 Asia Pacific Government & Defense Market, 2022 - 2033, USD Million
Table 13 Asia Pacific Healthcare Market, 2022 - 2033, USD Million
Table 14 Asia Pacific IT & Telecom Market, 2022 - 2033, USD Million
Table 15 Asia Pacific Manufacturing Market, 2022 - 2033, USD Million
Table 16 Asia Pacific Other End Use Market, 2022 - 2033, USD Million
Table 17 Asia Pacific Fault-tolerant Servers Market Market by Enterprise Size, 2022 - 2033, USD Million
Table 18 Asia Pacific Large Enterprises Market, 2022 - 2033, USD Million
Table 19 Asia Pacific SMEs Market, 2022 - 2033, USD Million
Table 20 China Fault-tolerant Servers Market Market, 2022 - 2033, USD Million
Table 21 China Fault-tolerant Servers Market Market by Component, 2022 - 2033, USD Million
Table 22 China Hardware Market, 2022 - 2033, USD Million
Table 23 China Services Market, 2022 - 2033, USD Million
Table 24 China Software Market, 2022 - 2033, USD Million
Table 25 China Fault-tolerant Servers Market Market by Deployment, 2022 - 2033, USD Million
Table 26 China Cloud-based Market, 2022 - 2033, USD Million
Table 27 China On-Premise Market, 2022 - 2033, USD Million
Table 28 China Fault-tolerant Servers Market Market by End Use, 2022 - 2033, USD Million
Table 29 China BFSI Market, 2022 - 2033, USD Million
Table 30 China E-commerce & Retail Market, 2022 - 2033, USD Million
Table 31 China Government & Defense Market, 2022 - 2033, USD Million
Table 32 China Healthcare Market, 2022 - 2033, USD Million
Table 33 China IT & Telecom Market, 2022 - 2033, USD Million
Table 34 China Manufacturing Market, 2022 - 2033, USD Million
Table 35 China Other End Use Market, 2022 - 2033, USD Million
Table 36 China Fault-tolerant Servers Market Market by Enterprise Size, 2022 - 2033, USD Million
Table 37 China Large Enterprises Market, 2022 - 2033, USD Million
Table 38 China SMEs Market, 2022 - 2033, USD Million
Table 39 Japan Fault-tolerant Servers Market Market, 2022 - 2033, USD Million
Table 40 Japan Fault-tolerant Servers Market Market by Component, 2022 - 2033, USD Million
Table 41 Japan Hardware Market, 2022 - 2033, USD Million
Table 42 Japan Services Market, 2022 - 2033, USD Million
Table 43 Japan Software Market, 2022 - 2033, USD Million
Table 44 Japan Fault-tolerant Servers Market Market by Deployment, 2022 - 2033, USD Million
Table 45 Japan Cloud-based Market, 2022 - 2033, USD Million
Table 46 Japan On-Premise Market, 2022 - 2033, USD Million
Table 47 Japan Fault-tolerant Servers Market Market by End Use, 2022 - 2033, USD Million
Table 48 Japan BFSI Market, 2022 - 2033, USD Million
Table 49 Japan E-commerce & Retail Market, 2022 - 2033, USD Million
Table 50 Japan Government & Defense Market, 2022 - 2033, USD Million
Table 51 Japan Healthcare Market, 2022 - 2033, USD Million
Table 52 Japan IT & Telecom Market, 2022 - 2033, USD Million
Table 53 Japan Manufacturing Market, 2022 - 2033, USD Million
Table 54 Japan Other End Use Market, 2022 - 2033, USD Million
Table 55 Japan Fault-tolerant Servers Market Market by Enterprise Size, 2022 - 2033, USD Million
Table 56 Japan Large Enterprises Market, 2022 - 2033, USD Million
Table 57 Japan SMEs Market, 2022 - 2033, USD Million
Table 58 India Fault-tolerant Servers Market Market, 2022 - 2033, USD Million
Table 59 India Fault-tolerant Servers Market Market by Component, 2022 - 2033, USD Million
Table 60 India Hardware Market, 2022 - 2033, USD Million
Table 61 India Services Market, 2022 - 2033, USD Million
Table 62 India Software Market, 2022 - 2033, USD Million
Table 63 India Fault-tolerant Servers Market Market by Deployment, 2022 - 2033, USD Million
Table 64 India Cloud-based Market, 2022 - 2033, USD Million
Table 65 India On-Premise Market, 2022 - 2033, USD Million
Table 66 India Fault-tolerant Servers Market Market by End Use, 2022 - 2033, USD Million
Table 67 India BFSI Market, 2022 - 2033, USD Million
Table 68 India E-commerce & Retail Market, 2022 - 2033, USD Million
Table 69 India Government & Defense Market, 2022 - 2033, USD Million
Table 70 India Healthcare Market, 2022 - 2033, USD Million
Table 71 India IT & Telecom Market, 2022 - 2033, USD Million
Table 72 India Manufacturing Market, 2022 - 2033, USD Million
Table 73 India Other End Use Market, 2022 - 2033, USD Million
Table 74 India Fault-tolerant Servers Market Market by Enterprise Size, 2022 - 2033, USD Million
Table 75 India Large Enterprises Market, 2022 - 2033, USD Million
Table 76 India SMEs Market, 2022 - 2033, USD Million
Table 77 South Korea Fault-tolerant Servers Market Market, 2022 - 2033, USD Million
Table 78 South Korea Fault-tolerant Servers Market Market by Component, 2022 - 2033, USD Million
Table 79 South Korea Hardware Market, 2022 - 2033, USD Million
Table 80 South Korea Services Market, 2022 - 2033, USD Million
Table 81 South Korea Software Market, 2022 - 2033, USD Million
Table 82 South Korea Fault-tolerant Servers Market Market by Deployment, 2022 - 2033, USD Million
Table 83 South Korea Cloud-based Market, 2022 - 2033, USD Million
Table 84 South Korea On-Premise Market, 2022 - 2033, USD Million
Table 85 South Korea Fault-tolerant Servers Market Market by End Use, 2022 - 2033, USD Million
Table 86 South Korea BFSI Market, 2022 - 2033, USD Million
Table 87 South Korea E-commerce & Retail Market, 2022 - 2033, USD Million
Table 88 South Korea Government & Defense Market, 2022 - 2033, USD Million
Table 89 South Korea Healthcare Market, 2022 - 2033, USD Million
Table 90 South Korea IT & Telecom Market, 2022 - 2033, USD Million
Table 91 South Korea Manufacturing Market, 2022 - 2033, USD Million
Table 92 South Korea Other End Use Market, 2022 - 2033, USD Million
Table 93 South Korea Fault-tolerant Servers Market Market by Enterprise Size, 2022 - 2033, USD Million
Table 94 South Korea Large Enterprises Market, 2022 - 2033, USD Million
Table 95 South Korea SMEs Market, 2022 - 2033, USD Million
Table 96 Singapore Fault-tolerant Servers Market Market, 2022 - 2033, USD Million
Table 97 Singapore Fault-tolerant Servers Market Market by Component, 2022 - 2033, USD Million
Table 98 Singapore Hardware Market, 2022 - 2033, USD Million
Table 99 Singapore Services Market, 2022 - 2033, USD Million
Table 100 Singapore Software Market, 2022 - 2033, USD Million
Table 101 Singapore Fault-tolerant Servers Market Market by Deployment, 2022 - 2033, USD Million
Table 102 Singapore Cloud-based Market, 2022 - 2033, USD Million
Table 103 Singapore On-Premise Market, 2022 - 2033, USD Million
Table 104 Singapore Fault-tolerant Servers Market Market by End Use, 2022 - 2033, USD Million
Table 105 Singapore BFSI Market, 2022 - 2033, USD Million
Table 106 Singapore E-commerce & Retail Market, 2022 - 2033, USD Million
Table 107 Singapore Government & Defense Market, 2022 - 2033, USD Million
Table 108 Singapore Healthcare Market, 2022 - 2033, USD Million
Table 109 Singapore IT & Telecom Market, 2022 - 2033, USD Million
Table 110 Singapore Manufacturing Market, 2022 - 2033, USD Million
Table 111 Singapore Other End Use Market, 2022 - 2033, USD Million
Table 112 Singapore Fault-tolerant Servers Market Market by Enterprise Size, 2022 - 2033, USD Million
Table 113 Singapore Large Enterprises Market, 2022 - 2033, USD Million
Table 114 Singapore SMEs Market, 2022 - 2033, USD Million
Table 115 Malaysia Fault-tolerant Servers Market Market, 2022 - 2033, USD Million
Table 116 Malaysia Fault-tolerant Servers Market Market by Component, 2022 - 2033, USD Million
Table 117 Malaysia Hardware Market, 2022 - 2033, USD Million
Table 118 Malaysia Services Market, 2022 - 2033, USD Million
Table 119 Malaysia Software Market, 2022 - 2033, USD Million
Table 120 Malaysia Fault-tolerant Servers Market Market by Deployment, 2022 - 2033, USD Million
Table 121 Malaysia Cloud-based Market, 2022 - 2033, USD Million
Table 122 Malaysia On-Premise Market, 2022 - 2033, USD Million
Table 123 Malaysia Fault-tolerant Servers Market Market by End Use, 2022 - 2033, USD Million
Table 124 Malaysia BFSI Market, 2022 - 2033, USD Million
Table 125 Malaysia E-commerce & Retail Market, 2022 - 2033, USD Million
Table 126 Malaysia Government & Defense Market, 2022 - 2033, USD Million
Table 127 Malaysia Healthcare Market, 2022 - 2033, USD Million
Table 128 Malaysia IT & Telecom Market, 2022 - 2033, USD Million
Table 129 Malaysia Manufacturing Market, 2022 - 2033, USD Million
Table 130 Malaysia Other End Use Market, 2022 - 2033, USD Million
Table 131 Malaysia Fault-tolerant Servers Market Market by Enterprise Size, 2022 - 2033, USD Million
Table 132 Malaysia Large Enterprises Market, 2022 - 2033, USD Million
Table 133 Malaysia SMEs Market, 2022 - 2033, USD Million
Table 134 Rest of Asia Pacific Fault-tolerant Servers Market Market, 2022 - 2033, USD Million
Table 135 Rest of Asia Pacific Fault-tolerant Servers Market Market by Component, 2022 - 2033, USD Million
Table 136 Rest of Asia Pacific Hardware Market, 2022 - 2033, USD Million
Table 137 Rest of Asia Pacific Services Market, 2022 - 2033, USD Million
Table 138 Rest of Asia Pacific Software Market, 2022 - 2033, USD Million
Table 139 Rest of Asia Pacific Fault-tolerant Servers Market Market by Deployment, 2022 - 2033, USD Million
Table 140 Rest of Asia Pacific Cloud-based Market, 2022 - 2033, USD Million
Table 141 Rest of Asia Pacific On-Premise Market, 2022 - 2033, USD Million
Table 142 Rest of Asia Pacific Fault-tolerant Servers Market Market by End Use, 2022 - 2033, USD Million
Table 143 Rest of Asia Pacific BFSI Market, 2022 - 2033, USD Million
Table 144 Rest of Asia Pacific E-commerce & Retail Market, 2022 - 2033, USD Million
Table 145 Rest of Asia Pacific Government & Defense Market, 2022 - 2033, USD Million
Table 146 Rest of Asia Pacific Healthcare Market, 2022 - 2033, USD Million
Table 147 Rest of Asia Pacific IT & Telecom Market, 2022 - 2033, USD Million
Table 148 Rest of Asia Pacific Manufacturing Market, 2022 - 2033, USD Million
Table 149 Rest of Asia Pacific Other End Use Market, 2022 - 2033, USD Million
Table 150 Rest of Asia Pacific Fault-tolerant Servers Market Market by Enterprise Size, 2022 - 2033, USD Million
Table 151 Rest of Asia Pacific Large Enterprises Market, 2022 - 2033, USD Million
Table 152 Rest of Asia Pacific SMEs Market, 2022 - 2033, USD Million
List of Figures
FIG 1 Key Factors Impacting Market
FIG 2 Market Consolidation
FIG 3 Key Customer Criteria
FIG 4 Product Life Cycle
FIG 5 Asia Pacific Fault-tolerant Servers Market Market, 2022 - 2033, USD Million
FIG 6 Asia Pacific Fault-tolerant Servers Market Market by Component, 2022 - 2033, USD Million
FIG 7 Asia Pacific Hardware Market, 2022 - 2033, USD Million
FIG 8 Asia Pacific Services Market, 2022 - 2033, USD Million
FIG 9 Asia Pacific Software Market, 2022 - 2033, USD Million
FIG 10 Asia Pacific Fault-tolerant Servers Market Market by Deployment, 2022 - 2033, USD Million
FIG 11 Asia Pacific Cloud-based Market, 2022 - 2033, USD Million
FIG 12 Asia Pacific On-Premise Market, 2022 - 2033, USD Million
FIG 13 Asia Pacific Fault-tolerant Servers Market Market by End Use, 2022 - 2033, USD Million
FIG 14 Asia Pacific BFSI Market, 2022 - 2033, USD Million
FIG 15 Asia Pacific E-commerce & Retail Market, 2022 - 2033, USD Million
FIG 16 Asia Pacific Government & Defense Market, 2022 - 2033, USD Million
FIG 17 Asia Pacific Healthcare Market, 2022 - 2033, USD Million
FIG 18 Asia Pacific IT & Telecom Market, 2022 - 2033, USD Million
FIG 19 Asia Pacific Manufacturing Market, 2022 - 2033, USD Million
FIG 20 Asia Pacific Other End Use Market, 2022 - 2033, USD Million
FIG 21 Asia Pacific Fault-tolerant Servers Market Market by Enterprise Size, 2022 - 2033, USD Million
FIG 22 Asia Pacific Large Enterprises Market, 2022 - 2033, USD Million
FIG 23 Asia Pacific SMEs Market, 2022 - 2033, USD Million
FIG 24 China Fault-tolerant Servers Market Market, 2022 - 2033, USD Million
FIG 25 China Fault-tolerant Servers Market Market by Component, 2022 - 2033, USD Million
FIG 26 China Hardware Market, 2022 - 2033, USD Million
FIG 27 China Services Market, 2022 - 2033, USD Million
FIG 28 China Software Market, 2022 - 2033, USD Million
FIG 29 China Fault-tolerant Servers Market Market by Deployment, 2022 - 2033, USD Million
FIG 30 China Cloud-based Market, 2022 - 2033, USD Million
FIG 31 China On-Premise Market, 2022 - 2033, USD Million
FIG 32 China Fault-tolerant Servers Market Market by End Use, 2022 - 2033, USD Million
FIG 33 China BFSI Market, 2022 - 2033, USD Million
FIG 34 China E-commerce & Retail Market, 2022 - 2033, USD Million
FIG 35 China Government & Defense Market, 2022 - 2033, USD Million
FIG 36 China Healthcare Market, 2022 - 2033, USD Million
FIG 37 China IT & Telecom Market, 2022 - 2033, USD Million
FIG 38 China Manufacturing Market, 2022 - 2033, USD Million
FIG 39 China Other End Use Market, 2022 - 2033, USD Million
FIG 40 China Fault-tolerant Servers Market Market by Enterprise Size, 2022 - 2033, USD Million
FIG 41 China Large Enterprises Market, 2022 - 2033, USD Million
FIG 42 China SMEs Market, 2022 - 2033, USD Million
FIG 43 Japan Fault-tolerant Servers Market Market, 2022 - 2033, USD Million
FIG 44 Japan Fault-tolerant Servers Market Market by Component, 2022 - 2033, USD Million
FIG 45 Japan Hardware Market, 2022 - 2033, USD Million
FIG 46 Japan Services Market, 2022 - 2033, USD Million
FIG 47 Japan Software Market, 2022 - 2033, USD Million
FIG 48 Japan Fault-tolerant Servers Market Market by Deployment, 2022 - 2033, USD Million
FIG 49 Japan Cloud-based Market, 2022 - 2033, USD Million
FIG 50 Japan On-Premise Market, 2022 - 2033, USD Million
FIG 51 Japan Fault-tolerant Servers Market Market by End Use, 2022 - 2033, USD Million
FIG 52 Japan BFSI Market, 2022 - 2033, USD Million
FIG 53 Japan E-commerce & Retail Market, 2022 - 2033, USD Million
FIG 54 Japan Government & Defense Market, 2022 - 2033, USD Million
FIG 55 Japan Healthcare Market, 2022 - 2033, USD Million
FIG 56 Japan IT & Telecom Market, 2022 - 2033, USD Million
FIG 57 Japan Manufacturing Market, 2022 - 2033, USD Million
FIG 58 Japan Other End Use Market, 2022 - 2033, USD Million
FIG 59 Japan Fault-tolerant Servers Market Market by Enterprise Size, 2022 - 2033, USD Million
FIG 60 Japan Large Enterprises Market, 2022 - 2033, USD Million
FIG 61 Japan SMEs Market, 2022 - 2033, USD Million
FIG 62 India Fault-tolerant Servers Market Market, 2022 - 2033, USD Million
FIG 63 India Fault-tolerant Servers Market Market by Component, 2022 - 2033, USD Million
FIG 64 India Hardware Market, 2022 - 2033, USD Million
FIG 65 India Services Market, 2022 - 2033, USD Million
FIG 66 India Software Market, 2022 - 2033, USD Million
FIG 67 India Fault-tolerant Servers Market Market by Deployment, 2022 - 2033, USD Million
FIG 68 India Cloud-based Market, 2022 - 2033, USD Million
FIG 69 India On-Premise Market, 2022 - 2033, USD Million
FIG 70 India Fault-tolerant Servers Market Market by End Use, 2022 - 2033, USD Million
FIG 71 India BFSI Market, 2022 - 2033, USD Million
FIG 72 India E-commerce & Retail Market, 2022 - 2033, USD Million
FIG 73 India Government & Defense Market, 2022 - 2033, USD Million
FIG 74 India Healthcare Market, 2022 - 2033, USD Million
FIG 75 India IT & Telecom Market, 2022 - 2033, USD Million
FIG 76 India Manufacturing Market, 2022 - 2033, USD Million
FIG 77 India Other End Use Market, 2022 - 2033, USD Million
FIG 78 India Fault-tolerant Servers Market Market by Enterprise Size, 2022 - 2033, USD Million
FIG 79 India Large Enterprises Market, 2022 - 2033, USD Million
FIG 80 India SMEs Market, 2022 - 2033, USD Million
FIG 81 South Korea Fault-tolerant Servers Market Market, 2022 - 2033, USD Million
FIG 82 South Korea Fault-tolerant Servers Market Market by Component, 2022 - 2033, USD Million
FIG 83 South Korea Hardware Market, 2022 - 2033, USD Million
FIG 84 South Korea Services Market, 2022 - 2033, USD Million
FIG 85 South Korea Software Market, 2022 - 2033, USD Million
FIG 86 South Korea Fault-tolerant Servers Market Market by Deployment, 2022 - 2033, USD Million
FIG 87 South Korea Cloud-based Market, 2022 - 2033, USD Million
FIG 88 South Korea On-Premise Market, 2022 - 2033, USD Million
FIG 89 South Korea Fault-tolerant Servers Market Market by End Use, 2022 - 2033, USD Million
FIG 90 South Korea BFSI Market, 2022 - 2033, USD Million FIG 91 South Korea E-commerce & Retail Market, 2022 - 2033, USD Million
FIG 92 South Korea Government & Defense Market, 2022 - 2033, USD Million
FIG 93 South Korea Healthcare Market, 2022 - 2033, USD Million
FIG 94 South Korea IT & Telecom Market, 2022 - 2033, USD Million
FIG 95 South Korea Manufacturing Market, 2022 - 2033, USD Million
FIG 96 South Korea Other End Use Market, 2022 - 2033, USD Million
FIG 97 South Korea Fault-tolerant Servers Market Market by Enterprise Size, 2022 - 2033, USD Million
FIG 98 South Korea Large Enterprises Market, 2022 - 2033, USD Million
FIG 99 South Korea SMEs Market, 2022 - 2033, USD Million
FIG 100 Singapore Fault-tolerant Servers Market Market, 2022 - 2033, USD Million
FIG 101 Singapore Fault-tolerant Servers Market Market by Component, 2022 - 2033, USD Million
FIG 102 Singapore Hardware Market, 2022 - 2033, USD Million
FIG 103 Singapore Services Market, 2022 - 2033, USD Million
FIG 104 Singapore Software Market, 2022 - 2033, USD Million
FIG 105 Singapore Fault-tolerant Servers Market Market by Deployment, 2022 - 2033, USD Million
FIG 106 Singapore Cloud-based Market, 2022 - 2033, USD Million
FIG 107 Singapore On-Premise Market, 2022 - 2033, USD Million
FIG 108 Singapore Fault-tolerant Servers Market Market by End Use, 2022 - 2033, USD Million
FIG 109 Singapore BFSI Market, 2022 - 2033, USD Million
FIG 110 Singapore E-commerce & Retail Market, 2022 - 2033, USD Million
FIG 111 Singapore Government & Defense Market, 2022 - 2033, USD Million
FIG 112 Singapore Healthcare Market, 2022 - 2033, USD Million
FIG 113 Singapore IT & Telecom Market, 2022 - 2033, USD Million
FIG 114 Singapore Manufacturing Market, 2022 - 2033, USD Million
FIG 115 Singapore Other End Use Market, 2022 - 2033, USD Million
FIG 116 Singapore Fault-tolerant Servers Market Market by Enterprise Size, 2022 - 2033, USD Million
FIG 117 Singapore Large Enterprises Market, 2022 - 2033, USD Million
FIG 118 Singapore SMEs Market, 2022 - 2033, USD Million
FIG 119 Malaysia Fault-tolerant Servers Market Market, 2022 - 2033, USD Million
FIG 120 Malaysia Fault-tolerant Servers Market Market by Component, 2022 - 2033, USD Million
FIG 121 Malaysia Hardware Market, 2022 - 2033, USD Million
FIG 122 Malaysia Services Market, 2022 - 2033, USD Million
FIG 123 Malaysia Software Market, 2022 - 2033, USD Million
FIG 124 Malaysia Fault-tolerant Servers Market Market by Deployment, 2022 - 2033, USD Million
FIG 125 Malaysia Cloud-based Market, 2022 - 2033, USD Million
FIG 126 Malaysia On-Premise Market, 2022 - 2033, USD Million
FIG 127 Malaysia Fault-tolerant Servers Market Market by End Use, 2022 - 2033, USD Million
FIG 128 Malaysia BFSI Market, 2022 - 2033, USD Million
FIG 129 Malaysia E-commerce & Retail Market, 2022 - 2033, USD Million
FIG 130 Malaysia Government & Defense Market, 2022 - 2033, USD Million
FIG 131 Malaysia Healthcare Market, 2022 - 2033, USD Million
FIG 132 Malaysia IT & Telecom Market, 2022 - 2033, USD Million
FIG 133 Malaysia Manufacturing Market, 2022 - 2033, USD Million
FIG 134 Malaysia Other End Use Market, 2022 - 2033, USD Million
FIG 135 Malaysia Fault-tolerant Servers Market Market by Enterprise Size, 2022 - 2033, USD Million
FIG 136 Malaysia Large Enterprises Market, 2022 - 2033, USD Million
FIG 137 Malaysia SMEs Market, 2022 - 2033, USD Million
FIG 138 Rest of Asia Pacific Fault-tolerant Servers Market Market, 2022 - 2033, USD Million
FIG 139 Rest of Asia Pacific Fault-tolerant Servers Market Market by Component, 2022 - 2033, USD Million
FIG 140 Rest of Asia Pacific Hardware Market, 2022 - 2033, USD Million
FIG 141 Rest of Asia Pacific Services Market, 2022 - 2033, USD Million
FIG 142 Rest of Asia Pacific Software Market, 2022 - 2033, USD Million
FIG 143 Rest of Asia Pacific Fault-tolerant Servers Market Market by Deployment, 2022 - 2033, USD Million
FIG 144 Rest of Asia Pacific Cloud-based Market, 2022 - 2033, USD Million
FIG 145 Rest of Asia Pacific On-Premise Market, 2022 - 2033, USD Million
FIG 146 Rest of Asia Pacific Fault-tolerant Servers Market Market by End Use, 2022 - 2033, USD Million
FIG 147 Rest of Asia Pacific BFSI Market, 2022 - 2033, USD Million
FIG 148 Rest of Asia Pacific E-commerce & Retail Market, 2022 - 2033, USD Million
FIG 149 Rest of Asia Pacific Government & Defense Market, 2022 - 2033, USD Million
FIG 150 Rest of Asia Pacific Healthcare Market, 2022 - 2033, USD Million
FIG 151 Rest of Asia Pacific IT & Telecom Market, 2022 - 2033, USD Million
FIG 152 Rest of Asia Pacific Manufacturing Market, 2022 - 2033, USD Million
FIG 153 Rest of Asia Pacific Other End Use Market, 2022 - 2033, USD Million
FIG 154 Rest of Asia Pacific Fault-tolerant Servers Market Market by Enterprise Size, 2022 - 2033, USD Million
FIG 155 Rest of Asia Pacific Large Enterprises Market, 2022 - 2033, USD Million
FIG 156 Rest of Asia Pacific SMEs Market, 2022 - 2033, USD Million