Global Ophthalmology PACS Market Size, Share & Industry Analysis Report By Type (Integrated, and Standalone), By End-use (Hospital, and Specialty Clinics), By Mode of Action (Cloud-based, and On-premises), By Regional Outlook and Forecast, 2026 - 2033
Published Date : 25-Oct-2026 |
Pages: 495 |
Report Format: PDF + Excel |
COVID-19 Impact on the Ophthalmology PACS Market
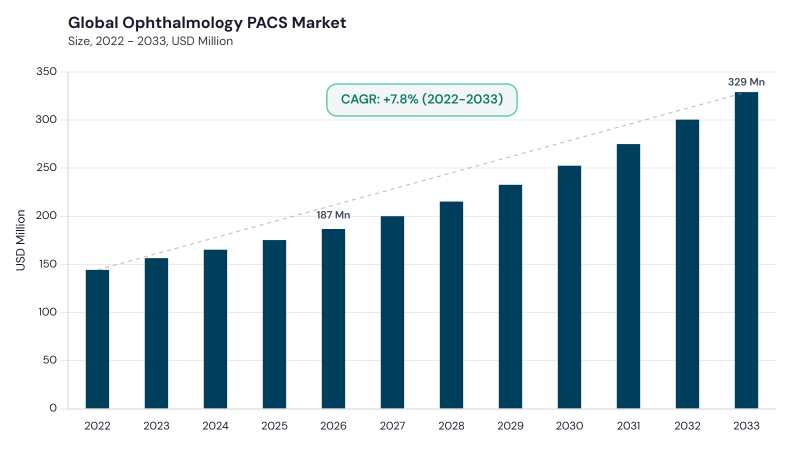
The Global Ophthalmology PACS Market is expected to reach USD 329.1 million by 2033, growing at a CAGR of 8.4% during (2026 - 2033).
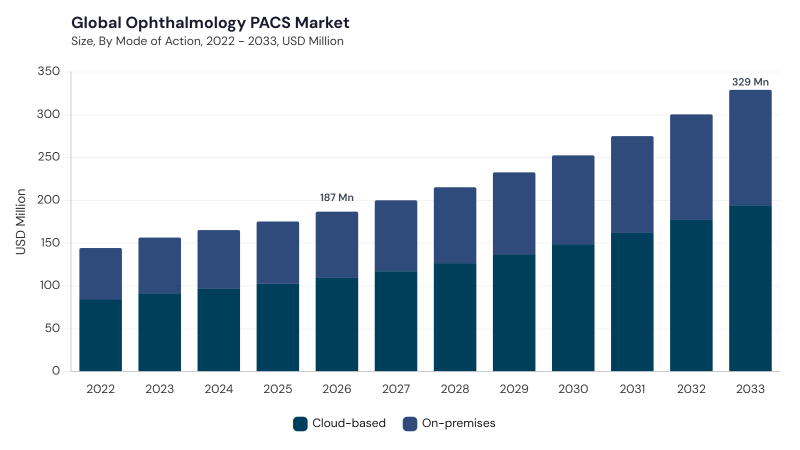
Growing ophthalmic imaging volumes, rising prevalence of eye disorders, and increasing need for centralized management of diagnostic images and patient information are driving the Ophthalmology PACS Market across hospitals, eye clinics, diagnostic centers, and specialty ophthalmology practices. Adoption is strengthened by wider use of OCT, fundus cameras, visual field analyzers, and other ophthalmic diagnostic systems. The market evolved from broader healthcare imaging systems into specialized platforms for eye-care diagnostics and longitudinal disease monitoring. Early systems mainly digitized and stored images from fundus cameras, OCT devices, slit-lamp imaging, and related diagnostic equipment, replacing manual or film-based workflows.
Key Market Trends & Insights
- By type, Integrated dominated with a revenue share of 57.47% in 2025 and is projected to reach USD 184.3 million by 2033, growing at a CAGR of 8.1% during (2026 - 2033).
- Standalone accounted for 42.53% of revenue in 2025 and is projected to reach USD 144.7 million by 2033, registering a CAGR of 8.9% during (2026 - 2033).
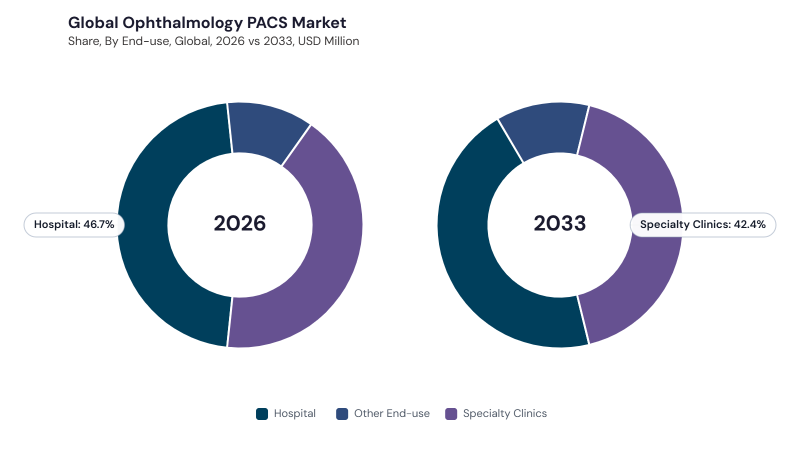
- By end-use, Hospital led with a revenue share of 46.82% in 2025 and is projected to reach USD 149.3 million by 2033, growing at a CAGR of 8.0% during (2026 - 2033).
- Specialty Clinics held 41.81% of revenue in 2025 and are projected to reach USD 139.4 million by 2033, growing at a CAGR of 8.6% during (2026 - 2033).
- Other End-use accounted for 11.37% of revenue in 2025 and is expected to register the fastest end-use CAGR of 9.5% during (2026 - 2033).
- By mode of action, Cloud-based dominated with a revenue share of 58.48% in 2025 and is projected to reach USD 194.2 million by 2033, growing at a CAGR of 8.5% during (2026 - 2033).
- On-premises represented 41.52% of revenue in 2025 and is projected to reach USD 134.8 million by 2033, growing at a CAGR of 8.2% during (2026 - 2033).
- Regionally, North America dominated with a revenue share of 44.07% in 2025 and is projected to reach USD 138.6 million by 2033, growing at a CAGR of 7.8% during (2026 - 2033).
- LAMEA is projected to register the fastest regional CAGR of 9.6% during (2026 - 2033), while Asia Pacific is expected to grow at a CAGR of 9.4%, supported by expanding ophthalmic care access, digital imaging adoption, and healthcare infrastructure development.
Rising prevalence of diabetic retinopathy, glaucoma, age-related macular degeneration, and other eye disorders is increasing the volume of ophthalmic diagnostic images generated across healthcare systems. PACS platforms help providers store, retrieve, compare, and share OCT scans, fundus photographs, visual field results, corneal images, and other eye-care data more efficiently. Growing screening initiatives and teleophthalmology programs are increasing demand for platforms that support remote image capture, specialist interpretation, and longitudinal patient monitoring. Cloud deployment is improving scalability and access across multi-site practices, while AI integration is expanding the role of PACS from image storage toward clinical decision support. These factors are moving ophthalmology PACS into the core of digital eye-care infrastructure.
Competition is moderately consolidated, with ophthalmic device manufacturers, enterprise imaging vendors, retinal screening platforms, and healthcare IT suppliers competing through interoperability, AI integration, cloud capabilities, and clinical workflow depth. Vendors differentiate by supporting multimodal imaging, EHR connectivity, longitudinal disease monitoring, data security, and teleophthalmology workflows. Established ophthalmic imaging companies benefit from device-software ecosystems, while enterprise PACS providers compete by integrating ophthalmology into broader hospital imaging infrastructure. Pricing flexibility, subscription-based deployment, regional localization, and compliance with healthcare data regulations also influence purchasing decisions. Strategic acquisitions, partnerships, and cloud platform expansion are intensifying competition.
Market Share Analysis
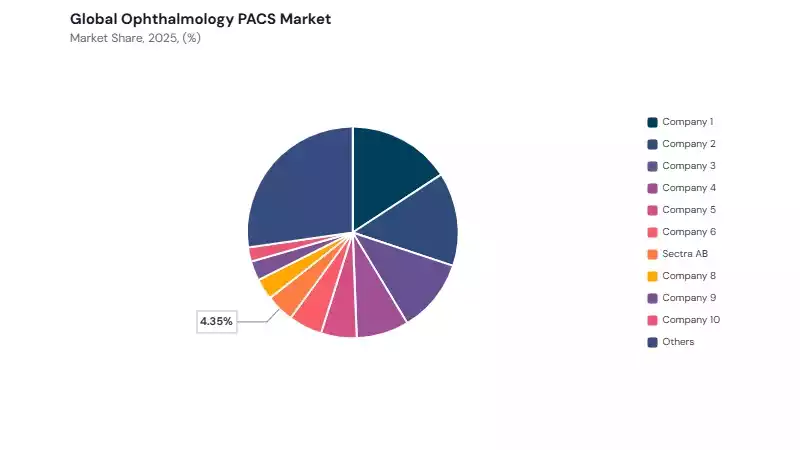
The Ophthalmology PACS Market is moderately concentrated, with leading ophthalmic imaging companies and enterprise imaging vendors holding strong positions. Carl Zeiss Meditec AG, Topcon Healthcare, and Heidelberg Engineering lead through established ophthalmic diagnostic ecosystems, device connectivity, and image-management capabilities. Optos plc, Haag-Streit Group, and NIDEK Co., Ltd. strengthen competition through retinal imaging, ophthalmic diagnostic platforms, and integrated workflow tools. Sectra AB and INFINITT Healthcare compete from the enterprise imaging side, while Sonomed Escalon and EyePACS serve specialized ophthalmology, retinal imaging, and teleophthalmology use cases. Future share gains will depend on interoperability, cloud access, AI workflow integration, cybersecurity, and longitudinal image management.
Type Outlook
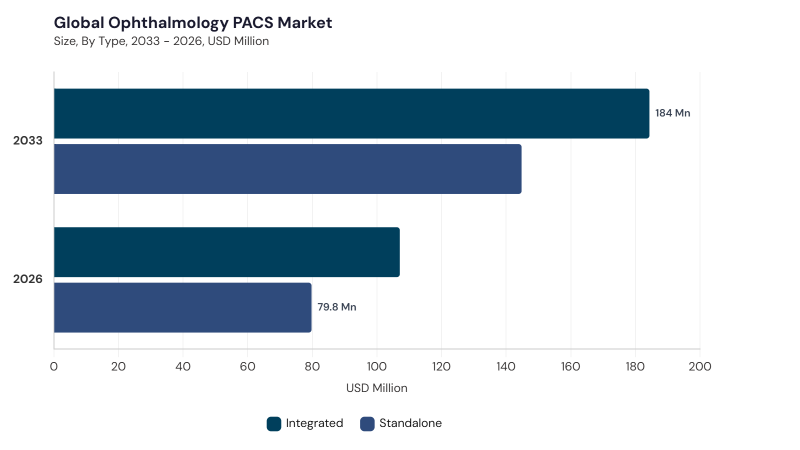
The Global Ophthalmology PACS Market, by type, is segmented into Integrated and Standalone. The Integrated market dominated the Global Ophthalmology PACS Market by Type in 2025, and would continue to be a dominant market till 2033; thereby, achieving a market value of USD 184.3 million by 2033, growing at a CAGR of 8.1 % during the forecast period. The Standalone market is expected to witness a CAGR of 8.9% during (2026 - 2033).
Integrated PACS systems connect ophthalmic imaging modalities with EHRs, hospital information systems, reporting tools, clinical workflows, and patient records, making them important for hospitals, large eye-care networks, and multi-site providers. These systems support centralized access, interoperability, collaborative diagnosis, teleophthalmology, and longitudinal tracking across multiple devices. Standalone PACS platforms focus specifically on ophthalmic image storage, retrieval, and management, offering simpler deployment and dedicated functionality. They remain relevant for specialty clinics, diagnostic imaging centers, and independent practices seeking focused ophthalmic imaging management without broad enterprise integration.
End-use Outlook
The Global Ophthalmology PACS Market, by end-use, is segmented into Hospital, Specialty Clinics, and Other End-use. The Hospital market dominated the Global Ophthalmology PACS Market by End-use in 2025, and would continue to be a dominant market till 2033; thereby, achieving a market value of USD 149.3 million by 2033, growing at a CAGR of 8 % during the forecast period. The Specialty Clinics market is expected to witness a CAGR of 8.6% during (2026 - 2033).
Hospitals require robust PACS platforms to manage large imaging volumes, integrate with EMRs, support multidisciplinary care, and maintain regulatory compliance across ophthalmology departments. Specialty Clinics prioritize user-friendly, ophthalmology-specific systems that support retina, glaucoma, cornea, pediatric ophthalmology, and outpatient diagnostic workflows. Other End-use includes diagnostic imaging centers, research institutions, academic hospitals, ambulatory settings, and telemedicine providers using PACS for large datasets, screening programs, teaching, and collaborative analysis. Each end-use group values secure access, workflow efficiency, imaging compatibility, and reliable data management.
Mode of Action Outlook
The Global Ophthalmology PACS Market, by mode of action, is segmented into Cloud-based and On-premises. The Cloud-based market dominated the Global Ophthalmology PACS Market by Mode of Action in 2025, and would continue to be a dominant market till 2033; thereby, achieving a market value of USD 194.3 million by 2033, growing at a CAGR of 8.5 % during the forecast period. Additionally, The On-premises market is expected to witness highest CAGR of 8.2% during (2026 - 2033).
Cloud-based PACS platforms support remote access, scalable image storage, multi-site collaboration, teleophthalmology, subscription-based deployment, and easier software updates. They are increasingly adopted by clinics, imaging centers, and healthcare networks seeking flexible access to ophthalmic images across locations. On-premises PACS remains important for hospitals, academic centers, and institutions requiring local infrastructure control, customized integration, low-latency image access, and direct governance over imaging data. Deployment choice depends on infrastructure maturity, cybersecurity policy, data sovereignty, budget model, and clinical workflow requirements.
Free Valuable Insights: Ophthalmology PACS Market Size to reach $329.1 Million by 2033
Regional Outlook
Region-wise, the Ophthalmology PACS Market is analyzed across North America, Europe, Asia Pacific, and LAMEA. The North America market dominated the Global Ophthalmology PACS Market by Region in 2025, and would continue to be a dominant market till 2033; thereby, achieving a market value of USD 138.7 million by 2033, growing at a CAGR of 7.8 % during the forecast period. The Asia Pacific market is expected to witness a CAGR of 9.4% during (2026 - 2033). Additionally, The Europe market is expected to witness a CAGR of 8.2% during (2026 - 2033).
North America benefits from advanced healthcare IT infrastructure, enterprise imaging adoption, AI-enabled diagnostics, teleophthalmology growth, and strong regulatory emphasis on secure data management. Europe is supported by hospital digitalization, GDPR-driven data governance, ophthalmic imaging integration, and growing use of enterprise imaging platforms. Asia Pacific is witnessing expansion through healthcare digitization, rising eye disease burden, teleophthalmology needs, cloud deployment, and increasing investment in advanced eye-care infrastructure. LAMEA is developing through healthcare modernization, private hospital expansion, telemedicine adoption, cloud-based access, and growing demand for ophthalmic diagnostic imaging management.
| Report Attribute | Details |
|---|---|
| Market size value in 2026 | USD 186.8 million |
| Market size forecast in 2033 | USD 329.1 million |
| Base Year | 2025 |
| Historical Period | 2022 to 2024 |
| Forecast Period | 2026 to 2033 |
| Revenue Growth Rate | CAGR of 8.4% from 2026 to 2033 |
| Number of Pages | XX |
| Tables | XX |
| Report Coverage | Market Trends, Revenue Estimation and Forecast, Segmentation Analysis, Regional and Country Breakdown, Competitive Landscape, Market Share Analysis, Company Profiling, Companies Strategic Developments, SWOT Analysis, Product Life Cycle Analysis, Value Chain Analysis, Market Consolidation Analysis, Key Customer Criteria, Pandemic Impact Analysis, and Winning Imperatives |
| Segments Covered | Type, End-use, Mode of Action, and Geography |
| Country Scope |
|
| Companies Included | Carl Zeiss Meditec AG; Topcon Healthcare; Heidelberg Engineering; Optos plc; Haag-Streit Group; NIDEK Co., Ltd.; Sectra AB; INFINITT Healthcare Co., Ltd.; Sonomed Escalon; EyePACS, LLC |
Recent Strategies Deployed in the Market
- 2026-July: Sectra’s ophthalmology solution went live at Dayton Children’s Hospital, extending the hospital’s enterprise imaging environment beyond radiology and consolidating ophthalmology images from multiple modalities.
- 2026-February: ZEISS launched Collaborative Care, a browser-based application for secure ophthalmic data sharing, referrals, and real-time clinical coordination, operating as a standalone cloud application or integrated extension of ZEISS FORUM.
- 2026-February: Topcon Healthcare opened THINC EMEA in London, supporting regional engagement around connected eye-care technologies, digital ophthalmology workflows, AI, and clinical collaboration.
- 2026-January: Sectra signed an agreement with TUM Klinikum Rechts der Isar to add ophthalmology and pathology modules to its enterprise imaging deployment, supporting up to 300,000 examinations annually.
- 2025-November: Optain Health acquired EyePACS, combining AI-enabled retinal imaging with an established teleophthalmology infrastructure supporting distributed retinal screening workflows.
- 2025-September: ZEISS expanded its FORUM-connected ophthalmic workflow with VISULYZE 1.2 integration, supporting connected diagnostic workflows and treatment planning.
- 2025-September: NIDEK launched GS Viewer for NAVIS-EX ophthalmic image filing software, extending centralized image management to Gonioscope GS-1 data and longitudinal image comparison.
- 2025-August: Topcon Healthcare acquired Intelligent Retinal Imaging Systems, strengthening its connected retinal-care infrastructure across primary care and specialist eye care.
- 2025-May: Topcon Healthcare acquired RetInSight GmbH, expanding AI-powered ophthalmic image analysis capabilities and supporting integration with connected screening equipment and digital platforms.
- 2025-April: ZEISS launched the Research Data Platform, a cloud-based AI-driven environment for integrating ophthalmic imaging and clinical data for research workflows.
- 2025-April: Sectra announced a cloud enterprise imaging agreement with a major U.S. cancer center, including ophthalmology alongside radiology, breast imaging, cardiology, and pathology.
List of Key Companies Profiled
- Carl Zeiss Meditec AG
- Topcon Healthcare
- Heidelberg Engineering
- Optos plc
- Haag-Streit Group
- NIDEK Co., Ltd.
- Sectra AB
- INFINITT Healthcare Co., Ltd.
- Sonomed Escalon
- EyePACS, LLC
Ophthalmology PACS Market Report Segmentation
By Type
- Integrated
- Standalone
By End-use
- Hospital
- Specialty Clinics
- Other End-use
By Mode of Action
- Cloud-based
- On-premises
By Geography
- North America
- US
- Canada
- Mexico
- Rest of North America
- Europe
- Germany
- UK
- France
- Russia
- Spain
- Italy
- Rest of Europe
- Asia Pacific
- China
- Japan
- India
- South Korea
- Singapore
- Malaysia
- Rest of Asia Pacific
- LAMEA
- Brazil
- Argentina
- UAE
- Saudi Arabia
- South Africa
- Nigeria
- Rest of LAMEA
1.1 Market Definition
1.2 Analysis Period & Currency
1.3 Segmentation
1.4 Ophthalmology PACS Market, by Geography
1.5 Research Methodology
Chapter 2. Market Overview
2.1 COVID-19 Impact
2.2 Market Composition and Scenario
Chapter 3. Key Factors Impacting Market
3.1 Market Drivers
3.2 Market Restraints
3.3 Market Opportunities
3.4 Market Challenges
3.5 Market Trends
3.6 State of Competition
3.7 Market Consolidation
3.8 Key Customer Criteria
Chapter 4. Product Life Cycle
Chapter 5. Value Chain Analysis of Ophthalmology PACS Market
Chapter 6. Competition Analysis - Global
6.1 Market Share Analysis
6.2 Recent Developments
6.2.1 Mergers & Acquisitions
6.2.2 Product Launch & Product Expansion
6.2.3 Partnership, Collaboration & Agreements
6.2.4 Geographical Expansion
Chapter 7. Segmentation By Type
7.1 Integrated
7.2 Standalone
Chapter 8. Segmentation By End-use
8.1 Hospital
8.2 Specialty Clinics
8.3 Other End-use
Chapter 9. Segmentation By Mode of Action
9.1 Cloud-based
9.2 On-premises
Chapter 10. North America Market
10.1 Market Overview
10.2 Key Factors Impacting Market
10.2.1 Market Drivers
10.2.2 Market Restraints
10.2.3 Market Opportunities
10.2.4 Market Challenges
10.2.5 Market Trends
10.2.6 State of Competition
10.2.7 Market Consolidation
10.2.8 Key Customer Criteria
10.3 Product Life Cycle
10.4 Segmentation By Type
10.4.1 Integrated
10.4.2 Standalone
10.5 Segmentation By End-use
10.5.1 Hospitals
10.5.2 Specialty Clinics
10.5.3 Other End-use
10.6 Segmentation By Mode of Action
10.6.1 Cloud-based
10.6.2 On-premises
10.7 Segmentation By Country
10.7.1 US
10.7.1.1 Segmentation By Type
10.7.1.1.1 Integrated
10.7.1.1.2 Standalone
10.7.1.2 Segmentation By End-use
10.7.1.2.1 Hospitals
10.7.1.2.2 Specialty Clinics
10.7.1.2.3 Other End-use
10.7.1.3 Segmentation By Mode of Action
10.7.1.3.1 Cloud-based
10.7.1.3.2 On-premises
10.7.2 Canada
10.7.2.1 Segmentation By Type
10.7.2.1.1 Integrated
10.7.2.1.2 Standalone
10.7.2.2 Segmentation By End-use
10.7.2.2.1 Hospitals
10.7.2.2.2 Specialty Clinics
10.7.2.2.3 Other End-use
10.7.2.3 Segmentation By Mode of Action
10.7.2.3.1 Cloud-based
10.7.2.3.2 On-premises
10.7.3 Mexico
10.7.3.1 Segmentation By Type
10.7.3.1.1 Integrated
10.7.3.1.2 Standalone
10.7.3.2 Segmentation By End-use
10.7.3.2.1 Hospitals
10.7.3.2.2 Specialty Clinics
10.7.3.2.3 Other End-use
10.7.3.3 Segmentation By Mode of Action
10.7.3.3.1 Cloud-based
10.7.3.3.2 On-premises
10.7.4 Rest of North America
10.7.4.1 Segmentation By Type
10.7.4.1.1 Integrated
10.7.4.1.2 Standalone
10.7.4.2 Segmentation By End-use
10.7.4.2.1 Hospitals
10.7.4.2.2 Specialty Clinics
10.7.4.2.3 Other End-use
10.7.4.3 Segmentation By Mode of Action
10.7.4.3.1 Cloud-based
10.7.4.3.2 On-premises
Chapter 11. Europe Market
11.1 Market Overview
11.2 Key Factors Impacting Market
11.2.1 Market Drivers
11.2.2 Market Restraints
11.2.3 Market Opportunities
11.2.4 Market Challenges
11.2.5 Market Trends
11.2.6 State of Competition
11.2.7 Market Consolidation
11.2.8 Key Customer Criteria
11.3 Product Life Cycle
11.4 Segmentation By Type
11.4.1 Integrated
11.4.2 Standalone
11.5 Segmentation By End-use
11.5.1 Hospital
11.5.2 Specialty Clinics
11.5.3 Other End-use
11.6 Segmentation By Mode of Action
11.6.1 Cloud-based
11.6.2 On-premises
11.7 Segmentation By Country
11.7.1 Germany
11.7.1.1 Segmentation By Type
11.7.1.1.1 Integrated
11.7.1.1.2 Standalone
11.7.1.2 Segmentation By End-use
11.7.1.2.1 Hospitals
11.7.1.2.2 Specialty Clinics
11.7.1.2.3 Other End-use
11.7.1.3 Segmentation By Mode of Action
11.7.1.3.1 Cloud-based
11.7.1.3.2 On-premises
11.7.2 UK
11.7.2.1 Segmentation By Type
11.7.2.1.1 Integrated
11.7.2.1.2 Standalone
11.7.2.2 Segmentation By End-use
11.7.2.2.1 Hospitals
11.7.2.2.2 Specialty Clinics
11.7.2.2.3 Other End-use
11.7.2.3 Segmentation By Mode of Action
11.7.2.3.1 Cloud-based
11.7.2.3.2 On-premises
11.7.3 France
11.7.3.1 Segmentation By Type
11.7.3.1.1 Integrated
11.7.3.1.2 Standalone
11.7.3.2 Segmentation By End-use
11.7.3.2.1 Hospitals
11.7.3.2.2 Specialty Clinics
11.7.3.2.3 Other End-use
11.7.3.3 Segmentation By Mode of Action
11.7.3.3.1 Cloud-based
11.7.3.3.2 On-premises
11.7.4 Russia
11.7.4.1 Segmentation By Type
11.7.4.1.1 Integrated
11.7.4.1.2 Standalone
11.7.4.2 Segmentation By End-use
11.7.4.2.1 Hospitals
11.7.4.2.2 Specialty Clinics
11.7.4.2.3 Other End-use
11.7.4.3 Segmentation By Mode of Action
11.7.4.3.1 Cloud-based
11.7.4.3.2 On-premises
11.7.5 Spain
11.7.5.1 Segmentation By Type
11.7.5.1.1 Integrated
11.7.5.1.2 Standalone
11.7.5.2 Segmentation By End-use
11.7.5.2.1 Hospitals
11.7.5.2.2 Specialty Clinics
11.7.5.2.3 Other End-use
11.7.5.3 Segmentation By Mode of Action
11.7.5.3.1 Cloud-based
11.7.5.3.2 On-premises
11.7.6 Italy
11.7.6.1 Segmentation By Type
11.7.6.1.1 Integrated
11.7.6.1.2 Standalone
11.7.6.2 Segmentation By End-use
11.7.6.2.1 Hospitals
11.7.6.2.2 Specialty Clinics
11.7.6.2.3 Other End-use
11.7.6.3 Segmentation By Mode of Action
11.7.6.3.1 Cloud-based
11.7.6.3.2 On-premises
11.7.7 Rest of Europe
11.7.7.1 Segmentation By Type
11.7.7.1.1 Integrated
11.7.7.1.2 Standalone
11.7.7.2 Segmentation By End-use
11.7.7.2.1 Hospitals
11.7.7.2.2 Specialty Clinics
11.7.7.2.3 Other End-use
11.7.7.3 Segmentation By Mode of Action
11.7.7.3.1 Cloud-based
11.7.7.3.2 On-premises
Chapter 12. Asia Pacific Market
12.1 Market Overview
12.2 Key Factors Impacting Market
12.2.1 Market Drivers
12.2.2 Market Restraints
12.2.3 Market Opportunities
12.2.4 Market Challenges
12.2.5 Market Trends
12.2.6 State of Competition
12.2.7 Market Consolidation
12.2.8 Key Customer Criteria
12.3 Product Life Cycle
12.4 Segmentation By Type
12.4.1 Integrated
12.4.2 Standalone
12.5 Segmentation By End-use
12.5.1 Hospitals
12.5.2 Specialty Clinics
12.5.3 Other End-use
12.6 Segmentation By Mode of Action
12.6.1 Cloud-based
12.6.2 On-premises
12.7 Segmentation By Country
12.7.1 China
12.7.1.1 Segmentation By Type
12.7.1.1.1 Integrated
12.7.1.1.2 Standalone
12.7.1.2 Segmentation By End-use
12.7.1.2.1 Hospitals
12.7.1.2.2 Specialty Clinics 12.7.1.2.3 Other End-use
12.7.1.3 Segmentation By Mode of Action
12.7.1.3.1 Cloud-based
12.7.1.3.2 On-premises
12.7.2 Japan
12.7.2.1 Segmentation By Type
12.7.2.1.1 Integrated
12.7.2.1.2 Standalone
12.7.2.2 Segmentation By End-use
12.7.2.2.1 Hospitals
12.7.2.2.2 Specialty Clinics
12.7.2.2.3 Other End-use
12.7.2.3 Segmentation By Mode of Action
12.7.2.3.1 Cloud-based
12.7.2.3.2 On-premises
12.7.3 India
12.7.3.1 Segmentation By Type
12.7.3.1.1 Integrated
12.7.3.1.2 Standalone
12.7.3.2 Segmentation By End-use
12.7.3.2.1 Hospitals
12.7.3.2.2 Specialty Clinics
12.7.3.2.3 Other End-use
12.7.3.3 Segmentation By Mode of Action
12.7.3.3.1 Cloud-based
12.7.3.3.2 On-premises
12.7.4 South Korea
12.7.4.1 Segmentation By Type
12.7.4.1.1 Integrated
12.7.4.1.2 Standalone
12.7.4.2 Segmentation By End-use
12.7.4.2.1 Hospitals
12.7.4.2.2 Specialty Clinics
12.7.4.2.3 Other End-use
12.7.4.3 Segmentation By Mode of Action
12.7.4.3.1 Cloud-based
12.7.4.3.2 On-premises
12.7.5 Singapore
12.7.5.1 Segmentation By Type
12.7.5.1.1 Integrated
12.7.5.1.2 Standalone
12.7.5.2 Segmentation By End-use
12.7.5.2.1 Hospitals
12.7.5.2.2 Specialty Clinics
12.7.5.2.3 Other End-use
12.7.5.3 Segmentation By Mode of Action
12.7.5.3.1 Cloud-based
12.7.5.3.2 On-premises
12.7.6 Malaysia
12.7.6.1 Segmentation By Type
12.7.6.1.1 Integrated
12.7.6.1.2 Standalone
12.7.6.2 Segmentation By End-use
12.7.6.2.1 Hospitals
12.7.6.2.2 Specialty Clinics
12.7.6.2.3 Other End-use
12.7.6.3 Segmentation By Mode of Action
12.7.6.3.1 Cloud-based
12.7.6.3.2 On-premises
12.7.7 Rest of Asia Pacific
12.7.7.1 Segmentation By Type
12.7.7.1.1 Integrated
12.7.7.1.2 Standalone
12.7.7.2 Segmentation By End-use
12.7.7.2.1 Hospitals
12.7.7.2.2 Specialty Clinics
12.7.7.2.3 Other End-use
12.7.7.3 Segmentation By Mode of Action
12.7.7.3.1 Cloud-based
12.7.7.3.2 On-premises
Chapter 13. LAMEA Market
13.1 Market Overview
13.2 Key Factors Impacting Market
13.2.1 Market Drivers
13.2.2 Market Restraints
13.2.3 Market Opportunities
13.2.4 Market Challenges
13.2.5 Market Trends
13.2.6 State of Competition
13.2.7 Market Consolidation
13.2.8 Key Customer Criteria
13.3 Product Life Cycle
13.4 Segmentation By Type
13.4.1 Integrated
13.4.2 Standalone
13.5 Segmentation By End-use
13.5.1 Hospitals
13.5.2 Specialty Clinics
13.5.3 Other End-use
13.6 Segmentation By Mode of Action
13.6.1 Cloud-based
13.6.2 On-premises
13.7 Segmentation By Country
13.7.1 Brazil
13.7.1.1 Segmentation By Type
13.7.1.1.1 Integrated
13.7.1.1.2 Standalone
13.7.1.2 Segmentation By End-use
13.7.1.2.1 Hospitals
13.7.1.2.2 Specialty Clinics
13.7.1.2.3 Other End-use
13.7.1.3 Segmentation By Mode of Action
13.7.1.3.1 Cloud-based
13.7.1.3.2 On-premises
13.7.2 Argentina
13.7.2.1 Segmentation By Type
13.7.2.1.1 Integrated
13.7.2.1.2 Standalone
13.7.2.2 Segmentation By End-use
13.7.2.2.1 Hospitals
13.7.2.2.2 Specialty Clinics
13.7.2.2.3 Other End-use
13.7.2.3 Segmentation By Mode of Action
13.7.2.3.1 Cloud-based
13.7.2.3.2 On-premises
13.7.3 UAE
13.7.3.1 Segmentation By Type
13.7.3.1.1 Integrated
13.7.3.1.2 Standalone
13.7.3.2 Segmentation By End-use
13.7.3.2.1 Hospitals
13.7.3.2.2 Specialty Clinics
13.7.3.2.3 Other End-use
13.7.3.3 Segmentation By Mode of Action
13.7.3.3.1 Cloud-based
13.7.3.3.2 On-premises
13.7.4 Saudi Arabia
13.7.4.1 Segmentation By Type
13.7.4.1.1 Integrated
13.7.4.1.2 Standalone
13.7.4.2 Segmentation By End-use
13.7.4.2.1 Hospitals
13.7.4.2.2 Specialty Clinics
13.7.4.2.3 Other End-use
13.7.4.3 Segmentation By Mode of Action
13.7.4.3.1 Cloud-based
13.7.4.3.2 On-premises
13.7.5 South Africa
13.7.5.1 Segmentation By Type
13.7.5.1.1 Integrated
13.7.5.1.2 Standalone
13.7.5.2 Segmentation By End-use
13.7.5.2.1 Hospitals
13.7.5.2.2 Specialty Clinics
13.7.5.2.3 Other End-use
13.7.5.3 Segmentation By Mode of Action
13.7.5.3.1 Cloud-based
13.7.5.3.2 On-premises
13.7.6 Nigeria
13.7.6.1 Segmentation By Type
13.7.6.1.1 Integrated
13.7.6.1.2 Standalone
13.7.6.2 Segmentation By End-use
13.7.6.2.1 Hospitals
13.7.6.2.2 Specialty Clinics
13.7.6.2.3 Other End-use
13.7.6.3 Segmentation By Mode of Action
13.7.6.3.1 Cloud-based
13.7.6.3.2 On-premises
13.7.7 Rest of LAMEA
13.7.7.1 Segmentation By Type
13.7.7.1.1 Integrated
13.7.7.1.2 Standalone
13.7.7.2 Segmentation By End-use
13.7.7.2.1 Hospitals
13.7.7.2.2 Specialty Clinics
13.7.7.2.3 Other End-use
13.7.7.3 Segmentation By Mode of Action
13.7.7.3.1 Cloud-based
13.7.7.3.2 On-premises
Chapter 14. Company Snapshots
14.1 Carl Zeiss Meditec AG
14.1.1 Business Overview
14.1.2 Key Information
14.1.3 Company Focus on Ophthalmology PACS Market
14.1.4 Strategic Insights
14.1.5 Strategy Deployed
14.1.6 Product & Service Portfolio
14.1.7 Capability Overview
14.1.8 Technology & Innovation Focus
14.1.9 SWOT Analysis
14.1.10 Customers / End Users
14.1.11 Competitive Positioning
14.1.12 Key Differentiators
14.1.13 Portfolio Matrix
14.1.14 Analyst View
14.1.15 Future Outlook
14.2 Topcon Healthcare
14.2.1 Business Overview
14.2.2 Key Information
14.2.3 Company Focus on Ophthalmology PACS Market
14.2.4 Strategic Insights on Ophthalmology PACS Market
14.2.5 Strategy Deployed for Ophthalmology PACS Market
14.2.6 Product & Service Portfolio
14.2.7 Capability Overview
14.2.8 Technology & Innovation Focus
14.2.9 SWOT Analysis
14.2.10 Customers / End Users
14.2.11 Competitive Positioning
14.2.12 Key Differentiators
14.2.13 Portfolio Matrix
14.2.14 Analyst View
14.2.15 Future Outlook
14.3 Heidelberg Engineering
14.3.1 Business Overview
14.3.2 Key Information
14.3.3 Company Focus on Ophthalmology PACS Market
14.3.4 Strategic Insights
14.3.5 Strategy Deployed
14.3.6 Product & Service Portfolio
14.3.7 Capability Overview
14.3.8 Technology & Innovation Focus
14.3.9 SWOT Analysis
14.3.10 Customers / End Users
14.3.11 Competitive Positioning
14.3.12 Key Differentiators
14.3.13 Portfolio Matrix
14.3.14 Analyst View
14.3.15 Future Outlook
14.4 Optos plc
14.4.1 Business Overview
14.4.2 Key Information
14.4.3 Company Focus on Ophthalmology PACS Market
14.4.4 Strategic Insights
14.4.5 Strategy Deployed
14.4.6 Product & Service Portfolio
14.4.7 Capability Overview
14.4.8 Technology & Innovation Focus
14.4.9 SWOT Analysis
14.4.10 Customers / End Users
14.4.11 Competitive Positioning
14.4.12 Key Differentiators
14.4.13 Portfolio Matrix
14.4.14 Analyst View
14.4.15 Future Outlook
14.5 Haag-Streit Group
14.5.1 Business Overview
14.5.2 Key Information
14.5.3 Company Focus on Ophthalmology PACS Market
14.5.4 Strategic Insights
14.5.5 Strategy Deployed
14.5.6 Product & Service Portfolio
14.5.7 Capability Overview 14.5.8 Technology & Innovation Focus
14.5.9 SWOT Analysis
14.5.10 Customers / End Users
14.5.11 Competitive Positioning
14.5.12 Key Differentiators
14.5.13 Portfolio Matrix
14.5.14 Analyst View
14.5.15 Future Outlook
14.6 NIDEK Co., Ltd.
14.6.1 Business Overview
14.6.2 Key Information
14.6.3 Company Focus on Ophthalmology PACS Market
14.6.4 Strategic Insights
14.6.5 Strategy Deployed
14.6.6 Product & Service Portfolio
14.6.7 Capability Overview
14.6.8 Technology & Innovation Focus
14.6.9 SWOT Analysis
14.6.10 Customers / End Users
14.6.11 Competitive Positioning
14.6.12 Key Differentiators
14.6.13 Portfolio Matrix
14.6.14 Analyst View
14.6.15 Future Outlook
14.7 Sectra AB
14.7.1 Business Overview
14.7.2 Key Information
14.7.3 Company Focus on Ophthalmology PACS Market
14.7.4 Strategic Insights
14.7.5 Strategy Deployed
14.7.6 Product & Service Portfolio
14.7.7 Capability Overview
14.7.8 Technology & Innovation Focus
14.7.9 SWOT Analysis
14.7.10 Customers / End Users
14.7.11 Competitive Positioning
14.7.12 Key Differentiators
14.7.13 Portfolio Matrix
14.7.14 Analyst View
14.7.15 Future Outlook
14.8 INFINITT Healthcare Co., Ltd.
14.8.1 Business Overview
14.8.2 Key Information
14.8.3 Company Focus on Ophthalmology PACS Market
14.8.4 Strategic Insights
14.8.5 Strategy Deployed
14.8.6 Product & Service Portfolio
14.8.7 Capability Overview
14.8.8 Technology & Innovation Focus
14.8.9 SWOT Analysis
14.8.10 Customers / End Users
14.8.11 Competitive Positioning
14.8.12 Key Differentiators
14.8.13 Portfolio Matrix
14.8.14 Analyst View
14.8.15 Future Outlook
14.9 Sonomed Escalon
14.9.1 Business Overview
14.9.2 Key Information
14.9.3 Company Focus on Ophthalmology PACS Market
14.9.4 Strategic Insights
14.9.5 Strategy Deployed
14.9.6 Product & Service Portfolio
14.9.7 Capability Overview
14.9.8 Technology & Innovation Focus
14.9.9 SWOT Analysis
14.9.10 Customers / End Users
14.9.11 Competitive Positioning
14.9.12 Key Differentiators
14.9.13 Portfolio Matrix
14.9.14 Analyst View
14.9.15 Future Outlook
14.10 EyePACS, LLC
14.10.1 Business Overview
14.10.2 Key Information
14.10.3 Company Focus on Ophthalmology PACS Market
14.10.4 Strategic Insights
14.10.5 Strategy Deployed
14.10.6 Product & Service Portfolio
14.10.7 Capability Overview
14.10.8 Technology & Innovation Focus
14.10.9 SWOT Analysis
14.10.10 Customers / End Users
14.10.11 Competitive Positioning
14.10.12 Key Differentiators
14.10.13 Portfolio Matrix
14.10.14 Analyst View
14.10.15 Future Outlook
Chapter 15. Winning Imperatives of Ophthalmology PACS Market
Table 1 Global Ophthalmology PACS Market Market, 2022 - 2033, USD Million
Table 2 Global Ophthalmology PACS Market Market by End-use, 2022 - 2033, USD Million
Table 3 Global Hospital Market, 2022 - 2033, USD Million
Table 4 Global Other End-use Market, 2022 - 2033, USD Million
Table 5 Global Specialty Clinics Market, 2022 - 2033, USD Million
Table 6 Global Ophthalmology PACS Market Market by Mode of Action, 2022 - 2033, USD Million
Table 7 Global Cloud-based Market, 2022 - 2033, USD Million
Table 8 Global On-premises Market, 2022 - 2033, USD Million
Table 9 Global Ophthalmology PACS Market Market by Type, 2022 - 2033, USD Million
Table 10 Global Integrated Market, 2022 - 2033, USD Million
Table 11 Global Standalone Market, 2022 - 2033, USD Million
Table 12 North America Ophthalmology PACS Market Market, 2022 - 2033, USD Million
Table 13 North America Ophthalmology PACS Market Market by End-use, 2022 - 2033, USD Million
Table 14 North America Hospital Market, 2022 - 2033, USD Million
Table 15 North America Other End-use Market, 2022 - 2033, USD Million
Table 16 North America Specialty Clinics Market, 2022 - 2033, USD Million
Table 17 North America Ophthalmology PACS Market Market by Mode of Action, 2022 - 2033, USD Million
Table 18 North America Cloud-based Market, 2022 - 2033, USD Million
Table 19 North America On-premises Market, 2022 - 2033, USD Million
Table 20 North America Ophthalmology PACS Market Market by Type, 2022 - 2033, USD Million
Table 21 North America Integrated Market, 2022 - 2033, USD Million
Table 22 North America Standalone Market, 2022 - 2033, USD Million
Table 23 United States Ophthalmology PACS Market Market, 2022 - 2033, USD Million
Table 24 United States Ophthalmology PACS Market Market by End-use, 2022 - 2033, USD Million
Table 25 United States Hospital Market, 2022 - 2033, USD Million
Table 26 United States Other End-use Market, 2022 - 2033, USD Million
Table 27 United States Specialty Clinics Market, 2022 - 2033, USD Million
Table 28 United States Ophthalmology PACS Market Market by Mode of Action, 2022 - 2033, USD Million
Table 29 United States Cloud-based Market, 2022 - 2033, USD Million
Table 30 United States On-premises Market, 2022 - 2033, USD Million
Table 31 United States Ophthalmology PACS Market Market by Type, 2022 - 2033, USD Million
Table 32 United States Integrated Market, 2022 - 2033, USD Million
Table 33 United States Standalone Market, 2022 - 2033, USD Million
Table 34 Canada Ophthalmology PACS Market Market, 2022 - 2033, USD Million
Table 35 Canada Ophthalmology PACS Market Market by End-use, 2022 - 2033, USD Million
Table 36 Canada Hospital Market, 2022 - 2033, USD Million
Table 37 Canada Other End-use Market, 2022 - 2033, USD Million
Table 38 Canada Specialty Clinics Market, 2022 - 2033, USD Million
Table 39 Canada Ophthalmology PACS Market Market by Mode of Action, 2022 - 2033, USD Million
Table 40 Canada Cloud-based Market, 2022 - 2033, USD Million
Table 41 Canada On-premises Market, 2022 - 2033, USD Million
Table 42 Canada Ophthalmology PACS Market Market by Type, 2022 - 2033, USD Million
Table 43 Canada Integrated Market, 2022 - 2033, USD Million
Table 44 Canada Standalone Market, 2022 - 2033, USD Million
Table 45 Mexico Ophthalmology PACS Market Market, 2022 - 2033, USD Million
Table 46 Mexico Ophthalmology PACS Market Market by End-use, 2022 - 2033, USD Million
Table 47 Mexico Hospital Market, 2022 - 2033, USD Million
Table 48 Mexico Other End-use Market, 2022 - 2033, USD Million
Table 49 Mexico Specialty Clinics Market, 2022 - 2033, USD Million
Table 50 Mexico Ophthalmology PACS Market Market by Mode of Action, 2022 - 2033, USD Million
Table 51 Mexico Cloud-based Market, 2022 - 2033, USD Million
Table 52 Mexico On-premises Market, 2022 - 2033, USD Million
Table 53 Mexico Ophthalmology PACS Market Market by Type, 2022 - 2033, USD Million
Table 54 Mexico Integrated Market, 2022 - 2033, USD Million
Table 55 Mexico Standalone Market, 2022 - 2033, USD Million
Table 56 Rest of North America Ophthalmology PACS Market Market, 2022 - 2033, USD Million
Table 57 Rest of North America Ophthalmology PACS Market Market by End-use, 2022 - 2033, USD Million
Table 58 Rest of North America Hospital Market, 2022 - 2033, USD Million
Table 59 Rest of North America Other End-use Market, 2022 - 2033, USD Million
Table 60 Rest of North America Specialty Clinics Market, 2022 - 2033, USD Million
Table 61 Rest of North America Ophthalmology PACS Market Market by Mode of Action, 2022 - 2033, USD Million
Table 62 Rest of North America Cloud-based Market, 2022 - 2033, USD Million
Table 63 Rest of North America On-premises Market, 2022 - 2033, USD Million
Table 64 Rest of North America Ophthalmology PACS Market Market by Type, 2022 - 2033, USD Million
Table 65 Rest of North America Integrated Market, 2022 - 2033, USD Million
Table 66 Rest of North America Standalone Market, 2022 - 2033, USD Million
Table 67 Europe Ophthalmology PACS Market Market, 2022 - 2033, USD Million
Table 68 Europe Ophthalmology PACS Market Market by End-use, 2022 - 2033, USD Million
Table 69 Europe Hospital Market, 2022 - 2033, USD Million
Table 70 Europe Other End-use Market, 2022 - 2033, USD Million
Table 71 Europe Specialty Clinics Market, 2022 - 2033, USD Million
Table 72 Europe Ophthalmology PACS Market Market by Mode of Action, 2022 - 2033, USD Million
Table 73 Europe Cloud-based Market, 2022 - 2033, USD Million
Table 74 Europe On-premises Market, 2022 - 2033, USD Million
Table 75 Europe Ophthalmology PACS Market Market by Type, 2022 - 2033, USD Million
Table 76 Europe Integrated Market, 2022 - 2033, USD Million
Table 77 Europe Standalone Market, 2022 - 2033, USD Million
Table 78 Germany Ophthalmology PACS Market Market, 2022 - 2033, USD Million
Table 79 Germany Ophthalmology PACS Market Market by End-use, 2022 - 2033, USD Million
Table 80 Germany Hospital Market, 2022 - 2033, USD Million
Table 81 Germany Other End-use Market, 2022 - 2033, USD Million
Table 82 Germany Specialty Clinics Market, 2022 - 2033, USD Million
Table 83 Germany Ophthalmology PACS Market Market by Mode of Action, 2022 - 2033, USD Million
Table 84 Germany Cloud-based Market, 2022 - 2033, USD Million
Table 85 Germany On-premises Market, 2022 - 2033, USD Million
Table 86 Germany Ophthalmology PACS Market Market by Type, 2022 - 2033, USD Million
Table 87 Germany Integrated Market, 2022 - 2033, USD Million
Table 88 Germany Standalone Market, 2022 - 2033, USD Million
Table 89 United Kingdom Ophthalmology PACS Market Market, 2022 - 2033, USD Million
Table 90 United Kingdom Ophthalmology PACS Market Market by End-use, 2022 - 2033, USD Million
Table 91 United Kingdom Hospital Market, 2022 - 2033, USD Million
Table 92 United Kingdom Other End-use Market, 2022 - 2033, USD Million
Table 93 United Kingdom Specialty Clinics Market, 2022 - 2033, USD Million
Table 94 United Kingdom Ophthalmology PACS Market Market by Mode of Action, 2022 - 2033, USD Million
Table 95 United Kingdom Cloud-based Market, 2022 - 2033, USD Million
Table 96 United Kingdom On-premises Market, 2022 - 2033, USD Million
Table 97 United Kingdom Ophthalmology PACS Market Market by Type, 2022 - 2033, USD Million
Table 98 United Kingdom Integrated Market, 2022 - 2033, USD Million
Table 99 United Kingdom Standalone Market, 2022 - 2033, USD Million
Table 100 France Ophthalmology PACS Market Market, 2022 - 2033, USD Million
Table 101 France Ophthalmology PACS Market Market by End-use, 2022 - 2033, USD Million
Table 102 France Hospital Market, 2022 - 2033, USD Million
Table 103 France Other End-use Market, 2022 - 2033, USD Million
Table 104 France Specialty Clinics Market, 2022 - 2033, USD Million
Table 105 France Ophthalmology PACS Market Market by Mode of Action, 2022 - 2033, USD Million
Table 106 France Cloud-based Market, 2022 - 2033, USD Million
Table 107 France On-premises Market, 2022 - 2033, USD Million
Table 108 France Ophthalmology PACS Market Market by Type, 2022 - 2033, USD Million
Table 109 France Integrated Market, 2022 - 2033, USD Million
Table 110 France Standalone Market, 2022 - 2033, USD Million
Table 111 Russia Ophthalmology PACS Market Market, 2022 - 2033, USD Million
Table 112 Russia Ophthalmology PACS Market Market by End-use, 2022 - 2033, USD Million
Table 113 Russia Hospital Market, 2022 - 2033, USD Million
Table 114 Russia Other End-use Market, 2022 - 2033, USD Million
Table 115 Russia Specialty Clinics Market, 2022 - 2033, USD Million
Table 116 Russia Ophthalmology PACS Market Market by Mode of Action, 2022 - 2033, USD Million
Table 117 Russia Cloud-based Market, 2022 - 2033, USD Million
Table 118 Russia On-premises Market, 2022 - 2033, USD Million
Table 119 Russia Ophthalmology PACS Market Market by Type, 2022 - 2033, USD Million
Table 120 Russia Integrated Market, 2022 - 2033, USD Million
Table 121 Russia Standalone Market, 2022 - 2033, USD Million
Table 122 Spain Ophthalmology PACS Market Market, 2022 - 2033, USD Million
Table 123 Spain Ophthalmology PACS Market Market by End-use, 2022 - 2033, USD Million
Table 124 Spain Hospital Market, 2022 - 2033, USD Million
Table 125 Spain Other End-use Market, 2022 - 2033, USD Million
Table 126 Spain Specialty Clinics Market, 2022 - 2033, USD Million
Table 127 Spain Ophthalmology PACS Market Market by Mode of Action, 2022 - 2033, USD Million
Table 128 Spain Cloud-based Market, 2022 - 2033, USD Million
Table 129 Spain On-premises Market, 2022 - 2033, USD Million
Table 130 Spain Ophthalmology PACS Market Market by Type, 2022 - 2033, USD Million
Table 131 Spain Integrated Market, 2022 - 2033, USD Million
Table 132 Spain Standalone Market, 2022 - 2033, USD Million
Table 133 Italy Ophthalmology PACS Market Market, 2022 - 2033, USD Million
Table 134 Italy Ophthalmology PACS Market Market by End-use, 2022 - 2033, USD Million
Table 135 Italy Hospital Market, 2022 - 2033, USD Million
Table 136 Italy Other End-use Market, 2022 - 2033, USD Million
Table 137 Italy Specialty Clinics Market, 2022 - 2033, USD Million
Table 138 Italy Ophthalmology PACS Market Market by Mode of Action, 2022 - 2033, USD Million
Table 139 Italy Cloud-based Market, 2022 - 2033, USD Million
Table 140 Italy On-premises Market, 2022 - 2033, USD Million
Table 141 Italy Ophthalmology PACS Market Market by Type, 2022 - 2033, USD Million
Table 142 Italy Integrated Market, 2022 - 2033, USD Million
Table 143 Italy Standalone Market, 2022 - 2033, USD Million
Table 144 Rest of Europe Ophthalmology PACS Market Market, 2022 - 2033, USD Million
Table 145 Rest of Europe Ophthalmology PACS Market Market by End-use, 2022 - 2033, USD Million
Table 146 Rest of Europe Hospital Market, 2022 - 2033, USD Million
Table 147 Rest of Europe Other End-use Market, 2022 - 2033, USD Million
Table 148 Rest of Europe Specialty Clinics Market, 2022 - 2033, USD Million
Table 149 Rest of Europe Ophthalmology PACS Market Market by Mode of Action, 2022 - 2033, USD Million
Table 150 Rest of Europe Cloud-based Market, 2022 - 2033, USD Million
Table 151 Rest of Europe On-premises Market, 2022 - 2033, USD Million
Table 152 Rest of Europe Ophthalmology PACS Market Market by Type, 2022 - 2033, USD Million
Table 153 Rest of Europe Integrated Market, 2022 - 2033, USD Million
Table 154 Rest of Europe Standalone Market, 2022 - 2033, USD Million
Table 155 Asia Pacific Ophthalmology PACS Market Market, 2022 - 2033, USD Million
Table 156 Asia Pacific Ophthalmology PACS Market Market by End-use, 2022 - 2033, USD Million
Table 157 Asia Pacific Hospital Market, 2022 - 2033, USD Million
Table 158 Asia Pacific Other End-use Market, 2022 - 2033, USD Million
Table 159 Asia Pacific Specialty Clinics Market, 2022 - 2033, USD Million
Table 160 Asia Pacific Ophthalmology PACS Market Market by Mode of Action, 2022 - 2033, USD Million
Table 161 Asia Pacific Cloud-based Market, 2022 - 2033, USD Million
Table 162 Asia Pacific On-premises Market, 2022 - 2033, USD Million
Table 163 Asia Pacific Ophthalmology PACS Market Market by Type, 2022 - 2033, USD Million
Table 164 Asia Pacific Integrated Market, 2022 - 2033, USD Million
Table 165 Asia Pacific Standalone Market, 2022 - 2033, USD Million
Table 166 China Ophthalmology PACS Market Market, 2022 - 2033, USD Million
Table 167 China Ophthalmology PACS Market Market by End-use, 2022 - 2033, USD Million
Table 168 China Hospital Market, 2022 - 2033, USD Million
Table 169 China Other End-use Market, 2022 - 2033, USD Million
Table 170 China Specialty Clinics Market, 2022 - 2033, USD Million
Table 171 China Ophthalmology PACS Market Market by Mode of Action, 2022 - 2033, USD Million
Table 172 China Cloud-based Market, 2022 - 2033, USD Million
Table 173 China On-premises Market, 2022 - 2033, USD Million
Table 174 China Ophthalmology PACS Market Market by Type, 2022 - 2033, USD Million
Table 175 China Integrated Market, 2022 - 2033, USD Million
Table 176 China Standalone Market, 2022 - 2033, USD Million
Table 177 Japan Ophthalmology PACS Market Market, 2022 - 2033, USD Million
Table 178 Japan Ophthalmology PACS Market Market by End-use, 2022 - 2033, USD Million
Table 179 Japan Hospital Market, 2022 - 2033, USD Million
Table 180 Japan Other End-use Market, 2022 - 2033, USD Million
Table 181 Japan Specialty Clinics Market, 2022 - 2033, USD Million
Table 182 Japan Ophthalmology PACS Market Market by Mode of Action, 2022 - 2033, USD Million
Table 183 Japan Cloud-based Market, 2022 - 2033, USD Million
Table 184 Japan On-premises Market, 2022 - 2033, USD Million
Table 185 Japan Ophthalmology PACS Market Market by Type, 2022 - 2033, USD Million
Table 186 Japan Integrated Market, 2022 - 2033, USD Million
Table 187 Japan Standalone Market, 2022 - 2033, USD Million
Table 188 India Ophthalmology PACS Market Market, 2022 - 2033, USD Million
Table 189 India Ophthalmology PACS Market Market by End-use, 2022 - 2033, USD Million
Table 190 India Hospital Market, 2022 - 2033, USD Million
Table 191 India Other End-use Market, 2022 - 2033, USD Million
Table 192 India Specialty Clinics Market, 2022 - 2033, USD Million
Table 193 India Ophthalmology PACS Market Market by Mode of Action, 2022 - 2033, USD Million
Table 194 India Cloud-based Market, 2022 - 2033, USD Million
Table 195 India On-premises Market, 2022 - 2033, USD Million
Table 196 India Ophthalmology PACS Market Market by Type, 2022 - 2033, USD Million
Table 197 India Integrated Market, 2022 - 2033, USD Million
Table 198 India Standalone Market, 2022 - 2033, USD Million
Table 199 South Korea Ophthalmology PACS Market Market, 2022 - 2033, USD Million
Table 200 South Korea Ophthalmology PACS Market Market by End-use, 2022 - 2033, USD Million
Table 201 South Korea Hospital Market, 2022 - 2033, USD Million
Table 202 South Korea Other End-use Market, 2022 - 2033, USD Million
Table 203 South Korea Specialty Clinics Market, 2022 - 2033, USD Million
Table 204 South Korea Ophthalmology PACS Market Market by Mode of Action, 2022 - 2033, USD Million
Table 205 South Korea Cloud-based Market, 2022 - 2033, USD Million
Table 206 South Korea On-premises Market, 2022 - 2033, USD Million
Table 207 South Korea Ophthalmology PACS Market Market by Type, 2022 - 2033, USD Million
Table 208 South Korea Integrated Market, 2022 - 2033, USD Million
Table 209 South Korea Standalone Market, 2022 - 2033, USD Million
Table 210 Singapore Ophthalmology PACS Market Market, 2022 - 2033, USD Million
Table 211 Singapore Ophthalmology PACS Market Market by End-use, 2022 - 2033, USD Million
Table 212 Singapore Hospital Market, 2022 - 2033, USD Million
Table 213 Singapore Other End-use Market, 2022 - 2033, USD Million
Table 214 Singapore Specialty Clinics Market, 2022 - 2033, USD Million
Table 215 Singapore Ophthalmology PACS Market Market by Mode of Action, 2022 - 2033, USD Million
Table 216 Singapore Cloud-based Market, 2022 - 2033, USD Million
Table 217 Singapore On-premises Market, 2022 - 2033, USD Million
Table 218 Singapore Ophthalmology PACS Market Market by Type, 2022 - 2033, USD Million
Table 219 Singapore Integrated Market, 2022 - 2033, USD Million
Table 220 Singapore Standalone Market, 2022 - 2033, USD Million
Table 221 Malaysia Ophthalmology PACS Market Market, 2022 - 2033, USD Million
Table 222 Malaysia Ophthalmology PACS Market Market by End-use, 2022 - 2033, USD Million
Table 223 Malaysia Hospital Market, 2022 - 2033, USD Million
Table 224 Malaysia Other End-use Market, 2022 - 2033, USD Million
Table 225 Malaysia Specialty Clinics Market, 2022 - 2033, USD Million
Table 226 Malaysia Ophthalmology PACS Market Market by Mode of Action, 2022 - 2033, USD Million
Table 227 Malaysia Cloud-based Market, 2022 - 2033, USD Million
Table 228 Malaysia On-premises Market, 2022 - 2033, USD Million
Table 229 Malaysia Ophthalmology PACS Market Market by Type, 2022 - 2033, USD Million
Table 230 Malaysia Integrated Market, 2022 - 2033, USD Million
Table 231 Malaysia Standalone Market, 2022 - 2033, USD Million
Table 232 Rest of Asia Pacific Ophthalmology PACS Market Market, 2022 - 2033, USD Million
Table 233 Rest of Asia Pacific Ophthalmology PACS Market Market by End-use, 2022 - 2033, USD Million
Table 234 Rest of Asia Pacific Hospital Market, 2022 - 2033, USD Million
Table 235 Rest of Asia Pacific Other End-use Market, 2022 - 2033, USD Million
Table 236 Rest of Asia Pacific Specialty Clinics Market, 2022 - 2033, USD Million
Table 237 Rest of Asia Pacific Ophthalmology PACS Market Market by Mode of Action, 2022 - 2033, USD Million
Table 238 Rest of Asia Pacific Cloud-based Market, 2022 - 2033, USD Million
Table 239 Rest of Asia Pacific On-premises Market, 2022 - 2033, USD Million
Table 240 Rest of Asia Pacific Ophthalmology PACS Market Market by Type, 2022 - 2033, USD Million
Table 241 Rest of Asia Pacific Integrated Market, 2022 - 2033, USD Million
Table 242 Rest of Asia Pacific Standalone Market, 2022 - 2033, USD Million
Table 243 LAMEA Ophthalmology PACS Market Market, 2022 - 2033, USD Million
Table 244 LAMEA Ophthalmology PACS Market Market by End-use, 2022 - 2033, USD Million Table 245 LAMEA Hospital Market, 2022 - 2033, USD Million
Table 246 LAMEA Other End-use Market, 2022 - 2033, USD Million
Table 247 LAMEA Specialty Clinics Market, 2022 - 2033, USD Million
Table 248 LAMEA Ophthalmology PACS Market Market by Mode of Action, 2022 - 2033, USD Million
Table 249 LAMEA Cloud-based Market, 2022 - 2033, USD Million
Table 250 LAMEA On-premises Market, 2022 - 2033, USD Million
Table 251 LAMEA Ophthalmology PACS Market Market by Type, 2022 - 2033, USD Million
Table 252 LAMEA Integrated Market, 2022 - 2033, USD Million
Table 253 LAMEA Standalone Market, 2022 - 2033, USD Million
Table 254 Brazil Ophthalmology PACS Market Market, 2022 - 2033, USD Million
Table 255 Brazil Ophthalmology PACS Market Market by End-use, 2022 - 2033, USD Million
Table 256 Brazil Hospital Market, 2022 - 2033, USD Million
Table 257 Brazil Other End-use Market, 2022 - 2033, USD Million
Table 258 Brazil Specialty Clinics Market, 2022 - 2033, USD Million
Table 259 Brazil Ophthalmology PACS Market Market by Mode of Action, 2022 - 2033, USD Million
Table 260 Brazil Cloud-based Market, 2022 - 2033, USD Million
Table 261 Brazil On-premises Market, 2022 - 2033, USD Million
Table 262 Brazil Ophthalmology PACS Market Market by Type, 2022 - 2033, USD Million
Table 263 Brazil Integrated Market, 2022 - 2033, USD Million
Table 264 Brazil Standalone Market, 2022 - 2033, USD Million
Table 265 Argentina Ophthalmology PACS Market Market, 2022 - 2033, USD Million
Table 266 Argentina Ophthalmology PACS Market Market by End-use, 2022 - 2033, USD Million
Table 267 Argentina Hospital Market, 2022 - 2033, USD Million
Table 268 Argentina Other End-use Market, 2022 - 2033, USD Million
Table 269 Argentina Specialty Clinics Market, 2022 - 2033, USD Million
Table 270 Argentina Ophthalmology PACS Market Market by Mode of Action, 2022 - 2033, USD Million
Table 271 Argentina Cloud-based Market, 2022 - 2033, USD Million
Table 272 Argentina On-premises Market, 2022 - 2033, USD Million
Table 273 Argentina Ophthalmology PACS Market Market by Type, 2022 - 2033, USD Million
Table 274 Argentina Integrated Market, 2022 - 2033, USD Million
Table 275 Argentina Standalone Market, 2022 - 2033, USD Million
Table 276 United Arab Emirates Ophthalmology PACS Market Market, 2022 - 2033, USD Million
Table 277 United Arab Emirates Ophthalmology PACS Market Market by End-use, 2022 - 2033, USD Million
Table 278 United Arab Emirates Hospital Market, 2022 - 2033, USD Million
Table 279 United Arab Emirates Other End-use Market, 2022 - 2033, USD Million
Table 280 United Arab Emirates Specialty Clinics Market, 2022 - 2033, USD Million
Table 281 United Arab Emirates Ophthalmology PACS Market Market by Mode of Action, 2022 - 2033, USD Million
Table 282 United Arab Emirates Cloud-based Market, 2022 - 2033, USD Million
Table 283 United Arab Emirates On-premises Market, 2022 - 2033, USD Million
Table 284 United Arab Emirates Ophthalmology PACS Market Market by Type, 2022 - 2033, USD Million
Table 285 United Arab Emirates Integrated Market, 2022 - 2033, USD Million
Table 286 United Arab Emirates Standalone Market, 2022 - 2033, USD Million
Table 287 Saudi Arabia Ophthalmology PACS Market Market, 2022 - 2033, USD Million
Table 288 Saudi Arabia Ophthalmology PACS Market Market by End-use, 2022 - 2033, USD Million
Table 289 Saudi Arabia Hospital Market, 2022 - 2033, USD Million
Table 290 Saudi Arabia Other End-use Market, 2022 - 2033, USD Million
Table 291 Saudi Arabia Specialty Clinics Market, 2022 - 2033, USD Million
Table 292 Saudi Arabia Ophthalmology PACS Market Market by Mode of Action, 2022 - 2033, USD Million
Table 293 Saudi Arabia Cloud-based Market, 2022 - 2033, USD Million
Table 294 Saudi Arabia On-premises Market, 2022 - 2033, USD Million
Table 295 Saudi Arabia Ophthalmology PACS Market Market by Type, 2022 - 2033, USD Million
Table 296 Saudi Arabia Integrated Market, 2022 - 2033, USD Million
Table 297 Saudi Arabia Standalone Market, 2022 - 2033, USD Million
Table 298 South Africa Ophthalmology PACS Market Market, 2022 - 2033, USD Million
Table 299 South Africa Ophthalmology PACS Market Market by End-use, 2022 - 2033, USD Million
Table 300 South Africa Hospital Market, 2022 - 2033, USD Million
Table 301 South Africa Other End-use Market, 2022 - 2033, USD Million
Table 302 South Africa Specialty Clinics Market, 2022 - 2033, USD Million
Table 303 South Africa Ophthalmology PACS Market Market by Mode of Action, 2022 - 2033, USD Million
Table 304 South Africa Cloud-based Market, 2022 - 2033, USD Million
Table 305 South Africa On-premises Market, 2022 - 2033, USD Million
Table 306 South Africa Ophthalmology PACS Market Market by Type, 2022 - 2033, USD Million
Table 307 South Africa Integrated Market, 2022 - 2033, USD Million
Table 308 South Africa Standalone Market, 2022 - 2033, USD Million
Table 309 Nigeria Ophthalmology PACS Market Market, 2022 - 2033, USD Million
Table 310 Nigeria Ophthalmology PACS Market Market by End-use, 2022 - 2033, USD Million
Table 311 Nigeria Hospital Market, 2022 - 2033, USD Million
Table 312 Nigeria Other End-use Market, 2022 - 2033, USD Million
Table 313 Nigeria Specialty Clinics Market, 2022 - 2033, USD Million
Table 314 Nigeria Ophthalmology PACS Market Market by Mode of Action, 2022 - 2033, USD Million
Table 315 Nigeria Cloud-based Market, 2022 - 2033, USD Million
Table 316 Nigeria On-premises Market, 2022 - 2033, USD Million
Table 317 Nigeria Ophthalmology PACS Market Market by Type, 2022 - 2033, USD Million
Table 318 Nigeria Integrated Market, 2022 - 2033, USD Million
Table 319 Nigeria Standalone Market, 2022 - 2033, USD Million
Table 320 Rest of LAMEA Ophthalmology PACS Market Market, 2022 - 2033, USD Million
Table 321 Rest of LAMEA Ophthalmology PACS Market Market by End-use, 2022 - 2033, USD Million
Table 322 Rest of LAMEA Hospital Market, 2022 - 2033, USD Million
Table 323 Rest of LAMEA Other End-use Market, 2022 - 2033, USD Million
Table 324 Rest of LAMEA Specialty Clinics Market, 2022 - 2033, USD Million
Table 325 Rest of LAMEA Ophthalmology PACS Market Market by Mode of Action, 2022 - 2033, USD Million
Table 326 Rest of LAMEA Cloud-based Market, 2022 - 2033, USD Million
Table 327 Rest of LAMEA On-premises Market, 2022 - 2033, USD Million
Table 328 Rest of LAMEA Ophthalmology PACS Market Market by Type, 2022 - 2033, USD Million
Table 329 Rest of LAMEA Integrated Market, 2022 - 2033, USD Million
Table 330 Rest of LAMEA Standalone Market, 2022 - 2033, USD Million
List of Figures
FIG 1 Methodology for the research
FIG 2 Key Factors Impacting Market
FIG 3 Market Consolidation
FIG 4 Key Customer Criteria
FIG 5 Product Life Cycle
FIG 6 Value Chain Analysis
FIG 7 Market Share Analysis
FIG 8 Global Ophthalmology PACS Market Market, 2022 - 2033, USD Million
FIG 9 Global Ophthalmology PACS Market Market by End-use, 2022 - 2033, USD Million
FIG 10 Global Hospital Market, 2022 - 2033, USD Million
FIG 11 Global Other End-use Market, 2022 - 2033, USD Million
FIG 12 Global Specialty Clinics Market, 2022 - 2033, USD Million
FIG 13 Global Ophthalmology PACS Market Market by Mode of Action, 2022 - 2033, USD Million
FIG 14 Global Cloud-based Market, 2022 - 2033, USD Million
FIG 15 Global On-premises Market, 2022 - 2033, USD Million
FIG 16 Global Ophthalmology PACS Market Market by Type, 2022 - 2033, USD Million
FIG 17 Global Integrated Market, 2022 - 2033, USD Million
FIG 18 Global Standalone Market, 2022 - 2033, USD Million
FIG 19 North America Ophthalmology PACS Market Market, 2022 - 2033, USD Million
FIG 20 North America Ophthalmology PACS Market Market by End-use, 2022 - 2033, USD Million
FIG 21 North America Hospital Market, 2022 - 2033, USD Million
FIG 22 North America Other End-use Market, 2022 - 2033, USD Million
FIG 23 North America Specialty Clinics Market, 2022 - 2033, USD Million
FIG 24 North America Ophthalmology PACS Market Market by Mode of Action, 2022 - 2033, USD Million
FIG 25 North America Cloud-based Market, 2022 - 2033, USD Million
FIG 26 North America On-premises Market, 2022 - 2033, USD Million
FIG 27 North America Ophthalmology PACS Market Market by Type, 2022 - 2033, USD Million
FIG 28 North America Integrated Market, 2022 - 2033, USD Million
FIG 29 North America Standalone Market, 2022 - 2033, USD Million
FIG 30 Europe Ophthalmology PACS Market Market, 2022 - 2033, USD Million
FIG 31 Europe Ophthalmology PACS Market Market by End-use, 2022 - 2033, USD Million
FIG 32 Europe Hospital Market, 2022 - 2033, USD Million
FIG 33 Europe Other End-use Market, 2022 - 2033, USD Million
FIG 34 Europe Specialty Clinics Market, 2022 - 2033, USD Million
FIG 35 Europe Ophthalmology PACS Market Market by Mode of Action, 2022 - 2033, USD Million
FIG 36 Europe Cloud-based Market, 2022 - 2033, USD Million
FIG 37 Europe On-premises Market, 2022 - 2033, USD Million
FIG 38 Europe Ophthalmology PACS Market Market by Type, 2022 - 2033, USD Million
FIG 39 Europe Integrated Market, 2022 - 2033, USD Million
FIG 40 Europe Standalone Market, 2022 - 2033, USD Million
FIG 41 Asia Pacific Ophthalmology PACS Market Market, 2022 - 2033, USD Million
FIG 42 Asia Pacific Ophthalmology PACS Market Market by End-use, 2022 - 2033, USD Million
FIG 43 Asia Pacific Hospital Market, 2022 - 2033, USD Million
FIG 44 Asia Pacific Other End-use Market, 2022 - 2033, USD Million
FIG 45 Asia Pacific Specialty Clinics Market, 2022 - 2033, USD Million
FIG 46 Asia Pacific Ophthalmology PACS Market Market by Mode of Action, 2022 - 2033, USD Million
FIG 47 Asia Pacific Cloud-based Market, 2022 - 2033, USD Million
FIG 48 Asia Pacific On-premises Market, 2022 - 2033, USD Million
FIG 49 Asia Pacific Ophthalmology PACS Market Market by Type, 2022 - 2033, USD Million
FIG 50 Asia Pacific Integrated Market, 2022 - 2033, USD Million
FIG 51 Asia Pacific Standalone Market, 2022 - 2033, USD Million
FIG 52 LAMEA Ophthalmology PACS Market Market, 2022 - 2033, USD Million
FIG 53 LAMEA Ophthalmology PACS Market Market by End-use, 2022 - 2033, USD Million
FIG 54 LAMEA Hospital Market, 2022 - 2033, USD Million
FIG 55 LAMEA Other End-use Market, 2022 - 2033, USD Million
FIG 56 LAMEA Specialty Clinics Market, 2022 - 2033, USD Million
FIG 57 LAMEA Ophthalmology PACS Market Market by Mode of Action, 2022 - 2033, USD Million
FIG 58 LAMEA Cloud-based Market, 2022 - 2033, USD Million
FIG 59 LAMEA On-premises Market, 2022 - 2033, USD Million
FIG 60 LAMEA Ophthalmology PACS Market Market by Type, 2022 - 2033, USD Million
FIG 61 LAMEA Integrated Market, 2022 - 2033, USD Million
FIG 62 LAMEA Standalone Market, 2022 - 2033, USD Million