North America Digital Workplace Market Size, Share & Industry Analysis Report By Component (Solutions, and Services), By Organization Size (Large Enterprises, and Small and Medium-sized Enterprises (SMEs)), By End-use (BFSI, Retail & Consumer Goods, Healthcare & Pharmaceuticals, and IT & Telecommunication), By Country Outlook and Forecast, 2026 - 2033
Published Date : 02-Sep-2026 |
Pages: 201 |
Report Format: PDF + Excel |
COVID-19 Impact on the North America Digital Workplace Market
The North America Digital Workplace Market is expected to reach USD 85.7 billion by 2032, growing at a CAGR of 22.3% during (2026 – 2033).
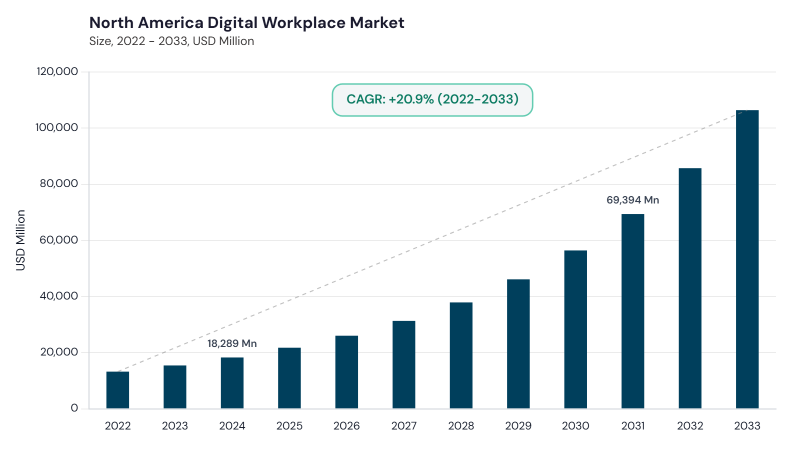
The North America Digital Workplace Market developed from early enterprise IT environments that supported office productivity through on-premise systems, email, intranets, and standalone collaboration tools. Over time, cloud computing, mobile access, broadband connectivity, and SaaS platforms shifted workplace technology from isolated applications toward integrated digital ecosystems. The adoption of unified communication platforms, cloud productivity suites, and secure remote access tools enabled employees to collaborate beyond physical offices. Hybrid work adoption further accelerated the transition toward connected, flexible, and employee-centric digital workplaces.
The North America Digital Workplace Market is advancing through AI-infused productivity tools, hybrid work models, cybersecurity requirements, compliance readiness, and digital employee experience platforms. Enterprises are deploying intelligent assistants, automated workflows, cloud collaboration suites, unified communications, secure endpoint management, and analytics-driven workforce tools to improve productivity and engagement. Demand is supported by distributed teams, remote access needs, regulatory pressure, digital skills development, and enterprise modernization initiatives. Vendors are focusing on platform integration, AI automation, zero-trust security, user-friendly interfaces, and scalable service ecosystems.
Component Outlook
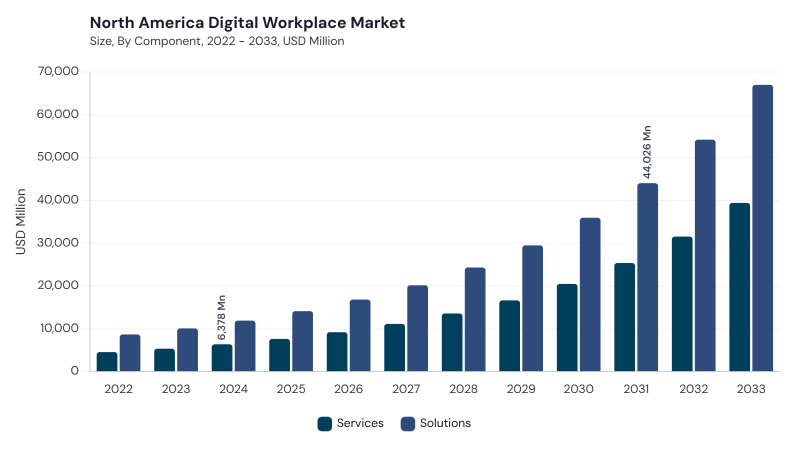
Based on Component, the market is segmented into Solutions and Services. The Solutions market dominated the North America Digital Workplace Market by Component in 2025, and would continue to be a dominant market till 2033; thereby, achieving a market value of USD 54.2 billion by 2032, growing at a CAGR of 21.8 % during the forecast period. Additionally, The Services market is expected to witness highest CAGR of 23.1% during (2026 - 2033).
Solutions lead due to widespread enterprise adoption of cloud collaboration platforms, unified communication tools, digital employee experience applications, workflow automation software, cybersecurity platforms, and AI-enabled productivity suites. These solutions support hybrid work, secure access, real-time communication, digital content management, and workforce collaboration across distributed organizations. Services remain important as enterprises require consulting, implementation, integration, managed support, change management, training, and continuous optimization to modernize workplace infrastructure. The services segment also benefits from rising demand for AI deployment support, compliance configuration, cybersecurity advisory, and migration from legacy systems to cloud-native workplace environments.
Organization Size Outlook
Based on Organization Size, the market is segmented into Large Enterprises and Small and Medium-sized Enterprises (SMEs). The Large Enterprises market dominated the North America Digital Workplace Market by Organization Size in 2025, and would continue to be a dominant market till 2033; thereby, achieving a market value of USD 52.5 billion by 2032, growing at a CAGR of 21.8 % during the forecast period. Additionally, The Small and Medium-sized Enterprises (SMEs) market is expected to witness highest CAGR of 23% during (2026 - 2033).
Large Enterprises lead due to mature cloud strategies, larger IT budgets, distributed workforce structures, strict compliance requirements, and broad adoption of AI-powered workplace platforms. These organizations use digital workplace solutions for secure collaboration, enterprise mobility, workflow automation, employee engagement, analytics, and integration with ERP, CRM, HRMS, and identity platforms. SMEs are increasingly adopting digital workplace technologies as SaaS models, subscription pricing, mobile-first tools, and cloud-based deployment reduce upfront infrastructure needs. SME demand is supported by remote work, affordable collaboration suites, basic automation, secure file sharing, and the need to improve productivity with lean IT teams.
End-use Outlook
Based on End-use, the market is segmented into BFSI, IT & Telecommunication, Retail & Consumer Goods, Healthcare & Pharmaceuticals, Manufacturing, and Other End-use. BFSI leads due to secure collaboration needs, remote workforce management, regulatory compliance, fraud-risk monitoring, customer engagement, workflow automation, and protection of sensitive financial data. IT & Telecommunication follows due to cloud-native work environments, DevOps collaboration, remote infrastructure management, network operations, and rapid adoption of AI-enabled productivity tools.
Retail & Consumer Goods uses digital workplace platforms for omnichannel coordination, workforce scheduling, training, inventory visibility, and customer experience management. Healthcare & Pharmaceuticals, Manufacturing, and Other End-use areas add demand through secure clinical workflows, telehealth support, connected operations, industrial collaboration, government services, education, professional services, and digital content workflows.
Free Valuable Insights: The Global Digital Workplace Market will hit USD 306.8 Billion billion by 2033, at a CAGR of 23.1%
Country Outlook
Based on Country, the market is segmented into US, Canada, Mexico, and Rest of North America. The US market dominated the North America Digital Workplace Market by Country in 2025, and would continue to be a dominant market till 2033; thereby, achieving a market value of USD 67.5 billion by 2032, growing at a CAGR of 21.5 % during the forecast period. The Canada market is expected to witness a CAGR of 25.2% during (2026 - 2033). Additionally, The Mexico market is expected to witness a CAGR of 24.7% during (2026 - 2033).
The US leads due to strong enterprise cloud adoption, AI-enabled workplace transformation, cybersecurity investment, hybrid work maturity, large technology vendor presence, and demand for integrated productivity platforms. Canada supports growth through human-centric workplace design, immersive collaboration tools, AI adoption, secure cloud infrastructure, and localized compliance-focused digital workplace solutions. Mexico is advancing through cloud migration, nearshoring-driven digital modernization, AI automation, hybrid work adoption, and demand from enterprises aligning with international operational standards. Rest of North America benefits from broader remote work enablement, employee experience platforms, secure collaboration, and cloud-based workplace modernization.
List of Key Companies Profiled
- Microsoft Corporation
- Google LLC (Alphabet Inc.)
- Cisco Systems, Inc.
- Salesforce, Inc.
- IBM Corporation
- ServiceNow, Inc.
- Zoom Communications, Inc.
- Citrix Systems, Inc. (Cloud Software Group)
- VMware LLC (Broadcom Inc.)
- Atos SE
North America Digital Workplace Market Report Segmentation
By Component
- Solutions
- Services
By Organization Size
- Large Enterprises
- Small and Medium-sized Enterprises (SMEs)
By End-use
- BFSI
- IT & Telecommunication
- Retail & Consumer Goods
- Healthcare & Pharmaceuticals
- Manufacturing
- Other End-use
By Country
- US
- Canada
- Mexico
- Rest of North America
1.1 Market Overview
1.2 Key Factors Impacting Market
1.2.1 Market Drivers
1.2.2 Market Restraints
1.2.3 Market Opportunities
1.2.4 Market Challenges
1.2.5 Market Trends
1.2.6 State of Competition
1.2.7 Market Consolidation
1.2.8 Key Customer Criteria
1.3 Product Life Cycle
1.4 Segmentation By Product
1.4.1 Paper
1.4.2 Plastic
1.4.3 Other Product
1.5 Segmentation By End-use
1.5.1 Commercial
1.5.2 Institutional
1.5.3 Household
1.6 Segmentation By Country
1.6.1 US
1.6.1.1 Segmentation By Product
1.6.1.1.1 Paper
1.6.1.1.2 Plastic
1.6.1.1.3 Other Product
1.6.1.2 Segmentation By End-use
1.6.1.2.1 Commercial
1.6.1.2.2 Institutional
1.6.1.2.3 Household
1.6.2 Canada
1.6.2.1 Segmentation By Product
1.6.2.1.1 Paper
1.6.2.1.2 Plastic
1.6.2.1.3 Other Product
1.6.2.2 Segmentation By End-use
1.6.2.2.1 Commercial
1.6.2.2.2 Institutional
1.6.2.2.3 Household
1.6.3 Mexico
1.6.3.1 Segmentation By Product
1.6.3.1.1 Paper
1.6.3.1.2 Plastic
1.6.3.1.3 Other Product
1.6.3.2 Segmentation By End-use
1.6.3.2.1 Commercial
1.6.3.2.2 Institutional
1.6.3.2.3 Household
1.6.4 Rest of North America
1.6.4.1 Segmentation By Product
1.6.4.1.1 Paper
1.6.4.1.2 Plastic
1.6.4.1.3 Other Product
1.6.4.2 Segmentation By End-use
1.6.4.2.1 Commercial
1.6.4.2.2 Institutional
1.6.4.2.3 Household
Chapter 2. Company Snapshots
2.1 Dart Container Corporation
2.1.1 Business Overview
2.1.2 Key Information
2.1.3 Company Focus on the Disposable Cups Market
2.1.4 Strategic Insights
2.1.5 Strategy Deployed
2.1.6 Product & Service Portfolio
2.1.7 Representative Products
2.1.8 Capability Overview
2.1.9 Technology & Innovation Focus
2.1.10 SWOT Analysis
2.1.11 Customers / End Users
2.1.12 Competitive Positioning
2.1.13 Key Differentiators
2.1.14 Portfolio Matrix
2.1.15 Analyst View
2.1.16 Future Outlook
2.2 Huhtamäki Oyj
2.2.1 Business Overview
2.2.2 Key Information
2.2.3 Company Focus on the Disposable Cups Market
2.2.4 Strategic Insights
2.2.5 Strategy Deployed
2.2.6 Product & Service Portfolio
2.2.7 Representative Products
2.2.8 Capability Overview
2.2.9 Technology & Innovation Focus
2.2.10 SWOT Analysis
2.2.11 Customers / End Users
2.2.12 Competitive Positioning
2.2.13 Key Differentiators
2.2.14 Portfolio Matrix
2.2.15 Analyst View
2.2.16 Future Outlook
2.3 Novolex Holdings LLC
2.3.1 Business Overview
2.3.2 Key Information
2.3.3 Company Focus on the Disposable Cups Market
2.3.4 Strategic Insights
2.3.5 Strategy Deployed
2.3.6 Product & Service Portfolio
2.3.7 Representative Products
2.3.8 Capability Overview
2.3.9 Technology & Innovation Focus
2.3.10 SWOT Analysis
2.3.11 Customers / End Users
2.3.12 Competitive Positioning
2.3.13 Key Differentiators
2.3.14 Portfolio Matrix
2.3.15 Analyst View
2.3.16 Future Outlook
2.4 Graphic Packaging Holding Company
2.4.1 Business Overview
2.4.2 Key Information
2.4.3 Company Focus on the Disposable Cups Market
2.4.4 Strategic Insights
2.4.5 Strategy Deployed
2.4.6 Product & Service Portfolio
2.4.7 Representative Products
2.4.8 Capability Overview
2.4.9 Technology & Innovation Focus
2.4.10 SWOT Analysis
2.4.11 Customers / End Users
2.4.12 Competitive Positioning
2.4.13 Key Differentiators
2.4.14 Portfolio Matrix
2.4.15 Analyst View
2.4.16 Future Outlook
2.5 Georgia-Pacific LLC
2.5.1 Business Overview
2.5.2 Key Information
2.5.3 Company Focus on the Disposable Cups Market
2.5.4 Strategic Insights
2.5.5 Strategy Deployed
2.5.6 Product & Service Portfolio
2.5.7 Representative Products
2.5.8 Capability Overview
2.5.9 Technology & Innovation Focus
2.5.10 SWOT Analysis
2.5.11 Customers / End Users
2.5.12 Competitive Positioning
2.5.13 Key Differentiators
2.5.14 Portfolio Matrix
2.5.15 Analyst View
2.5.16 Future Outlook
2.6 Seda International Packaging Group
2.6.1 Business Overview
2.6.2 Key Information
2.6.3 Company Focus on the Disposable Cups Market
2.6.4 Strategic Insights
2.6.5 Strategy Deployed
2.6.6 Product & Service Portfolio
2.6.7 Representative Products
2.6.8 Capability Overview
2.6.9 Technology & Innovation Focus
2.6.10 SWOT Analysis
2.6.11 Customers / End Users
2.6.12 Competitive Positioning
2.6.13 Key Differentiators
2.6.14 Portfolio Matrix
2.6.15 Analyst View
2.6.16 Future Outlook
2.7 WinCup, Inc.
2.7.1 Business Overview
2.7.2 Key Information
2.7.3 Company Focus on the Disposable Cups Market
2.7.4 Strategic Insights
2.7.5 Strategy Deployed
2.7.6 Product & Service Portfolio
2.7.7 Representative Products
2.7.8 Capability Overview
2.7.9 Technology & Innovation Focus
2.7.10 SWOT Analysis
2.7.11 Customers / End Users
2.7.12 Competitive Positioning
2.7.13 Key Differentiators
2.7.14 Portfolio Matrix
2.7.15 Analyst View
2.7.16 Future Outlook
2.8 Detpak (Detmold Group)
2.8.1 Business Overview
2.8.2 Key Information
2.8.3 Company Focus on the Disposable Cups Market
2.8.4 Strategic Insights
2.8.5 Strategy Deployed
2.8.6 Product & Service Portfolio
2.8.7 Representative Products
2.8.8 Capability Overview
2.8.9 Technology & Innovation Focus
2.8.10 SWOT Analysis
2.8.11 Customers / End Users
2.8.12 Competitive Positioning
2.8.13 Key Differentiators
2.8.14 Portfolio Matrix
2.8.15 Analyst View
2.8.16 Future Outlook
2.9 Go-Pak Group
2.9.1 Business Overview
2.9.2 Key Information
2.9.3 Company Focus on the Disposable Cups Market
2.9.4 Strategic Insights
2.9.5 Strategy Deployed
2.9.6 Product & Service Portfolio
2.9.7 Representative Products
2.9.8 Capability Overview
2.9.9 Technology & Innovation Focus
2.9.10 SWOT Analysis
2.9.11 Customers / End Users
2.9.12 Competitive Positioning
2.9.13 Key Differentiators
2.9.14 Portfolio Matrix
2.9.15 Analyst View
2.9.16 Future Outlook
2.10 Benders Paper Cup Company
2.10.1 Business Overview
2.10.2 Key Information
2.10.3 Company Focus on the Disposable Cups Market
2.10.4 Strategic Insights
2.10.5 Strategy Deployed
2.10.6 Product & Service Portfolio
2.10.7 Representative Products
2.10.8 Capability Overview
2.10.9 Technology & Innovation Focus
2.10.10 SWOT Analysis
2.10.11 Customers / End Users
2.10.12 Competitive Positioning
2.10.13 Key Differentiators
2.10.14 Portfolio Matrix
2.10.15 Analyst View
2.10.16 Future Outlook
Table 1 North America Disposable Cups Market Market, 2022 - 2033, USD Million
Table 2 North America Disposable Cups Market Market by End-use, 2022 - 2033, USD Million
Table 3 North America Commercial Market, 2022 - 2033, USD Million
Table 4 North America Household Market, 2022 - 2033, USD Million
Table 5 North America Institutional Market, 2022 - 2033, USD Million
Table 6 North America Disposable Cups Market Market by Product, 2022 - 2033, USD Million
Table 7 North America Other Product Market, 2022 - 2033, USD Million
Table 8 North America Paper Market, 2022 - 2033, USD Million
Table 9 North America Plastic Market, 2022 - 2033, USD Million
Table 10 United States Disposable Cups Market Market, 2022 - 2033, USD Million
Table 11 United States Disposable Cups Market Market by End-use, 2022 - 2033, USD Million
Table 12 United States Commercial Market, 2022 - 2033, USD Million
Table 13 United States Household Market, 2022 - 2033, USD Million
Table 14 United States Institutional Market, 2022 - 2033, USD Million
Table 15 United States Disposable Cups Market Market by Product, 2022 - 2033, USD Million
Table 16 United States Other Product Market, 2022 - 2033, USD Million
Table 17 United States Paper Market, 2022 - 2033, USD Million
Table 18 United States Plastic Market, 2022 - 2033, USD Million
Table 19 Canada Disposable Cups Market Market, 2022 - 2033, USD Million
Table 20 Canada Disposable Cups Market Market by End-use, 2022 - 2033, USD Million
Table 21 Canada Commercial Market, 2022 - 2033, USD Million
Table 22 Canada Household Market, 2022 - 2033, USD Million
Table 23 Canada Institutional Market, 2022 - 2033, USD Million
Table 24 Canada Disposable Cups Market Market by Product, 2022 - 2033, USD Million
Table 25 Canada Other Product Market, 2022 - 2033, USD Million
Table 26 Canada Paper Market, 2022 - 2033, USD Million
Table 27 Canada Plastic Market, 2022 - 2033, USD Million
Table 28 Mexico Disposable Cups Market Market, 2022 - 2033, USD Million
Table 29 Mexico Disposable Cups Market Market by End-use, 2022 - 2033, USD Million
Table 30 Mexico Commercial Market, 2022 - 2033, USD Million
Table 31 Mexico Household Market, 2022 - 2033, USD Million
Table 32 Mexico Institutional Market, 2022 - 2033, USD Million
Table 33 Mexico Disposable Cups Market Market by Product, 2022 - 2033, USD Million
Table 34 Mexico Other Product Market, 2022 - 2033, USD Million
Table 35 Mexico Paper Market, 2022 - 2033, USD Million
Table 36 Mexico Plastic Market, 2022 - 2033, USD Million
Table 37 Rest of North America Disposable Cups Market Market, 2022 - 2033, USD Million
Table 38 Rest of North America Disposable Cups Market Market by End-use, 2022 - 2033, USD Million
Table 39 Rest of North America Commercial Market, 2022 - 2033, USD Million
Table 40 Rest of North America Household Market, 2022 - 2033, USD Million
Table 41 Rest of North America Institutional Market, 2022 - 2033, USD Million
Table 42 Rest of North America Disposable Cups Market Market by Product, 2022 - 2033, USD Million
Table 43 Rest of North America Other Product Market, 2022 - 2033, USD Million
Table 44 Rest of North America Paper Market, 2022 - 2033, USD Million
Table 45 Rest of North America Plastic Market, 2022 - 2033, USD Million
List of Figures
FIG 1 Key Factors Impacting Market
FIG 2 Market Consolidation
FIG 3 Key Customer Criteria
FIG 4 Product Life Cycle
FIG 5 North America Disposable Cups Market Market, 2022 - 2033, USD Million
FIG 6 North America Disposable Cups Market Market by End-use, 2022 - 2033, USD Million
FIG 7 North America Commercial Market, 2022 - 2033, USD Million
FIG 8 North America Household Market, 2022 - 2033, USD Million
FIG 9 North America Institutional Market, 2022 - 2033, USD Million
FIG 10 North America Disposable Cups Market Market by Product, 2022 - 2033, USD Million
FIG 11 North America Other Product Market, 2022 - 2033, USD Million
FIG 12 North America Paper Market, 2022 - 2033, USD Million
FIG 13 North America Plastic Market, 2022 - 2033, USD Million
FIG 14 United States Disposable Cups Market Market, 2022 - 2033, USD Million
FIG 15 United States Disposable Cups Market Market by End-use, 2022 - 2033, USD Million
FIG 16 United States Commercial Market, 2022 - 2033, USD Million
FIG 17 United States Household Market, 2022 - 2033, USD Million
FIG 18 United States Institutional Market, 2022 - 2033, USD Million
FIG 19 United States Disposable Cups Market Market by Product, 2022 - 2033, USD Million
FIG 20 United States Other Product Market, 2022 - 2033, USD Million
FIG 21 United States Paper Market, 2022 - 2033, USD Million
FIG 22 United States Plastic Market, 2022 - 2033, USD Million
FIG 23 Canada Disposable Cups Market Market, 2022 - 2033, USD Million
FIG 24 Canada Disposable Cups Market Market by End-use, 2022 - 2033, USD Million
FIG 25 Canada Commercial Market, 2022 - 2033, USD Million
FIG 26 Canada Household Market, 2022 - 2033, USD Million
FIG 27 Canada Institutional Market, 2022 - 2033, USD Million
FIG 28 Canada Disposable Cups Market Market by Product, 2022 - 2033, USD Million
FIG 29 Canada Other Product Market, 2022 - 2033, USD Million
FIG 30 Canada Paper Market, 2022 - 2033, USD Million
FIG 31 Canada Plastic Market, 2022 - 2033, USD Million
FIG 32 Mexico Disposable Cups Market Market, 2022 - 2033, USD Million
FIG 33 Mexico Disposable Cups Market Market by End-use, 2022 - 2033, USD Million
FIG 34 Mexico Commercial Market, 2022 - 2033, USD Million
FIG 35 Mexico Household Market, 2022 - 2033, USD Million
FIG 36 Mexico Institutional Market, 2022 - 2033, USD Million
FIG 37 Mexico Disposable Cups Market Market by Product, 2022 - 2033, USD Million
FIG 38 Mexico Other Product Market, 2022 - 2033, USD Million
FIG 39 Mexico Paper Market, 2022 - 2033, USD Million
FIG 40 Mexico Plastic Market, 2022 - 2033, USD Million
FIG 41 Rest of North America Disposable Cups Market Market, 2022 - 2033, USD Million
FIG 42 Rest of North America Disposable Cups Market Market by End-use, 2022 - 2033, USD Million
FIG 43 Rest of North America Commercial Market, 2022 - 2033, USD Million
FIG 44 Rest of North America Household Market, 2022 - 2033, USD Million
FIG 45 Rest of North America Institutional Market, 2022 - 2033, USD Million
FIG 46 Rest of North America Disposable Cups Market Market by Product, 2022 - 2033, USD Million
FIG 47 Rest of North America Other Product Market, 2022 - 2033, USD Million
FIG 48 Rest of North America Paper Market, 2022 - 2033, USD Million
FIG 49 Rest of North America Plastic Market, 2022 - 2033, USD Million