North America Automated and Closed Cell Therapy Processing Systems Market Size, Share & Industry Analysis Report By Type (Non Stem Cell Therapy, and Stem Cell Therapy), By Scale (Pre-Commercial / R&D Scale, and Commercial Scale), By Workflow (Separation, Apheresis, Fill-Finish, and Expansion), By Country Outlook and Forecast, 2026 - 2033
Published Date : 29-Jul-2026 |
Pages: 204 |
Report Format: PDF + Excel |
COVID-19 Impact on the North America Automated And Closed Cell Therapy Processing Systems Market
The North America Automated And Closed Cell Therapy Processing Systems Market is expected to reach USD 2.6 billion by 2032, growing at a CAGR of 19.5% during (2026 – 2033).
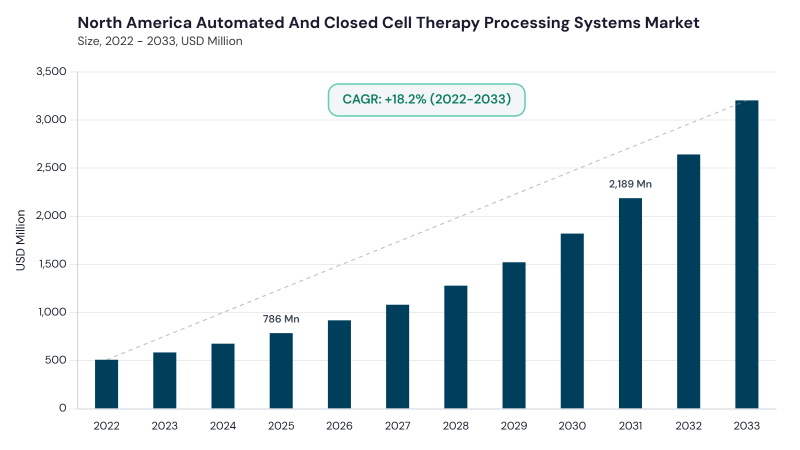
The North America Automated And Closed Cell Therapy Processing Systems Market has evolved from manual, open, and labor-intensive cell therapy manufacturing workflows into a highly controlled automation-driven processing ecosystem. In the early stage, cell therapy production relied heavily on operator-dependent methods for cell isolation, washing, expansion, formulation, and storage, which created risks related to contamination, process inconsistency, batch variability, and limited scalability. As CAR-T therapies, stem cell research, regenerative medicine, and personalized therapies advanced, manufacturers required safer and more reproducible production systems. This need accelerated the adoption of automated and closed platforms capable of maintaining aseptic conditions, reducing manual handling, improving traceability, and supporting GMP-compliant workflows.
The current market is shaped by rising cell and gene therapy pipelines, growing commercialization of immune cell therapies, strict regulatory expectations, higher investment in advanced therapy manufacturing, and increasing demand for scalable closed-system platforms. Manufacturers, CDMOs, hospitals, research institutes, and biotechnology companies are seeking systems that can automate complex workflows, reduce contamination risk, improve cell viability, standardize production, and support faster clinical-to-commercial transition. Demand is also increasing for modular platforms, single-use technologies, AI-enabled process monitoring, real-time analytics, electronic batch records, and integrated systems that combine separation, expansion, washing, fill-finish, and cryopreservation.
Type Outlook
Based on Type, the market is segmented into Non Stem Cell Therapy and Stem Cell Therapy. The Non Stem Cell Therapy market dominated the North America Automated And Closed Cell Therapy Processing Systems Market by Type in 2025, and would continue to be a dominant market till 2033; thereby, achieving a market value of USD 1.5 billion by 2032, growing at a CAGR of 19.1 % during the forecast period. The Stem Cell Therapy market is expected to witness a CAGR of 20% during (2026 - 2033).
Non Stem Cell Therapy holds the leading position due to the growing commercialization of CAR-T, TCR-based therapies, NK cell therapies, and other immune cell-based therapeutic products. These therapies require precise, sterile, and reproducible processing for cell isolation, activation, genetic modification, expansion, washing, formulation, and final preparation. Automated and closed systems reduce operator intervention and help improve consistency across patient-specific and donor-derived workflows. Stem Cell Therapy is also gaining relevance as regenerative medicine research, clinical trials, and advanced therapeutic applications expand across North America. Automated closed systems support stem cell isolation, culture expansion, differentiation, harvesting, and cryopreservation while maintaining viability and reducing contamination exposure. The segment is supported by increasing research in tissue repair, autoimmune conditions, neurological disorders, orthopedic applications, and broader regenerative medicine development.
Scale Outlook
Based on Scale, the market is segmented into Pre-Commercial / R&D Scale and Commercial Scale. The Pre-Commercial / R&D Scale market dominated the North America Automated And Closed Cell Therapy Processing Systems Market by Scale in 2025, and would continue to be a dominant market till 2033; thereby, achieving a market value of USD 1.9 billion by 2032, growing at a CAGR of 19.3 % during the forecast period. The Commercial Scale market is expected to witness a CAGR of 20% during (2026 - 2033).
Pre-Commercial / R&D Scale leads the market because a large number of cell therapy programs remain in discovery, process development, translational research, and clinical trial stages. Academic centers, biotechnology startups, hospitals, and CDMOs require flexible automated systems that can support small-batch production, protocol optimization, early-stage validation, and clinical material manufacturing. These systems help researchers improve process control while maintaining adaptability for different cell types and therapeutic approaches. Commercial Scale is gaining importance as more cell therapies advance toward approval and market launch, creating demand for high-throughput, standardized, and GMP-compliant manufacturing platforms. Commercial-scale systems focus on reproducibility, automation depth, traceability, batch consistency, process analytics, and reduced labor dependency. As approved therapies increase and manufacturing capacity expands, commercial-scale adoption is expected to strengthen across biopharmaceutical and contract manufacturing facilities.
Workflow Outlook
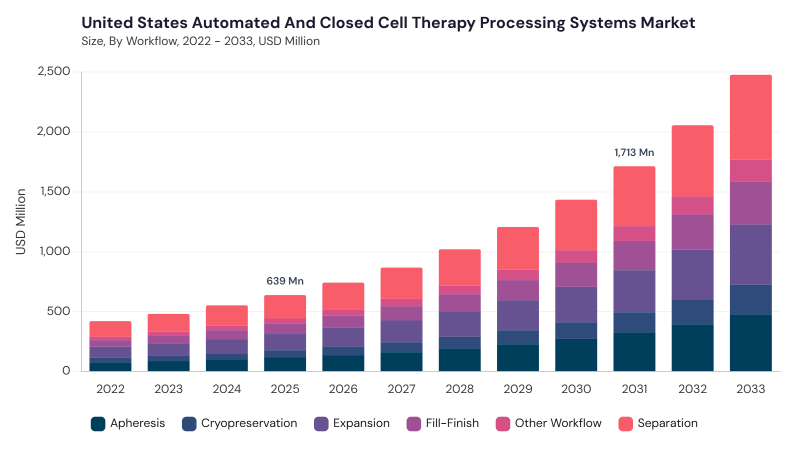
Based on Workflow, the market is segmented into Separation, Expansion, Apheresis, Fill-Finish, Cryopreservation, and Other Workflow. Separation leads the market because cell isolation is a foundational step in producing high-quality therapeutic cell products. Automated closed separation systems help isolate target cells from blood, bone marrow, or other biological materials while reducing contamination risk and improving purity, viability, and consistency. Expansion is an important segment as many therapies require controlled cell growth to achieve clinically relevant doses.
Automated expansion platforms support scalable culture conditions, process monitoring, and reproducible cell proliferation across autologous and allogeneic workflows. Apheresis plays a key role in collecting patient-derived or donor-derived cells for personalized and immune cell therapies. Fill-Finish supports sterile final product preparation, dosing accuracy, and compliance-ready product handling. Cryopreservation is important for long-term storage, transport, and multi-site distribution of viable cell products. Other Workflow includes formulation, washing, buffer exchange, quality control preparation, and supportive processing steps that improve end-to-end manufacturing efficiency.
Free Valuable Insights: The Global Automated And Closed Cell Therapy Processing Systems Market will hit USD 7.0 Billion billion by 2033, at a CAGR of 20.2%
Country Outlook
Based on Country, the market is segmented into US, Canada, Mexico, and Rest of North America. The US market dominated the North America Automated And Closed Cell Therapy Processing Systems Market by Country in 2025, and would continue to be a dominant market till 2033; thereby, achieving a market value of USD 2.1 billion by 2032, growing at a CAGR of 18.8 % during the forecast period. The Canada market is expected to witness a CAGR of 22.3% during (2026 - 2033). Additionally, The Mexico market is expected to witness a CAGR of 21.8% during (2026 - 2033).
The US remains the leading country market due to its strong cell and gene therapy pipeline, large biotechnology base, advanced clinical trial ecosystem, established CDMO network, regulatory maturity, and high investment in automated GMP-compliant manufacturing. The country is adopting closed processing platforms for CAR-T therapies, immune cell therapies, stem cell research, commercial manufacturing, decentralized production, and digital process monitoring. Canada contributes through its growing regenerative medicine ecosystem, CAR-T manufacturing capabilities, academic research centers, clinical development programs, and increasing use of modular closed-system technologies. Mexico is gaining traction through expanding biotechnology activity, clinical research development, improving regulatory alignment, and gradual adoption of automated platforms for safer and more consistent cell therapy processing. Rest of North America supports market growth through specialized therapy development, cross-border research collaboration, clinical manufacturing support, and increasing awareness of closed-system automation for advanced therapy production.
List of Key Companies Profiled
- Thermo Fisher Scientific Inc.
- Cytiva
- Sartorius AG
- Miltenyi Biotec B.V. & Co. KG
- Lonza Group AG
- Fresenius Kabi AG
- Terumo BCT, Inc.
- Bio-Techne Corporation
- Cellares Corporation
- Merck KGaA
North America Automated And Closed Cell Therapy Processing Systems Market Report Segmentation
By Type
- Non Stem Cell Therapy
- Stem Cell Therapy
By Scale
- Pre-Commercial / R&D Scale
- Commercial Scale
By Workflow
- Separation
- Expansion
- Apheresis
- Fill-Finish
- Cryopreservation
- Other Workflow
By Country
- US
- Canada
- Mexico
- Rest of North America
1.1 Market Overview
1.2 Key Factors Impacting Market
1.2.1 Market Drivers
1.2.2 Market Restraints
1.2.3 Market Opportunities
1.2.4 Market Challenges
1.2.5 Market Trends
1.2.6 State of Competition
1.2.7 Market Consolidation
1.2.8 Key Customer Criteria
1.3 Product Life Cycle
1.4 Segmentation By Type
1.4.1 Non Stem Cell Therapy
1.4.2 Stem Cell Therapy
1.5 Segmentation By Scale
1.5.1 Pre-Commercial / R&D Scale
1.5.2 Commercial Scale
1.6 Segmentation By Workflow
1.6.1 Separation
1.6.2 Expansion
1.6.3 Apheresis
1.6.4 Fill-Finish
1.6.5 Cryopreservation
1.6.6 Other Workflow
1.7 Segmentation By Country
1.7.1 US
1.7.1.1 Segmentation By Type
1.7.1.1.1 Non Stem Cell Therapy
1.7.1.1.2 Stem Cell Therapy
1.7.1.2 Segmentation By Scale
1.7.1.2.1 Pre-Commercial / R&D Scale
1.7.1.2.2 Commercial Scale
1.7.1.3 Segmentation By Workflow
1.7.1.3.1 Separation
1.7.1.3.2 Expansion
1.7.1.3.3 Apheresis
1.7.1.3.4 Fill-Finish
1.7.1.3.5 Cryopreservation
1.7.1.3.6 Other Workflow
1.7.2 Canada
1.7.2.1 Segmentation By Type
1.7.2.1.1 Non Stem Cell Therapy
1.7.2.1.2 Stem Cell Therapy
1.7.2.2 Segmentation By Scale
1.7.2.2.1 Pre-Commercial / R&D Scale
1.7.2.2.2 Commercial Scale
1.7.2.3 Segmentation By Workflow
1.7.2.3.1 Separation
1.7.2.3.2 Expansion
1.7.2.3.3 Apheresis
1.7.2.3.4 Fill-Finish
1.7.2.3.5 Cryopreservation
1.7.2.3.6 Other Workflow
1.7.3 Mexico
1.7.3.1 Segmentation By Type
1.7.3.1.1 Non Stem Cell Therapy
1.7.3.1.2 Stem Cell Therapy
1.7.3.2 Segmentation By Scale
1.7.3.2.1 Pre-Commercial / R&D Scale
1.7.3.2.2 Commercial Scale
1.7.3.3 Segmentation By Workflow
1.7.3.3.1 Separation
1.7.3.3.2 Expansion
1.7.3.3.3 Apheresis
1.7.3.3.4 Fill-Finish
1.7.3.3.5 Cryopreservation
1.7.3.3.6 Other Workflow
1.7.4 Rest of North America
1.7.4.1 Segmentation By Type
1.7.4.1.1 Non Stem Cell Therapy
1.7.4.1.2 Stem Cell Therapy
1.7.4.2 Segmentation By Scale
1.7.4.2.1 Pre-Commercial / R&D Scale
1.7.4.2.2 Commercial Scale
1.7.4.3 Segmentation By Workflow
1.7.4.3.1 Separation
1.7.4.3.2 Expansion
1.7.4.3.3 Apheresis
1.7.4.3.4 Fill-Finish
1.7.4.3.5 Cryopreservation
1.7.4.3.6 Other Workflow
Chapter 2. Company Snapshots
2.1 Thermo Fisher Scientific Inc.
2.1.1 Business Overview
2.1.2 Key Information
2.1.3 Company Focus on Automated and Closed Cell Therapy Processing Systems Market
2.1.4 Strategic Insights
2.1.5 Strategy Deployed
2.1.6 Product & Service Portfolio
2.1.7 Capability Overview
2.1.8 Technology & Innovation Focus
2.1.9 SWOT Analysis
2.1.10 Customers / End Users
2.1.11 Competitive Positioning
2.1.12 Key Differentiators
2.1.13 Portfolio Matrix
2.1.14 Analyst View
2.1.15 Future Outlook
2.2 Cytiva
2.2.1 Business Overview
2.2.2 Key Information
2.2.3 Company Focus on Automated and Closed Cell Therapy Processing Systems Market
2.2.4 Strategic Insights
2.2.5 Strategy Deployed
2.2.6 Product & Service Portfolio
2.2.7 Representative Products
2.2.8 Capability Overview
2.2.9 Technology & Innovation Focus
2.2.10 SWOT Analysis
2.2.11 Customers / End Users
2.2.12 Competitive Positioning
2.2.13 Key Differentiators
2.2.14 Portfolio Matrix
2.2.15 Analyst View
2.2.16 Future Outlook
2.3 Sartorius AG
2.3.1 Business Overview
2.3.2 Key Information
2.3.3 Company Focus on Automated and Closed Cell Therapy Processing Systems Market
2.3.4 Strategic Insights
2.3.5 Strategy Deployed
2.3.6 Product & Service Portfolio
2.3.7 Representative Products
2.3.8 Capability Overview
2.3.9 Technology & Innovation Focus
2.3.10 SWOT Analysis
2.3.11 Customers / End Users
2.3.12 Competitive Positioning
2.3.13 Key Differentiators
2.3.14 Portfolio Matrix
2.3.15 Analyst View
2.3.16 Future Outlook
2.4 Miltenyi Biotec B.V. & Co. KG
2.4.1 Business Overview
2.4.2 Key Information
2.4.3 Company Focus on Automated and Closed Cell Therapy Processing Systems Market
2.4.4 Strategic Insights
2.4.5 Strategy Deployed
2.4.6 Product & Service Portfolio
2.4.7 Representative Products
2.4.8 Capability Overview
2.4.9 Technology & Innovation Focus
2.4.10 SWOT Analysis
2.4.11 Customers / End Users
2.4.12 Competitive Positioning
2.4.13 Key Differentiators
2.4.14 Portfolio Matrix
2.4.15 Analyst View
2.4.16 Future Outlook
2.5 Lonza Group AG
2.5.1 Business Overview
2.5.2 Key Information
2.5.3 Company Focus on Automated and Closed Cell Therapy Processing Systems Market
2.5.4 Strategic Insights
2.5.5 Strategy Deployed
2.5.6 Product & Service Portfolio
2.5.7 Representative Products
2.5.8 Capability Overview
2.5.9 Technology & Innovation Focus
2.5.10 SWOT Analysis
2.5.11 Customers / End Users
2.5.12 Competitive Positioning
2.5.13 Key Differentiators
2.5.14 Portfolio Matrix
2.5.15 Analyst View
2.5.16 Future Outlook
2.6 Fresenius Kabi AG
2.6.1 Business Overview
2.6.2 Key Information
2.6.3 Company Focus on Automated and Closed Cell Therapy Processing Systems Market
2.6.4 Strategic Insights
2.6.5 Strategy Deployed
2.6.6 Product & Service Portfolio
2.6.7 Representative Products
2.6.8 Capability Overview
2.6.9 Technology & Innovation Focus
2.6.10 SWOT Analysis
2.6.11 Customers / End Users
2.6.12 Competitive Positioning
2.6.13 Key Differentiators
2.6.14 Portfolio Matrix
2.6.15 Analyst View
2.6.16 Future Outlook
2.7 Terumo BCT, Inc.
2.7.1 Business Overview
2.7.2 Key Information
2.7.3 Company Focus on Automated and Closed Cell Therapy Processing Systems Market
2.7.4 Strategic Insights
2.7.5 Strategy Deployed
2.7.6 Product & Service Portfolio
2.7.7 Representative Products
2.7.8 Capability Overview
2.7.9 Technology & Innovation Focus
2.7.10 SWOT Analysis
2.7.11 Customers / End Users
2.7.12 Competitive Positioning
2.7.13 Key Differentiators
2.7.14 Portfolio Matrix
2.7.15 Analyst View
2.7.16 Future Outlook
2.8 Bio-Techne Corporation
2.8.1 Business Overview
2.8.2 Key Information
2.8.3 Company Focus on Automated and Closed Cell Therapy Processing Systems Market
2.8.4 Strategic Insights
2.8.5 Strategy Deployed
2.8.6 Product & Service Portfolio
2.8.7 Representative Products
2.8.8 Capability Overview
2.8.9 Technology & Innovation Focus
2.8.10 SWOT Analysis
2.8.11 Customers / End Users
2.8.12 Competitive Positioning
2.8.13 Key Differentiators
2.8.14 Portfolio Matrix
2.8.15 Analyst View
2.8.16 Future Outlook
2.9 Merck KGaA
2.9.1 Business Overview
2.9.2 Key Information
2.9.3 Company Focus on Automated and Closed Cell Therapy Processing Systems Market
2.9.4 Strategic Insights
2.9.5 Strategy Deployed
2.9.6 Product & Service Portfolio
2.9.7 Representative Products
2.9.8 Capability Overview
2.9.9 Technology & Innovation Focus
2.9.10 SWOT Analysis
2.9.11 Customers / End Users
2.9.12 Competitive Positioning
2.9.13 Key Differentiators
2.9.14 Portfolio Matrix
2.9.15 Analyst View
2.9.16 Future Outlook
2.10 Cellares Corporation
2.10.1 Business Overview
2.10.2 Key Information
2.10.3 Company Focus on Automated and Closed Cell Therapy Processing Systems Market
2.10.4 Strategic Insights
2.10.5 Strategy Deployed
2.10.6 Product & Service Portfolio
2.10.7 Representative Products / Services
2.10.8 Capability Overview 2.10.9 Technology & Innovation Focus
2.10.10 SWOT Analysis
2.10.11 Customers / End Users
2.10.12 Competitive Positioning
2.10.13 Key Differentiators
2.10.14 Portfolio Matrix
2.10.15 Analyst View
2.10.16 Future Outlook
Table 1 North America Automated And Closed Cell Therapy Processing Systems Market Market, 2022 - 2033, USD Million
Table 2 Methodology for the research
Table 3 Key Factors Impacting Market
Table 4 Market Consolidation
Table 5 Key Customer Criteria
Table 6 Product Life Cycle
Table 7 Value Chain Analysis
Table 8 North America Automated And Closed Cell Therapy Processing Systems Market Market by Scale, 2022 - 2033, USD Million
Table 9 North America Commercial Scale Market, 2022 - 2033, USD Million
Table 10 North America Pre-Commercial / R&D Scale Market, 2022 - 2033, USD Million
Table 11 North America Automated And Closed Cell Therapy Processing Systems Market Market by Type, 2022 - 2033, USD Million
Table 12 North America Non Stem Cell Therapy Market, 2022 - 2033, USD Million
Table 13 North America Stem Cell Therapy Market, 2022 - 2033, USD Million
Table 14 North America Automated And Closed Cell Therapy Processing Systems Market Market by Workflow, 2022 - 2033, USD Million
Table 15 North America Apheresis Market, 2022 - 2033, USD Million
Table 16 North America Cryopreservation Market, 2022 - 2033, USD Million
Table 17 North America Expansion Market, 2022 - 2033, USD Million
Table 18 North America Fill-Finish Market, 2022 - 2033, USD Million
Table 19 North America Other Workflow Market, 2022 - 2033, USD Million
Table 20 North America Separation Market, 2022 - 2033, USD Million
Table 21 Canada Automated And Closed Cell Therapy Processing Systems Market Market, 2022 - 2033, USD Million
Table 22 Methodology for the research
Table 23 Key Factors Impacting Market
Table 24 Market Consolidation
Table 25 Key Customer Criteria
Table 26 Product Life Cycle
Table 27 Value Chain Analysis
Table 28 Canada Automated And Closed Cell Therapy Processing Systems Market Market by Scale, 2022 - 2033, USD Million
Table 29 Canada Commercial Scale Market, 2022 - 2033, USD Million
Table 30 Canada Pre-Commercial / R&D Scale Market, 2022 - 2033, USD Million
Table 31 Canada Automated And Closed Cell Therapy Processing Systems Market Market by Type, 2022 - 2033, USD Million
Table 32 Canada Non Stem Cell Therapy Market, 2022 - 2033, USD Million
Table 33 Canada Stem Cell Therapy Market, 2022 - 2033, USD Million
Table 34 Canada Automated And Closed Cell Therapy Processing Systems Market Market by Workflow, 2022 - 2033, USD Million
Table 35 Canada Apheresis Market, 2022 - 2033, USD Million
Table 36 Canada Cryopreservation Market, 2022 - 2033, USD Million
Table 37 Canada Expansion Market, 2022 - 2033, USD Million
Table 38 Canada Fill-Finish Market, 2022 - 2033, USD Million
Table 39 Canada Other Workflow Market, 2022 - 2033, USD Million
Table 40 Canada Separation Market, 2022 - 2033, USD Million
Table 41 Mexico Automated And Closed Cell Therapy Processing Systems Market Market, 2022 - 2033, USD Million
Table 42 Methodology for the research
Table 43 Key Factors Impacting Market
Table 44 Market Consolidation
Table 45 Key Customer Criteria
Table 46 Product Life Cycle
Table 47 Value Chain Analysis
Table 48 Mexico Automated And Closed Cell Therapy Processing Systems Market Market by Scale, 2022 - 2033, USD Million
Table 49 Mexico Commercial Scale Market, 2022 - 2033, USD Million
Table 50 Mexico Pre-Commercial / R&D Scale Market, 2022 - 2033, USD Million
Table 51 Mexico Automated And Closed Cell Therapy Processing Systems Market Market by Type, 2022 - 2033, USD Million
Table 52 Mexico Non Stem Cell Therapy Market, 2022 - 2033, USD Million
Table 53 Mexico Stem Cell Therapy Market, 2022 - 2033, USD Million
Table 54 Mexico Automated And Closed Cell Therapy Processing Systems Market Market by Workflow, 2022 - 2033, USD Million
Table 55 Mexico Apheresis Market, 2022 - 2033, USD Million
Table 56 Mexico Cryopreservation Market, 2022 - 2033, USD Million
Table 57 Mexico Expansion Market, 2022 - 2033, USD Million
Table 58 Mexico Fill-Finish Market, 2022 - 2033, USD Million
Table 59 Mexico Other Workflow Market, 2022 - 2033, USD Million
Table 60 Mexico Separation Market, 2022 - 2033, USD Million
Table 61 United States Automated And Closed Cell Therapy Processing Systems Market Market, 2022 - 2033, USD Million
Table 62 Methodology for the research
Table 63 Key Factors Impacting Market
Table 64 Market Consolidation
Table 65 Key Customer Criteria
Table 66 Product Life Cycle
Table 67 Value Chain Analysis
Table 68 United States Automated And Closed Cell Therapy Processing Systems Market Market by Scale, 2022 - 2033, USD Million
Table 69 United States Commercial Scale Market, 2022 - 2033, USD Million
Table 70 United States Pre-Commercial / R&D Scale Market, 2022 - 2033, USD Million
Table 71 United States Automated And Closed Cell Therapy Processing Systems Market Market by Type, 2022 - 2033, USD Million
Table 72 United States Non Stem Cell Therapy Market, 2022 - 2033, USD Million
Table 73 United States Stem Cell Therapy Market, 2022 - 2033, USD Million
Table 74 United States Automated And Closed Cell Therapy Processing Systems Market Market by Workflow, 2022 - 2033, USD Million
Table 75 United States Apheresis Market, 2022 - 2033, USD Million
Table 76 United States Cryopreservation Market, 2022 - 2033, USD Million
Table 77 United States Expansion Market, 2022 - 2033, USD Million
Table 78 United States Fill-Finish Market, 2022 - 2033, USD Million
Table 79 United States Other Workflow Market, 2022 - 2033, USD Million
Table 80 United States Separation Market, 2022 - 2033, USD Million
Table 81 Rest of North America Automated And Closed Cell Therapy Processing Systems Market Market, 2022 - 2033, USD Million
Table 82 Methodology for the research
Table 83 Key Factors Impacting Market
Table 84 Market Consolidation
Table 85 Key Customer Criteria
Table 86 Product Life Cycle
Table 87 Value Chain Analysis
Table 88 Rest of North America Automated And Closed Cell Therapy Processing Systems Market Market by Scale, 2022 - 2033, USD Million
Table 89 Rest of North America Commercial Scale Market, 2022 - 2033, USD Million
Table 90 Rest of North America Pre-Commercial / R&D Scale Market, 2022 - 2033, USD Million
Table 91 Rest of North America Automated And Closed Cell Therapy Processing Systems Market Market by Type, 2022 - 2033, USD Million
Table 92 Rest of North America Non Stem Cell Therapy Market, 2022 - 2033, USD Million
Table 93 Rest of North America Stem Cell Therapy Market, 2022 - 2033, USD Million
Table 94 Rest of North America Automated And Closed Cell Therapy Processing Systems Market Market by Workflow, 2022 - 2033, USD Million
Table 95 Rest of North America Apheresis Market, 2022 - 2033, USD Million
Table 96 Rest of North America Cryopreservation Market, 2022 - 2033, USD Million
Table 97 Rest of North America Expansion Market, 2022 - 2033, USD Million
Table 98 Rest of North America Fill-Finish Market, 2022 - 2033, USD Million
Table 99 Rest of North America Other Workflow Market, 2022 - 2033, USD Million
Table 100 Rest of North America Separation Market, 2022 - 2033, USD Million
List of Figures
FIG 1 Methodology for the research
FIG 2 Key Factors Impacting Market
FIG 3 Market Consolidation
FIG 4 Key Customer Criteria
FIG 5 Product Life Cycle
FIG 6 North America Automated And Closed Cell Therapy Processing Systems Market Market, 2022 - 2033, USD Million
FIG 7 North America Automated And Closed Cell Therapy Processing Systems Market Market by Scale, 2022 - 2033, USD Million
FIG 8 North America Commercial Scale Market, 2022 - 2033, USD Million
FIG 9 North America Pre-Commercial / R&D Scale Market, 2022 - 2033, USD Million
FIG 10 North America Automated And Closed Cell Therapy Processing Systems Market Market by Type, 2022 - 2033, USD Million
FIG 11 North America Non Stem Cell Therapy Market, 2022 - 2033, USD Million
FIG 12 North America Stem Cell Therapy Market, 2022 - 2033, USD Million
FIG 13 North America Automated And Closed Cell Therapy Processing Systems Market Market by Workflow, 2022 - 2033, USD Million
FIG 14 North America Apheresis Market, 2022 - 2033, USD Million
FIG 15 North America Cryopreservation Market, 2022 - 2033, USD Million
FIG 16 North America Expansion Market, 2022 - 2033, USD Million
FIG 17 North America Fill-Finish Market, 2022 - 2033, USD Million
FIG 18 North America Other Workflow Market, 2022 - 2033, USD Million
FIG 19 North America Separation Market, 2022 - 2033, USD Million
FIG 20 Canada Automated And Closed Cell Therapy Processing Systems Market Market, 2022 - 2033, USD Million
FIG 21 Canada Automated And Closed Cell Therapy Processing Systems Market Market by Scale, 2022 - 2033, USD Million
FIG 22 Canada Commercial Scale Market, 2022 - 2033, USD Million
FIG 23 Canada Pre-Commercial / R&D Scale Market, 2022 - 2033, USD Million
FIG 24 Canada Automated And Closed Cell Therapy Processing Systems Market Market by Type, 2022 - 2033, USD Million
FIG 25 Canada Non Stem Cell Therapy Market, 2022 - 2033, USD Million
FIG 26 Canada Stem Cell Therapy Market, 2022 - 2033, USD Million
FIG 27 Canada Automated And Closed Cell Therapy Processing Systems Market Market by Workflow, 2022 - 2033, USD Million
FIG 28 Canada Apheresis Market, 2022 - 2033, USD Million
FIG 29 Canada Cryopreservation Market, 2022 - 2033, USD Million
FIG 30 Canada Expansion Market, 2022 - 2033, USD Million
FIG 31 Canada Fill-Finish Market, 2022 - 2033, USD Million
FIG 32 Canada Other Workflow Market, 2022 - 2033, USD Million
FIG 33 Canada Separation Market, 2022 - 2033, USD Million
FIG 34 Mexico Automated And Closed Cell Therapy Processing Systems Market Market, 2022 - 2033, USD Million
FIG 35 Mexico Automated And Closed Cell Therapy Processing Systems Market Market by Scale, 2022 - 2033, USD Million
FIG 36 Mexico Commercial Scale Market, 2022 - 2033, USD Million
FIG 37 Mexico Pre-Commercial / R&D Scale Market, 2022 - 2033, USD Million
FIG 38 Mexico Automated And Closed Cell Therapy Processing Systems Market Market by Type, 2022 - 2033, USD Million
FIG 39 Mexico Non Stem Cell Therapy Market, 2022 - 2033, USD Million
FIG 40 Mexico Stem Cell Therapy Market, 2022 - 2033, USD Million
FIG 41 Mexico Automated And Closed Cell Therapy Processing Systems Market Market by Workflow, 2022 - 2033, USD Million
FIG 42 Mexico Apheresis Market, 2022 - 2033, USD Million
FIG 43 Mexico Cryopreservation Market, 2022 - 2033, USD Million
FIG 44 Mexico Expansion Market, 2022 - 2033, USD Million
FIG 45 Mexico Fill-Finish Market, 2022 - 2033, USD Million
FIG 46 Mexico Other Workflow Market, 2022 - 2033, USD Million
FIG 47 Mexico Separation Market, 2022 - 2033, USD Million
FIG 48 United States Automated And Closed Cell Therapy Processing Systems Market Market, 2022 - 2033, USD Million
FIG 49 United States Automated And Closed Cell Therapy Processing Systems Market Market by Scale, 2022 - 2033, USD Million
FIG 50 United States Commercial Scale Market, 2022 - 2033, USD Million
FIG 51 United States Pre-Commercial / R&D Scale Market, 2022 - 2033, USD Million
FIG 52 United States Automated And Closed Cell Therapy Processing Systems Market Market by Type, 2022 - 2033, USD Million
FIG 53 United States Non Stem Cell Therapy Market, 2022 - 2033, USD Million
FIG 54 United States Stem Cell Therapy Market, 2022 - 2033, USD Million
FIG 55 United States Automated And Closed Cell Therapy Processing Systems Market Market by Workflow, 2022 - 2033, USD Million
FIG 56 United States Apheresis Market, 2022 - 2033, USD Million
FIG 57 United States Cryopreservation Market, 2022 - 2033, USD Million
FIG 58 United States Expansion Market, 2022 - 2033, USD Million
FIG 59 United States Fill-Finish Market, 2022 - 2033, USD Million
FIG 60 United States Other Workflow Market, 2022 - 2033, USD Million
FIG 61 United States Separation Market, 2022 - 2033, USD Million
FIG 62 Rest of North America Automated And Closed Cell Therapy Processing Systems Market Market, 2022 - 2033, USD Million
FIG 63 Rest of North America Automated And Closed Cell Therapy Processing Systems Market Market by Scale, 2022 - 2033, USD Million
FIG 64 Rest of North America Commercial Scale Market, 2022 - 2033, USD Million
FIG 65 Rest of North America Pre-Commercial / R&D Scale Market, 2022 - 2033, USD Million
FIG 66 Rest of North America Automated And Closed Cell Therapy Processing Systems Market Market by Type, 2022 - 2033, USD Million
FIG 67 Rest of North America Non Stem Cell Therapy Market, 2022 - 2033, USD Million
FIG 68 Rest of North America Stem Cell Therapy Market, 2022 - 2033, USD Million
FIG 69 Rest of North America Automated And Closed Cell Therapy Processing Systems Market Market by Workflow, 2022 - 2033, USD Million
FIG 70 Rest of North America Apheresis Market, 2022 - 2033, USD Million
FIG 71 Rest of North America Cryopreservation Market, 2022 - 2033, USD Million
FIG 72 Rest of North America Expansion Market, 2022 - 2033, USD Million
FIG 73 Rest of North America Fill-Finish Market, 2022 - 2033, USD Million
FIG 74 Rest of North America Other Workflow Market, 2022 - 2033, USD Million
FIG 75 Rest of North America Separation Market, 2022 - 2033, USD Million