LAMEA Inventory Tags Market Size, Share & Industry Analysis Report By Application (Inventory Tracking & Monitoring, Supply Chain Tracking & Visibility, and Asset Management), By End Use (Retail & E-commerce, and Transportation & Logistics), By Technology (RFID, and Barcodes), By Material Type (Plastic, and Paper), By Country Outlook and Forecast, 2026 - 2033
Published Date : 25-Oct-2026 |
Pages: 366 |
Report Format: PDF + Excel |
COVID-19 Impact on the LAMEA Inventory Tags Market
The LAMEA Inventory Tags Market is expected to reach USD 545.0 million by 2029, growing at a CAGR of 6.1% during (2026 - 2033).

The LAMEA Inventory Tags Market originated from the rising need to improve goods tracking and inventory management across Latin America, the Middle East, and Africa. Early adoption relied on barcode stickers and printed labels for basic identification, while the gradual introduction of RFID, NFC, mobile scanning devices, and cloud-based inventory platforms improved stock visibility, remote data access, and automated tracking. The market has since evolved into a more integrated inventory ecosystem supporting retail, manufacturing, healthcare, logistics, and other commercial operations.
Current market growth is shaped by RFID adoption, cloud-based analytics, sustainability, and regional demand for scalable inventory visibility. RFID is helping businesses move from manual stocktaking to automated monitoring, while cloud-linked tags support predictive replenishment, demand forecasting, and reduced holding costs. Eco-friendly materials, reusable tags, IoT-enabled tracking, AI-driven analytics, blockchain-based security, and localized solutions are also gaining importance as companies respond to diverse regional conditions, cost sensitivity, and compliance needs.
Application Outlook
Based on Application, the market is segmented into Inventory Tracking & Monitoring, Asset Management, Supply Chain Tracking & Visibility, Outdoor & Travel Safety, and Other Application. The Inventory Tracking & Monitoring market dominated the LAMEA Inventory Tags Market by Application in 2025, and would continue to be a dominant market till 2033; thereby, achieving a market value of USD 200.9 million by 2029, growing at a CAGR of 5.4 % during the forecast period. The Asset Management market is expected to witness a CAGR of 5.8% during (2026 - 2033). The Other Application market is expected to witness a CAGR of 7.7% during (2026 - 2033).
Inventory Tracking & Monitoring remains the core application as warehouses, retail spaces, and industrial facilities use barcode, RFID, and NFC-based systems for stock visibility, theft prevention, expiry tracking, and replenishment control. Asset Management holds substantial adoption through equipment tracking, lifecycle monitoring, maintenance visibility, and durable tags for construction, healthcare, transportation, and industrial assets. Supply Chain Tracking & Visibility supports product traceability, shipment monitoring, counterfeit prevention, and real-time logistics control. Outdoor & Travel Safety serves luggage, personal belongings, sporting equipment, and safety-related tracking, while Other Application includes agriculture, construction, museums, libraries, public-sector assets, exhibition items, and institutional workflows.
End Use Outlook
Based on End Use, the market is segmented into Retail & E-commerce, Transportation & Logistics, Manufacturing, Healthcare, and Other End Use. The Retail & E-commerce market dominated the LAMEA Inventory Tags Market by End Use in 2025, and would continue to be a dominant market till 2033; thereby, achieving a market value of USD 185.9 million by 2029, growing at a CAGR of 5.3 % during the forecast period. The Transportation & Logistics market is expected to witness a CAGR of 5.8% during (2026 - 2033). Additionally, The Manufacturing market is expected to witness highest CAGR of 6.5% during (2026 - 2033).
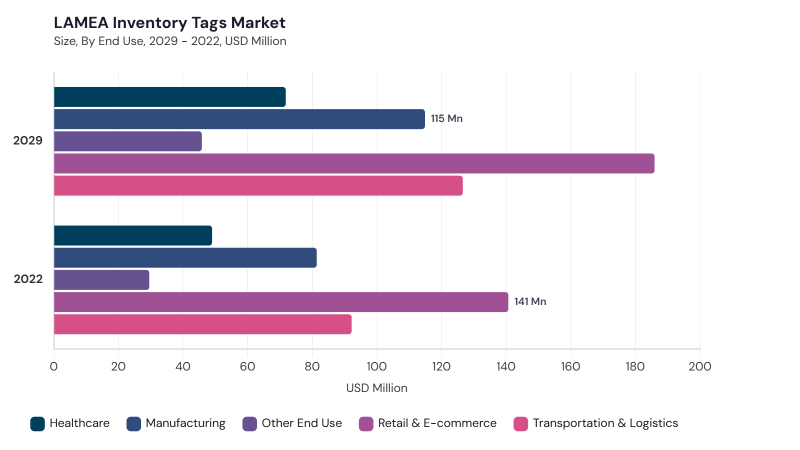
Retail & E-commerce uses inventory tags for product identification, stock management, theft prevention, omnichannel inventory tracking, automated warehouse operations, and faster order fulfillment. Transportation & Logistics depends on tags for cargo tracking, container identification, pallet management, shipment visibility, customs compliance, and real-time movement monitoring. Manufacturing applies tags for raw materials, work-in-progress inventory, finished goods, production-line visibility, equipment tracking, and quality control. Healthcare adoption is supported by medical supplies, pharmaceuticals, equipment tracking, tamper-evident identification, and regulatory compliance. Other End Use includes agriculture, education, hospitality, government operations, construction, and commercial facilities requiring asset and inventory visibility.
Technology Outlook
Based on Technology, the market is segmented into RFID, Barcodes, QR Codes, and Other Technology. RFID remains the leading technology due to automated identification, real-time visibility, non-line-of-sight scanning, multi-tag reading, theft prevention, and suitability for large warehouses, logistics, and industrial operations. Barcodes maintain substantial adoption because they are affordable, easy to implement, compatible with existing systems, and practical for SMEs and cost-sensitive operations.
QR Codes continue gaining traction through smartphone scanning, higher data capacity, product authentication, web-link access, and digitally connected inventory workflows. Other Technology includes NFC, Bluetooth-enabled tags, biometric tagging, infrared tags, and sensor-supported smart labels used for high-value assets, security, environmental monitoring, and specialized tracking scenarios.
Material Type Outlook
Based on Material Type, the market is segmented into Plastic, Paper, Metal, and Fabric. Plastic tags are widely used because they offer durability, moisture resistance, abrasion resistance, RFID and barcode compatibility, and suitability for warehouses, manufacturing plants, cold storage, and organized retail. Paper tags maintain significant use in FMCG, agriculture, package identification, batch labeling, and price tagging due to low cost, printability, disposability, and increasing use of recycled or certified paper.
Metal tags serve oil and gas, mining, utilities, automotive, heavy manufacturing, and infrastructure environments where long-term asset visibility and resistance to heat, corrosion, and wear are required. Fabric tags hold a promising role in textiles, garments, apparel, hospitality laundry, brand identification, reusable-item management, and applications requiring washable and flexible tagging.
Free Valuable Insights: Inventory Tags Market Size Worth USD 8.2 Billion billion by 2033
Country Outlook
Based on Country, the market is segmented into Brazil, Argentina, UAE, Saudi Arabia, South Africa, Nigeria, and Rest of LAMEA. The Brazil market dominated the LAMEA Inventory Tags Market by Country in 2025, and would continue to be a dominant market till 2033; thereby, achieving a market value of USD 142.9 million by 2029, growing at a CAGR of 4.8 % during the forecast period. The Argentina market is expected to witness a CAGR of 6.6% during (2026 - 2033). Additionally, The UAE market is expected to witness a CAGR of 4.9% during (2026 - 2033).
Brazil is supported by Industry 4.0 adoption, smart RFID systems, sustainable tag materials, traceability requirements, and IoT-enabled inventory visibility, while Argentina is shaped by RFID adoption, IoT-enabled tracking, cloud inventory systems, eco-friendly materials, and localized solutions. The UAE reflects RFID growth, IoT integration, smart logistics, sustainability-focused tags, and ERP/WMS-linked inventory systems, whereas Saudi Arabia is driven by IoT-enabled tags, Vision 2030-linked digitization, secure traceability, sustainable materials, and cloud-based inventory platforms. South Africa is advancing through RFID and NFC adoption, cloud inventory platforms, eco-friendly tags, secure traceability, and smart sensor integration; Nigeria is supported by RFID and smart tags, anti-counterfeiting features, localized materials, QR codes, and cost-optimized solutions; and Rest of LAMEA is shaped by IoT-enabled smart tags, cloud-based inventory platforms, sustainable materials, NFC-enabled tracking, analytics, and localized deployment models.
List of Key Companies Profiled
- Avery Dennison
- CCL Industries
- Zebra Technologies
- Brady Corporation
- SATO
- 3M
- Beontag
- HID Global
- Confidex
- Tageos
LAMEA Inventory Tags Market Report Segmentation
By Application
- Inventory Tracking & Monitoring
- Asset Management
- Supply Chain Tracking & Visibility
- Outdoor & Travel Safety
- Other Application
By Technology
- RFID
- Barcodes
- QR Codes
- Other Technology
By Material Type
- Plastic
- Paper
- Metal
- Fabric
By End Use
- Retail & E-commerce
- Transportation & Logistics
- Manufacturing
- Healthcare
- Other End Use
By Country
- Brazil
- Argentina
- UAE
- Saudi Arabia
- South Africa
- Nigeria
- Rest of LAMEA
1.1 Market Overview
1.2 Key Factors Impacting Market
1.2.1 Market Drivers
1.2.2 Market Restraints
1.2.3 Market Opportunities
1.2.4 Market Challenges
1.2.5 Market Trends
1.2.6 State of Competition
1.2.7 Market Consolidation
1.2.8 Key Customer Criteria
1.3 Product Life Cycle
1.4 Segmentation By Application
1.4.1 Inventory Tracking & Monitoring
1.4.2 Asset Management
1.4.3 Supply Chain Tracking & Visibility
1.4.4 Outdoor & Travel Safety
1.4.5 Other Application
1.5 Segmentation By End Use
1.5.1 Retail & E-commerce
1.5.2 Transportation & Logistics
1.5.3 Manufacturing
1.5.4 Healthcare
1.5.5 Other End Use
1.6 Segmentation By Technology
1.6.1 RFID
1.6.2 Barcodes
1.6.3 QR Codes
1.6.4 Other Technology
1.7 Segmentation By Material Type
1.7.1 Plastic
1.7.2 Paper
1.7.3 Metal
1.7.4 Fabric
1.8 Segmentation By Country
1.8.1 Brazil
1.8.1.1 Segmentation By Application
1.8.1.2 Inventory Tracking & Monitoring
1.8.1.3 Asset Management
1.8.1.4 Supply Chain Tracking & Visibility
1.8.1.5 Outdoor & Travel Safety
1.8.1.6 Other Application
1.8.1.6.1 Segmentation By End Use
1.8.1.7 Retail & E-commerce
1.8.1.8 Transportation & Logistics
1.8.1.9 Manufacturing
1.8.1.10 Healthcare
1.8.1.11 Other End Use
1.8.1.11.1 Segmentation By Technology
1.8.1.12 RFID
1.8.1.13 Barcodes
1.8.1.14 QR Codes
1.8.1.15 Other Technology
1.8.1.15.1 Segmentation By Material Type
1.8.1.16 Plastic
1.8.1.17 Paper
1.8.1.18 Metal
1.8.1.19 Fabric
1.8.2 Argentina
1.8.2.1 Segmentation By Application
1.8.2.2 Inventory Tracking & Monitoring
1.8.2.3 Asset Management
1.8.2.4 Supply Chain Tracking & Visibility
1.8.2.5 Outdoor & Travel Safety
1.8.2.6 Other Application
1.8.2.6.1 Segmentation By End Use
1.8.2.7 Retail & E-commerce
1.8.2.8 Transportation & Logistics
1.8.2.9 Manufacturing
1.8.2.10 Healthcare
1.8.2.11 Other End Use
1.8.2.11.1 Segmentation By Technology
1.8.2.12 RFID
1.8.2.13 Barcodes
1.8.2.14 QR Codes
1.8.2.15 Other Technology
1.8.2.15.1 Segmentation By Material Type
1.8.2.16 Plastic
1.8.2.17 Paper
1.8.2.18 Metal
1.8.2.19 Fabric
1.8.3 UAE
1.8.3.1 Segmentation By Application
1.8.3.2 Inventory Tracking & Monitoring
1.8.3.3 Asset Management
1.8.3.4 Supply Chain Tracking & Visibility
1.8.3.5 Outdoor & Travel Safety
1.8.3.6 Other Application
1.8.3.6.1 Segmentation By End Use
1.8.3.7 Retail & E-commerce
1.8.3.8 Transportation & Logistics
1.8.3.9 Manufacturing
1.8.3.10 Healthcare
1.8.3.11 Other End Use
1.8.3.11.1 Segmentation By Technology
1.8.3.12 RFID
1.8.3.13 Barcodes
1.8.3.14 QR Codes
1.8.3.15 Other Technology
1.8.3.15.1 Segmentation By Material Type
1.8.3.16 Plastic
1.8.3.17 Paper
1.8.3.18 Metal
1.8.3.19 Fabric
1.8.4 Saudi Arabia
1.8.4.1 Segmentation By Application
1.8.4.2 Inventory Tracking & Monitoring
1.8.4.3 Asset Management
1.8.4.4 Supply Chain Tracking & Visibility
1.8.4.5 Outdoor & Travel Safety
1.8.4.6 Other Application
1.8.4.6.1 Segmentation By End Use
1.8.4.7 Retail & E-commerce
1.8.4.8 Transportation & Logistics
1.8.4.9 Manufacturing
1.8.4.10 Healthcare
1.8.4.11 Other End Use
1.8.4.11.1 Segmentation By Technology
1.8.4.12 RFID
1.8.4.13 Barcodes
1.8.4.14 QR Codes
1.8.4.15 Other Technology
1.8.4.15.1 Segmentation By Material Type
1.8.4.16 Plastic
1.8.4.17 Paper
1.8.4.18 Metal
1.8.4.19 Fabric
1.8.5 South Africa
1.8.5.1 Segmentation By Application
1.8.5.2 Inventory Tracking & Monitoring
1.8.5.3 Asset Management
1.8.5.4 Supply Chain Tracking & Visibility
1.8.5.5 Outdoor & Travel Safety
1.8.5.6 Other Application
1.8.5.6.1 Segmentation By End Use
1.8.5.7 Retail & E-commerce
1.8.5.8 Transportation & Logistics
1.8.5.9 Manufacturing
1.8.5.10 Healthcare
1.8.5.11 Other End Use
1.8.5.11.1 Segmentation By Technology
1.8.5.12 RFID
1.8.5.13 Barcodes
1.8.5.14 QR Codes
1.8.5.15 Other Technology
1.8.5.15.1 Segmentation By Material Type
1.8.5.16 Plastic
1.8.5.17 Paper
1.8.5.18 Metal
1.8.5.19 Fabric
1.8.6 Nigeria
1.8.6.1 Segmentation By Application
1.8.6.2 Inventory Tracking & Monitoring
1.8.6.3 Asset Management
1.8.6.4 Supply Chain Tracking & Visibility
1.8.6.5 Outdoor & Travel Safety
1.8.6.6 Other Application
1.8.6.6.1 Segmentation By End Use
1.8.6.7 Retail & E-commerce
1.8.6.8 Transportation & Logistics
1.8.6.9 Manufacturing
1.8.6.10 Healthcare
1.8.6.11 Other End Use
1.8.6.11.1 Segmentation By Technology
1.8.6.12 RFID
1.8.6.13 Barcodes
1.8.6.14 QR Codes
1.8.6.15 Other Technology
1.8.6.15.1 Segmentation By Material Type
1.8.6.16 Plastic
1.8.6.17 Paper
1.8.6.18 Metal
1.8.6.19 Fabric
1.8.7 Rest of LAMEA
1.8.7.1 Segmentation By Application
1.8.7.2 Inventory Tracking & Monitoring
1.8.7.3 Asset Management
1.8.7.4 Supply Chain Tracking & Visibility
1.8.7.5 Outdoor & Travel Safety
1.8.7.6 Other Application
1.8.7.6.1 Segmentation By End Use
1.8.7.7 Retail & E-commerce
1.8.7.8 Transportation & Logistics
1.8.7.9 Manufacturing
1.8.7.10 Healthcare
1.8.7.11 Other End Use
1.8.7.11.1 Segmentation By Technology
1.8.7.12 RFID
1.8.7.13 Barcodes
1.8.7.14 QR Codes
1.8.7.15 Other Technology
1.8.7.15.1 Segmentation By Material Type
1.8.7.16 Plastic
1.8.7.17 Paper
1.8.7.18 Metal
1.8.7.19 Fabric
Chapter 2. Company Snapshots
2.1 Avery Dennison
2.1.1 Business Overview
2.1.2 Key Information
2.1.3 Company Focus on Inventory Tags Market
2.1.4 Strategic Insights / Strategy Deployed
2.1.5 SWOT Analysis
2.1.6 Key Differentiators / Portfolio Matrix
2.1.7 Future Outlook
2.2 CCL Industries
2.2.1 Business Overview
2.2.2 Key Information
2.2.3 Company Focus on Inventory Tags Market
2.2.4 Strategic Insights / Strategy Deployed
2.2.5 SWOT Analysis
2.2.6 Portfolio Matrix / Key Differentiators
2.2.7 Future Outlook
2.3 Zebra Technologies
2.3.1 Business Overview
2.3.2 Key Information
2.3.3 Company Focus on Inventory Tags Market
2.3.4 Strategy Deployed
2.3.5 SWOT Analysis
2.3.6 Portfolio Matrix / Key Differentiators
2.3.7 Future Outlook
2.4 Brady Corporation
2.4.1 Business Overview
2.4.2 Key Information
2.4.3 Company Focus on Inventory Tags Market
2.4.4 Strategy Deployed
2.4.5 SWOT Analysis
2.4.6 Portfolio Matrix / Key Differentiators
2.4.7 Future Outlook
2.5 SATO
2.5.1 Business Overview
2.5.2 Key Information
2.5.3 Company Focus on Inventory Tags Market
2.5.4 Strategy Deployed
2.5.5 SWOT Analysis
2.5.6 Portfolio Matrix / Key Differentiators
2.5.7 Future Outlook
2.6 M
2.6.1 Business Overview
2.6.2 Key Information
2.6.3 Company Focus on Inventory Tags Market
2.6.4 Strategy Deployed
2.6.5 SWOT Analysis
2.6.6 Portfolio Matrix / Key Differentiators 2.6.7 Future Outlook
2.7 Beontag
2.7.1 Business Overview
2.7.2 Key Information
2.7.3 Company Focus on Inventory Tags Market
2.7.4 Strategy Deployed
2.7.5 SWOT Analysis
2.7.6 Portfolio Matrix / Key Differentiators
2.7.7 Future Outlook
2.8 HID Global
2.8.1 Business Overview
2.8.2 Key Information
2.8.3 Company Focus on Inventory Tags Market
2.8.4 Strategy Deployed
2.8.5 SWOT Analysis
2.8.6 Portfolio Matrix / Key Differentiators
2.8.7 Future Outlook
2.9 Confidex
2.9.1 Business Overview
2.9.2 Key Information
2.9.3 Company Focus on Inventory Tags Market
2.9.4 Strategy Deployed
2.9.5 SWOT Analysis
2.9.6 Portfolio Matrix / Key Differentiators
2.9.7 Future Outlook
2.10 Tageos
2.10.1 Business Overview
2.10.2 Key Information
2.10.3 Company Focus on Inventory Tags Market
2.10.4 Strategy Deployed
2.10.5 SWOT Analysis
2.10.6 Portfolio Matrix / Key Differentiators
2.10.7 Future Outlook
Table 1 LAMEA Inventory Tags Market Market, 2022 - 2033, USD Million
Table 2 LAMEA Inventory Tags Market Market by Application, 2022 - 2033, USD Million
Table 3 LAMEA Asset Management Market, 2022 - 2033, USD Million
Table 4 LAMEA Inventory Tracking & Monitoring Market, 2022 - 2033, USD Million
Table 5 LAMEA Other Application Market, 2022 - 2033, USD Million
Table 6 LAMEA Outdoor & Travel Safety Market, 2022 - 2033, USD Million
Table 7 LAMEA Supply Chain Tracking & Visibility Market, 2022 - 2033, USD Million
Table 8 LAMEA Inventory Tags Market Market by End Use, 2022 - 2033, USD Million
Table 9 LAMEA Healthcare Market, 2022 - 2033, USD Million
Table 10 LAMEA Manufacturing Market, 2022 - 2033, USD Million
Table 11 LAMEA Other End Use Market, 2022 - 2033, USD Million
Table 12 LAMEA Retail & E-commerce Market, 2022 - 2033, USD Million
Table 13 LAMEA Transportation & Logistics Market, 2022 - 2033, USD Million
Table 14 LAMEA Inventory Tags Market Market by Material Type, 2022 - 2033, USD Million
Table 15 LAMEA Fabric Market, 2022 - 2033, USD Million
Table 16 LAMEA Metal Market, 2022 - 2033, USD Million
Table 17 LAMEA Paper Market, 2022 - 2033, USD Million
Table 18 LAMEA Plastic Market, 2022 - 2033, USD Million
Table 19 LAMEA Inventory Tags Market Market by Technology, 2022 - 2033, USD Million
Table 20 LAMEA Barcodes Market, 2022 - 2033, USD Million
Table 21 LAMEA Other Technology Market, 2022 - 2033, USD Million
Table 22 LAMEA QR Codes Market, 2022 - 2033, USD Million
Table 23 LAMEA RFID Market, 2022 - 2033, USD Million
Table 24 Brazil Inventory Tags Market Market, 2022 - 2033, USD Million
Table 25 Brazil Inventory Tags Market Market by Application, 2022 - 2033, USD Million
Table 26 Brazil Asset Management Market, 2022 - 2033, USD Million
Table 27 Brazil Inventory Tracking & Monitoring Market, 2022 - 2033, USD Million
Table 28 Brazil Other Application Market, 2022 - 2033, USD Million
Table 29 Brazil Outdoor & Travel Safety Market, 2022 - 2033, USD Million
Table 30 Brazil Supply Chain Tracking & Visibility Market, 2022 - 2033, USD Million
Table 31 Brazil Inventory Tags Market Market by End Use, 2022 - 2033, USD Million
Table 32 Brazil Healthcare Market, 2022 - 2033, USD Million
Table 33 Brazil Manufacturing Market, 2022 - 2033, USD Million
Table 34 Brazil Other End Use Market, 2022 - 2033, USD Million
Table 35 Brazil Retail & E-commerce Market, 2022 - 2033, USD Million
Table 36 Brazil Transportation & Logistics Market, 2022 - 2033, USD Million
Table 37 Brazil Inventory Tags Market Market by Material Type, 2022 - 2033, USD Million
Table 38 Brazil Fabric Market, 2022 - 2033, USD Million
Table 39 Brazil Metal Market, 2022 - 2033, USD Million
Table 40 Brazil Paper Market, 2022 - 2033, USD Million
Table 41 Brazil Plastic Market, 2022 - 2033, USD Million
Table 42 Brazil Inventory Tags Market Market by Technology, 2022 - 2033, USD Million
Table 43 Brazil Barcodes Market, 2022 - 2033, USD Million
Table 44 Brazil Other Technology Market, 2022 - 2033, USD Million
Table 45 Brazil QR Codes Market, 2022 - 2033, USD Million
Table 46 Brazil RFID Market, 2022 - 2033, USD Million
Table 47 Argentina Inventory Tags Market Market, 2022 - 2033, USD Million
Table 48 Argentina Inventory Tags Market Market by Application, 2022 - 2033, USD Million
Table 49 Argentina Asset Management Market, 2022 - 2033, USD Million
Table 50 Argentina Inventory Tracking & Monitoring Market, 2022 - 2033, USD Million
Table 51 Argentina Other Application Market, 2022 - 2033, USD Million
Table 52 Argentina Outdoor & Travel Safety Market, 2022 - 2033, USD Million
Table 53 Argentina Supply Chain Tracking & Visibility Market, 2022 - 2033, USD Million
Table 54 Argentina Inventory Tags Market Market by End Use, 2022 - 2033, USD Million
Table 55 Argentina Healthcare Market, 2022 - 2033, USD Million
Table 56 Argentina Manufacturing Market, 2022 - 2033, USD Million
Table 57 Argentina Other End Use Market, 2022 - 2033, USD Million
Table 58 Argentina Retail & E-commerce Market, 2022 - 2033, USD Million
Table 59 Argentina Transportation & Logistics Market, 2022 - 2033, USD Million
Table 60 Argentina Inventory Tags Market Market by Material Type, 2022 - 2033, USD Million
Table 61 Argentina Fabric Market, 2022 - 2033, USD Million
Table 62 Argentina Metal Market, 2022 - 2033, USD Million
Table 63 Argentina Paper Market, 2022 - 2033, USD Million
Table 64 Argentina Plastic Market, 2022 - 2033, USD Million
Table 65 Argentina Inventory Tags Market Market by Technology, 2022 - 2033, USD Million
Table 66 Argentina Barcodes Market, 2022 - 2033, USD Million
Table 67 Argentina Other Technology Market, 2022 - 2033, USD Million
Table 68 Argentina QR Codes Market, 2022 - 2033, USD Million
Table 69 Argentina RFID Market, 2022 - 2033, USD Million
Table 70 United Arab Emirates Inventory Tags Market Market, 2022 - 2033, USD Million
Table 71 United Arab Emirates Inventory Tags Market Market by Application, 2022 - 2033, USD Million
Table 72 United Arab Emirates Asset Management Market, 2022 - 2033, USD Million
Table 73 United Arab Emirates Inventory Tracking & Monitoring Market, 2022 - 2033, USD Million
Table 74 United Arab Emirates Other Application Market, 2022 - 2033, USD Million
Table 75 United Arab Emirates Outdoor & Travel Safety Market, 2022 - 2033, USD Million
Table 76 United Arab Emirates Supply Chain Tracking & Visibility Market, 2022 - 2033, USD Million
Table 77 United Arab Emirates Inventory Tags Market Market by End Use, 2022 - 2033, USD Million
Table 78 United Arab Emirates Healthcare Market, 2022 - 2033, USD Million
Table 79 United Arab Emirates Manufacturing Market, 2022 - 2033, USD Million
Table 80 United Arab Emirates Other End Use Market, 2022 - 2033, USD Million
Table 81 United Arab Emirates Retail & E-commerce Market, 2022 - 2033, USD Million
Table 82 United Arab Emirates Transportation & Logistics Market, 2022 - 2033, USD Million
Table 83 United Arab Emirates Inventory Tags Market Market by Material Type, 2022 - 2033, USD Million
Table 84 United Arab Emirates Fabric Market, 2022 - 2033, USD Million
Table 85 United Arab Emirates Metal Market, 2022 - 2033, USD Million
Table 86 United Arab Emirates Paper Market, 2022 - 2033, USD Million
Table 87 United Arab Emirates Plastic Market, 2022 - 2033, USD Million
Table 88 United Arab Emirates Inventory Tags Market Market by Technology, 2022 - 2033, USD Million
Table 89 United Arab Emirates Barcodes Market, 2022 - 2033, USD Million
Table 90 United Arab Emirates Other Technology Market, 2022 - 2033, USD Million
Table 91 United Arab Emirates QR Codes Market, 2022 - 2033, USD Million
Table 92 United Arab Emirates RFID Market, 2022 - 2033, USD Million
Table 93 Saudi Arabia Inventory Tags Market Market, 2022 - 2033, USD Million
Table 94 Saudi Arabia Inventory Tags Market Market by Application, 2022 - 2033, USD Million
Table 95 Saudi Arabia Asset Management Market, 2022 - 2033, USD Million
Table 96 Saudi Arabia Inventory Tracking & Monitoring Market, 2022 - 2033, USD Million
Table 97 Saudi Arabia Other Application Market, 2022 - 2033, USD Million
Table 98 Saudi Arabia Outdoor & Travel Safety Market, 2022 - 2033, USD Million
Table 99 Saudi Arabia Supply Chain Tracking & Visibility Market, 2022 - 2033, USD Million
Table 100 Saudi Arabia Inventory Tags Market Market by End Use, 2022 - 2033, USD Million
Table 101 Saudi Arabia Healthcare Market, 2022 - 2033, USD Million
Table 102 Saudi Arabia Manufacturing Market, 2022 - 2033, USD Million
Table 103 Saudi Arabia Other End Use Market, 2022 - 2033, USD Million
Table 104 Saudi Arabia Retail & E-commerce Market, 2022 - 2033, USD Million
Table 105 Saudi Arabia Transportation & Logistics Market, 2022 - 2033, USD Million
Table 106 Saudi Arabia Inventory Tags Market Market by Material Type, 2022 - 2033, USD Million
Table 107 Saudi Arabia Fabric Market, 2022 - 2033, USD Million
Table 108 Saudi Arabia Metal Market, 2022 - 2033, USD Million
Table 109 Saudi Arabia Paper Market, 2022 - 2033, USD Million
Table 110 Saudi Arabia Plastic Market, 2022 - 2033, USD Million
Table 111 Saudi Arabia Inventory Tags Market Market by Technology, 2022 - 2033, USD Million
Table 112 Saudi Arabia Barcodes Market, 2022 - 2033, USD Million
Table 113 Saudi Arabia Other Technology Market, 2022 - 2033, USD Million
Table 114 Saudi Arabia QR Codes Market, 2022 - 2033, USD Million
Table 115 Saudi Arabia RFID Market, 2022 - 2033, USD Million
Table 116 South Africa Inventory Tags Market Market, 2022 - 2033, USD Million
Table 117 South Africa Inventory Tags Market Market by Application, 2022 - 2033, USD Million
Table 118 South Africa Asset Management Market, 2022 - 2033, USD Million
Table 119 South Africa Inventory Tracking & Monitoring Market, 2022 - 2033, USD Million
Table 120 South Africa Other Application Market, 2022 - 2033, USD Million
Table 121 South Africa Outdoor & Travel Safety Market, 2022 - 2033, USD Million
Table 122 South Africa Supply Chain Tracking & Visibility Market, 2022 - 2033, USD Million
Table 123 South Africa Inventory Tags Market Market by End Use, 2022 - 2033, USD Million
Table 124 South Africa Healthcare Market, 2022 - 2033, USD Million
Table 125 South Africa Manufacturing Market, 2022 - 2033, USD Million
Table 126 South Africa Other End Use Market, 2022 - 2033, USD Million
Table 127 South Africa Retail & E-commerce Market, 2022 - 2033, USD Million
Table 128 South Africa Transportation & Logistics Market, 2022 - 2033, USD Million
Table 129 South Africa Inventory Tags Market Market by Material Type, 2022 - 2033, USD Million
Table 130 South Africa Fabric Market, 2022 - 2033, USD Million
Table 131 South Africa Metal Market, 2022 - 2033, USD Million
Table 132 South Africa Paper Market, 2022 - 2033, USD Million
Table 133 South Africa Plastic Market, 2022 - 2033, USD Million
Table 134 South Africa Inventory Tags Market Market by Technology, 2022 - 2033, USD Million
Table 135 South Africa Barcodes Market, 2022 - 2033, USD Million
Table 136 South Africa Other Technology Market, 2022 - 2033, USD Million
Table 137 South Africa QR Codes Market, 2022 - 2033, USD Million
Table 138 South Africa RFID Market, 2022 - 2033, USD Million
Table 139 Nigeria Inventory Tags Market Market, 2022 - 2033, USD Million
Table 140 Nigeria Inventory Tags Market Market by Application, 2022 - 2033, USD Million
Table 141 Nigeria Asset Management Market, 2022 - 2033, USD Million
Table 142 Nigeria Inventory Tracking & Monitoring Market, 2022 - 2033, USD Million
Table 143 Nigeria Other Application Market, 2022 - 2033, USD Million
Table 144 Nigeria Outdoor & Travel Safety Market, 2022 - 2033, USD Million
Table 145 Nigeria Supply Chain Tracking & Visibility Market, 2022 - 2033, USD Million
Table 146 Nigeria Inventory Tags Market Market by End Use, 2022 - 2033, USD Million
Table 147 Nigeria Healthcare Market, 2022 - 2033, USD Million
Table 148 Nigeria Manufacturing Market, 2022 - 2033, USD Million
Table 149 Nigeria Other End Use Market, 2022 - 2033, USD Million
Table 150 Nigeria Retail & E-commerce Market, 2022 - 2033, USD Million
Table 151 Nigeria Transportation & Logistics Market, 2022 - 2033, USD Million
Table 152 Nigeria Inventory Tags Market Market by Material Type, 2022 - 2033, USD Million
Table 153 Nigeria Fabric Market, 2022 - 2033, USD Million
Table 154 Nigeria Metal Market, 2022 - 2033, USD Million
Table 155 Nigeria Paper Market, 2022 - 2033, USD Million
Table 156 Nigeria Plastic Market, 2022 - 2033, USD Million
Table 157 Nigeria Inventory Tags Market Market by Technology, 2022 - 2033, USD Million
Table 158 Nigeria Barcodes Market, 2022 - 2033, USD Million
Table 159 Nigeria Other Technology Market, 2022 - 2033, USD Million
Table 160 Nigeria QR Codes Market, 2022 - 2033, USD Million
Table 161 Nigeria RFID Market, 2022 - 2033, USD Million
Table 162 Rest of LAMEA Inventory Tags Market Market, 2022 - 2033, USD Million
Table 163 Rest of LAMEA Inventory Tags Market Market by Application, 2022 - 2033, USD Million
Table 164 Rest of LAMEA Asset Management Market, 2022 - 2033, USD Million
Table 165 Rest of LAMEA Inventory Tracking & Monitoring Market, 2022 - 2033, USD Million
Table 166 Rest of LAMEA Other Application Market, 2022 - 2033, USD Million
Table 167 Rest of LAMEA Outdoor & Travel Safety Market, 2022 - 2033, USD Million
Table 168 Rest of LAMEA Supply Chain Tracking & Visibility Market, 2022 - 2033, USD Million
Table 169 Rest of LAMEA Inventory Tags Market Market by End Use, 2022 - 2033, USD Million
Table 170 Rest of LAMEA Healthcare Market, 2022 - 2033, USD Million
Table 171 Rest of LAMEA Manufacturing Market, 2022 - 2033, USD Million
Table 172 Rest of LAMEA Other End Use Market, 2022 - 2033, USD Million
Table 173 Rest of LAMEA Retail & E-commerce Market, 2022 - 2033, USD Million
Table 174 Rest of LAMEA Transportation & Logistics Market, 2022 - 2033, USD Million
Table 175 Rest of LAMEA Inventory Tags Market Market by Material Type, 2022 - 2033, USD Million
Table 176 Rest of LAMEA Fabric Market, 2022 - 2033, USD Million
Table 177 Rest of LAMEA Metal Market, 2022 - 2033, USD Million
Table 178 Rest of LAMEA Paper Market, 2022 - 2033, USD Million
Table 179 Rest of LAMEA Plastic Market, 2022 - 2033, USD Million
Table 180 Rest of LAMEA Inventory Tags Market Market by Technology, 2022 - 2033, USD Million
Table 181 Rest of LAMEA Barcodes Market, 2022 - 2033, USD Million
Table 182 Rest of LAMEA Other Technology Market, 2022 - 2033, USD Million
Table 183 Rest of LAMEA QR Codes Market, 2022 - 2033, USD Million
Table 184 Rest of LAMEA RFID Market, 2022 - 2033, USD Million
List of Figures
FIG 1 Key Factors Impacting Market
FIG 2 Market Consolidation
FIG 3 Key Customer Criteria
FIG 4 Product Life Cycle
FIG 5 LAMEA Inventory Tags Market Market, 2022 - 2033, USD Million
FIG 6 LAMEA Inventory Tags Market Market by Application, 2022 - 2033, USD Million
FIG 7 LAMEA Asset Management Market, 2022 - 2033, USD Million
FIG 8 LAMEA Inventory Tracking & Monitoring Market, 2022 - 2033, USD Million
FIG 9 LAMEA Other Application Market, 2022 - 2033, USD Million
FIG 10 LAMEA Outdoor & Travel Safety Market, 2022 - 2033, USD Million
FIG 11 LAMEA Supply Chain Tracking & Visibility Market, 2022 - 2033, USD Million
FIG 12 LAMEA Inventory Tags Market Market by End Use, 2022 - 2033, USD Million
FIG 13 LAMEA Healthcare Market, 2022 - 2033, USD Million
FIG 14 LAMEA Manufacturing Market, 2022 - 2033, USD Million
FIG 15 LAMEA Other End Use Market, 2022 - 2033, USD Million
FIG 16 LAMEA Retail & E-commerce Market, 2022 - 2033, USD Million
FIG 17 LAMEA Transportation & Logistics Market, 2022 - 2033, USD Million
FIG 18 LAMEA Inventory Tags Market Market by Material Type, 2022 - 2033, USD Million
FIG 19 LAMEA Fabric Market, 2022 - 2033, USD Million
FIG 20 LAMEA Metal Market, 2022 - 2033, USD Million
FIG 21 LAMEA Paper Market, 2022 - 2033, USD Million
FIG 22 LAMEA Plastic Market, 2022 - 2033, USD Million
FIG 23 LAMEA Inventory Tags Market Market by Technology, 2022 - 2033, USD Million
FIG 24 LAMEA Barcodes Market, 2022 - 2033, USD Million
FIG 25 LAMEA Other Technology Market, 2022 - 2033, USD Million
FIG 26 LAMEA QR Codes Market, 2022 - 2033, USD Million
FIG 27 LAMEA RFID Market, 2022 - 2033, USD Million
FIG 28 Brazil Inventory Tags Market Market, 2022 - 2033, USD Million
FIG 29 Brazil Inventory Tags Market Market by Application, 2022 - 2033, USD Million
FIG 30 Brazil Asset Management Market, 2022 - 2033, USD Million
FIG 31 Brazil Inventory Tracking & Monitoring Market, 2022 - 2033, USD Million
FIG 32 Brazil Other Application Market, 2022 - 2033, USD Million
FIG 33 Brazil Outdoor & Travel Safety Market, 2022 - 2033, USD Million
FIG 34 Brazil Supply Chain Tracking & Visibility Market, 2022 - 2033, USD Million
FIG 35 Brazil Inventory Tags Market Market by End Use, 2022 - 2033, USD Million
FIG 36 Brazil Healthcare Market, 2022 - 2033, USD Million
FIG 37 Brazil Manufacturing Market, 2022 - 2033, USD Million
FIG 38 Brazil Other End Use Market, 2022 - 2033, USD Million
FIG 39 Brazil Retail & E-commerce Market, 2022 - 2033, USD Million
FIG 40 Brazil Transportation & Logistics Market, 2022 - 2033, USD Million
FIG 41 Brazil Inventory Tags Market Market by Material Type, 2022 - 2033, USD Million
FIG 42 Brazil Fabric Market, 2022 - 2033, USD Million
FIG 43 Brazil Metal Market, 2022 - 2033, USD Million
FIG 44 Brazil Paper Market, 2022 - 2033, USD Million
FIG 45 Brazil Plastic Market, 2022 - 2033, USD Million
FIG 46 Brazil Inventory Tags Market Market by Technology, 2022 - 2033, USD Million
FIG 47 Brazil Barcodes Market, 2022 - 2033, USD Million
FIG 48 Brazil Other Technology Market, 2022 - 2033, USD Million
FIG 49 Brazil QR Codes Market, 2022 - 2033, USD Million
FIG 50 Brazil RFID Market, 2022 - 2033, USD Million
FIG 51 Argentina Inventory Tags Market Market, 2022 - 2033, USD Million
FIG 52 Argentina Inventory Tags Market Market by Application, 2022 - 2033, USD Million
FIG 53 Argentina Asset Management Market, 2022 - 2033, USD Million
FIG 54 Argentina Inventory Tracking & Monitoring Market, 2022 - 2033, USD Million
FIG 55 Argentina Other Application Market, 2022 - 2033, USD Million
FIG 56 Argentina Outdoor & Travel Safety Market, 2022 - 2033, USD Million
FIG 57 Argentina Supply Chain Tracking & Visibility Market, 2022 - 2033, USD Million
FIG 58 Argentina Inventory Tags Market Market by End Use, 2022 - 2033, USD Million FIG 59 Argentina Healthcare Market, 2022 - 2033, USD Million
FIG 60 Argentina Manufacturing Market, 2022 - 2033, USD Million
FIG 61 Argentina Other End Use Market, 2022 - 2033, USD Million
FIG 62 Argentina Retail & E-commerce Market, 2022 - 2033, USD Million
FIG 63 Argentina Transportation & Logistics Market, 2022 - 2033, USD Million
FIG 64 Argentina Inventory Tags Market Market by Material Type, 2022 - 2033, USD Million
FIG 65 Argentina Fabric Market, 2022 - 2033, USD Million
FIG 66 Argentina Metal Market, 2022 - 2033, USD Million
FIG 67 Argentina Paper Market, 2022 - 2033, USD Million
FIG 68 Argentina Plastic Market, 2022 - 2033, USD Million
FIG 69 Argentina Inventory Tags Market Market by Technology, 2022 - 2033, USD Million
FIG 70 Argentina Barcodes Market, 2022 - 2033, USD Million
FIG 71 Argentina Other Technology Market, 2022 - 2033, USD Million
FIG 72 Argentina QR Codes Market, 2022 - 2033, USD Million
FIG 73 Argentina RFID Market, 2022 - 2033, USD Million
FIG 74 United Arab Emirates Inventory Tags Market Market, 2022 - 2033, USD Million
FIG 75 United Arab Emirates Inventory Tags Market Market by Application, 2022 - 2033, USD Million
FIG 76 United Arab Emirates Asset Management Market, 2022 - 2033, USD Million
FIG 77 United Arab Emirates Inventory Tracking & Monitoring Market, 2022 - 2033, USD Million
FIG 78 United Arab Emirates Other Application Market, 2022 - 2033, USD Million
FIG 79 United Arab Emirates Outdoor & Travel Safety Market, 2022 - 2033, USD Million
FIG 80 United Arab Emirates Supply Chain Tracking & Visibility Market, 2022 - 2033, USD Million
FIG 81 United Arab Emirates Inventory Tags Market Market by End Use, 2022 - 2033, USD Million
FIG 82 United Arab Emirates Healthcare Market, 2022 - 2033, USD Million
FIG 83 United Arab Emirates Manufacturing Market, 2022 - 2033, USD Million
FIG 84 United Arab Emirates Other End Use Market, 2022 - 2033, USD Million
FIG 85 United Arab Emirates Retail & E-commerce Market, 2022 - 2033, USD Million
FIG 86 United Arab Emirates Transportation & Logistics Market, 2022 - 2033, USD Million
FIG 87 United Arab Emirates Inventory Tags Market Market by Material Type, 2022 - 2033, USD Million
FIG 88 United Arab Emirates Fabric Market, 2022 - 2033, USD Million
FIG 89 United Arab Emirates Metal Market, 2022 - 2033, USD Million
FIG 90 United Arab Emirates Paper Market, 2022 - 2033, USD Million
FIG 91 United Arab Emirates Plastic Market, 2022 - 2033, USD Million
FIG 92 United Arab Emirates Inventory Tags Market Market by Technology, 2022 - 2033, USD Million
FIG 93 United Arab Emirates Barcodes Market, 2022 - 2033, USD Million
FIG 94 United Arab Emirates Other Technology Market, 2022 - 2033, USD Million
FIG 95 United Arab Emirates QR Codes Market, 2022 - 2033, USD Million
FIG 96 United Arab Emirates RFID Market, 2022 - 2033, USD Million
FIG 97 Saudi Arabia Inventory Tags Market Market, 2022 - 2033, USD Million
FIG 98 Saudi Arabia Inventory Tags Market Market by Application, 2022 - 2033, USD Million
FIG 99 Saudi Arabia Asset Management Market, 2022 - 2033, USD Million
FIG 100 Saudi Arabia Inventory Tracking & Monitoring Market, 2022 - 2033, USD Million
FIG 101 Saudi Arabia Other Application Market, 2022 - 2033, USD Million
FIG 102 Saudi Arabia Outdoor & Travel Safety Market, 2022 - 2033, USD Million
FIG 103 Saudi Arabia Supply Chain Tracking & Visibility Market, 2022 - 2033, USD Million
FIG 104 Saudi Arabia Inventory Tags Market Market by End Use, 2022 - 2033, USD Million
FIG 105 Saudi Arabia Healthcare Market, 2022 - 2033, USD Million
FIG 106 Saudi Arabia Manufacturing Market, 2022 - 2033, USD Million
FIG 107 Saudi Arabia Other End Use Market, 2022 - 2033, USD Million
FIG 108 Saudi Arabia Retail & E-commerce Market, 2022 - 2033, USD Million
FIG 109 Saudi Arabia Transportation & Logistics Market, 2022 - 2033, USD Million
FIG 110 Saudi Arabia Inventory Tags Market Market by Material Type, 2022 - 2033, USD Million
FIG 111 Saudi Arabia Fabric Market, 2022 - 2033, USD Million
FIG 112 Saudi Arabia Metal Market, 2022 - 2033, USD Million
FIG 113 Saudi Arabia Paper Market, 2022 - 2033, USD Million
FIG 114 Saudi Arabia Plastic Market, 2022 - 2033, USD Million
FIG 115 Saudi Arabia Inventory Tags Market Market by Technology, 2022 - 2033, USD Million
FIG 116 Saudi Arabia Barcodes Market, 2022 - 2033, USD Million
FIG 117 Saudi Arabia Other Technology Market, 2022 - 2033, USD Million
FIG 118 Saudi Arabia QR Codes Market, 2022 - 2033, USD Million
FIG 119 Saudi Arabia RFID Market, 2022 - 2033, USD Million
FIG 120 South Africa Inventory Tags Market Market, 2022 - 2033, USD Million
FIG 121 South Africa Inventory Tags Market Market by Application, 2022 - 2033, USD Million
FIG 122 South Africa Asset Management Market, 2022 - 2033, USD Million
FIG 123 South Africa Inventory Tracking & Monitoring Market, 2022 - 2033, USD Million
FIG 124 South Africa Other Application Market, 2022 - 2033, USD Million
FIG 125 South Africa Outdoor & Travel Safety Market, 2022 - 2033, USD Million
FIG 126 South Africa Supply Chain Tracking & Visibility Market, 2022 - 2033, USD Million
FIG 127 South Africa Inventory Tags Market Market by End Use, 2022 - 2033, USD Million
FIG 128 South Africa Healthcare Market, 2022 - 2033, USD Million
FIG 129 South Africa Manufacturing Market, 2022 - 2033, USD Million
FIG 130 South Africa Other End Use Market, 2022 - 2033, USD Million
FIG 131 South Africa Retail & E-commerce Market, 2022 - 2033, USD Million
FIG 132 South Africa Transportation & Logistics Market, 2022 - 2033, USD Million
FIG 133 South Africa Inventory Tags Market Market by Material Type, 2022 - 2033, USD Million
FIG 134 South Africa Fabric Market, 2022 - 2033, USD Million
FIG 135 South Africa Metal Market, 2022 - 2033, USD Million
FIG 136 South Africa Paper Market, 2022 - 2033, USD Million
FIG 137 South Africa Plastic Market, 2022 - 2033, USD Million
FIG 138 South Africa Inventory Tags Market Market by Technology, 2022 - 2033, USD Million
FIG 139 South Africa Barcodes Market, 2022 - 2033, USD Million
FIG 140 South Africa Other Technology Market, 2022 - 2033, USD Million
FIG 141 South Africa QR Codes Market, 2022 - 2033, USD Million
FIG 142 South Africa RFID Market, 2022 - 2033, USD Million
FIG 143 Nigeria Inventory Tags Market Market, 2022 - 2033, USD Million
FIG 144 Nigeria Inventory Tags Market Market by Application, 2022 - 2033, USD Million
FIG 145 Nigeria Asset Management Market, 2022 - 2033, USD Million
FIG 146 Nigeria Inventory Tracking & Monitoring Market, 2022 - 2033, USD Million
FIG 147 Nigeria Other Application Market, 2022 - 2033, USD Million
FIG 148 Nigeria Outdoor & Travel Safety Market, 2022 - 2033, USD Million
FIG 149 Nigeria Supply Chain Tracking & Visibility Market, 2022 - 2033, USD Million
FIG 150 Nigeria Inventory Tags Market Market by End Use, 2022 - 2033, USD Million
FIG 151 Nigeria Healthcare Market, 2022 - 2033, USD Million
FIG 152 Nigeria Manufacturing Market, 2022 - 2033, USD Million
FIG 153 Nigeria Other End Use Market, 2022 - 2033, USD Million
FIG 154 Nigeria Retail & E-commerce Market, 2022 - 2033, USD Million
FIG 155 Nigeria Transportation & Logistics Market, 2022 - 2033, USD Million
FIG 156 Nigeria Inventory Tags Market Market by Material Type, 2022 - 2033, USD Million
FIG 157 Nigeria Fabric Market, 2022 - 2033, USD Million
FIG 158 Nigeria Metal Market, 2022 - 2033, USD Million
FIG 159 Nigeria Paper Market, 2022 - 2033, USD Million
FIG 160 Nigeria Plastic Market, 2022 - 2033, USD Million
FIG 161 Nigeria Inventory Tags Market Market by Technology, 2022 - 2033, USD Million
FIG 162 Nigeria Barcodes Market, 2022 - 2033, USD Million
FIG 163 Nigeria Other Technology Market, 2022 - 2033, USD Million
FIG 164 Nigeria QR Codes Market, 2022 - 2033, USD Million
FIG 165 Nigeria RFID Market, 2022 - 2033, USD Million
FIG 166 Rest of LAMEA Inventory Tags Market Market, 2022 - 2033, USD Million
FIG 167 Rest of LAMEA Inventory Tags Market Market by Application, 2022 - 2033, USD Million
FIG 168 Rest of LAMEA Asset Management Market, 2022 - 2033, USD Million
FIG 169 Rest of LAMEA Inventory Tracking & Monitoring Market, 2022 - 2033, USD Million
FIG 170 Rest of LAMEA Other Application Market, 2022 - 2033, USD Million
FIG 171 Rest of LAMEA Outdoor & Travel Safety Market, 2022 - 2033, USD Million
FIG 172 Rest of LAMEA Supply Chain Tracking & Visibility Market, 2022 - 2033, USD Million
FIG 173 Rest of LAMEA Inventory Tags Market Market by End Use, 2022 - 2033, USD Million
FIG 174 Rest of LAMEA Healthcare Market, 2022 - 2033, USD Million
FIG 175 Rest of LAMEA Manufacturing Market, 2022 - 2033, USD Million
FIG 176 Rest of LAMEA Other End Use Market, 2022 - 2033, USD Million
FIG 177 Rest of LAMEA Retail & E-commerce Market, 2022 - 2033, USD Million
FIG 178 Rest of LAMEA Transportation & Logistics Market, 2022 - 2033, USD Million
FIG 179 Rest of LAMEA Inventory Tags Market Market by Material Type, 2022 - 2033, USD Million
FIG 180 Rest of LAMEA Fabric Market, 2022 - 2033, USD Million
FIG 181 Rest of LAMEA Metal Market, 2022 - 2033, USD Million
FIG 182 Rest of LAMEA Paper Market, 2022 - 2033, USD Million
FIG 183 Rest of LAMEA Plastic Market, 2022 - 2033, USD Million
FIG 184 Rest of LAMEA Inventory Tags Market Market by Technology, 2022 - 2033, USD Million
FIG 185 Rest of LAMEA Barcodes Market, 2022 - 2033, USD Million
FIG 186 Rest of LAMEA Other Technology Market, 2022 - 2033, USD Million
FIG 187 Rest of LAMEA QR Codes Market, 2022 - 2033, USD Million
FIG 188 Rest of LAMEA RFID Market, 2022 - 2033, USD Million