LAMEA Digital Workplace Market Size, Share & Industry Analysis Report By Component (Solutions, and Services), By Organization Size (Large Enterprises, and Small and Medium-sized Enterprises (SMEs)), By End-use (BFSI, Retail & Consumer Goods, Healthcare & Pharmaceuticals, and IT & Telecommunication), By Country Outlook and Forecast, 2026 - 2033
Published Date : 02-Sep-2026 |
Pages: 262 |
Report Format: PDF + Excel |
COVID-19 Impact on the LAMEA Digital Workplace Market
The LAMEA Digital Workplace Market is expected to reach USD 12.2 billion by 2029, growing at a CAGR of 25% during (2026 – 2033).
The LAMEA Digital Workplace Market developed as organizations across Latin America, the Middle East, and Africa began adopting digital tools to improve productivity across dispersed and multilingual workforces. Early adoption centered on basic communication platforms, email systems, intranets, and localized collaboration tools that helped businesses overcome geographic barriers. Over time, broadband expansion, cloud computing, mobile technologies, unified communications, and document management platforms shifted the market toward more integrated digital ecosystems. The rise of cloud services enabled scalable and cost-effective workplace modernization across organizations with different maturity levels.
The LAMEA Digital Workplace Market is being shaped by hybrid work adoption, AI-powered automation, cybersecurity needs, workforce upskilling, cloud migration, and localized digital transformation programs. Organizations are deploying collaboration platforms, secure remote access, workflow automation, cloud productivity suites, employee experience tools, and digital analytics to improve agility and productivity. Demand is supported by public-sector modernization, fintech expansion, telecom infrastructure growth, healthcare digitization, and enterprise mobility across emerging economies. Vendors are focusing on multilingual capabilities, local compliance, mobile-first design, scalable SaaS delivery, and stronger security frameworks.
Component Outlook
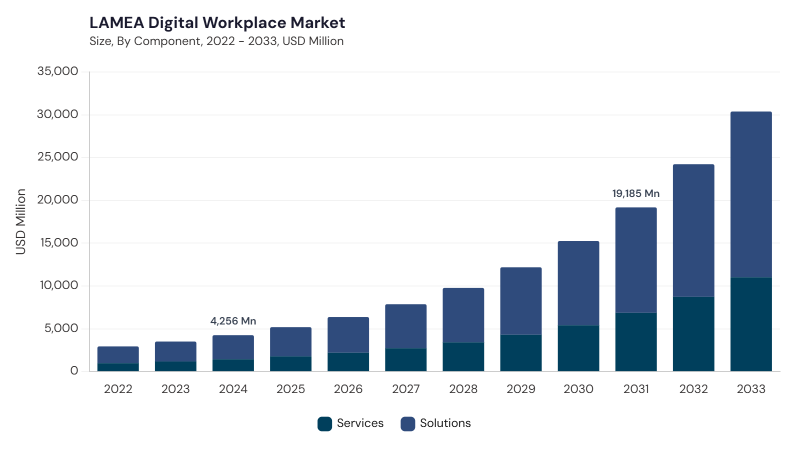
Based on Component, the market is segmented into Solutions and Services. The Solutions market dominated the LAMEA Digital Workplace Market by Component in 2025, and would continue to be a dominant market till 2033; thereby, achieving a market value of USD 7.9 billion by 2029, growing at a CAGR of 24.5 % during the forecast period. Additionally, The Services market is expected to witness highest CAGR of 25.9% during (2026 - 2033).
Solutions lead due to rising adoption of cloud collaboration platforms, enterprise communication suites, document management systems, virtual desktop tools, workflow automation, and AI-enabled productivity applications. These solutions help organizations support remote work, hybrid operations, real-time collaboration, secure information sharing, and digital workforce engagement. Services remain important as enterprises require consulting, implementation, integration, managed support, workforce training, and change management to maximize the value of digital workplace investments. Service demand is also supported by uneven IT maturity, cybersecurity requirements, legacy migration, localization needs, and ongoing support for cloud-based workplace ecosystems.
Organization Size Outlook
Based on Organization Size, the market is segmented into Large Enterprises and Small and Medium-sized Enterprises (SMEs). The Large Enterprises market dominated the LAMEA Digital Workplace Market by Organization Size in 2025, and would continue to be a dominant market till 2033; thereby, achieving a market value of USD 7.6 billion by 2029, growing at a CAGR of 24.5 % during the forecast period. Additionally, The Small and Medium-sized Enterprises (SMEs) market is expected to witness highest CAGR of 25.8% during (2026 - 2033).
Large Enterprises lead due to higher investments in cloud infrastructure, cybersecurity, enterprise communication platforms, AI-enabled workplace systems, and distributed workforce management. These organizations use digital workplace solutions to support complex operations, secure collaboration, compliance, workflow automation, employee analytics, and integration with enterprise applications across multiple locations. SMEs are adopting digital workplace platforms through affordable SaaS subscriptions, improving internet accessibility, mobile-first tools, and national digital transformation initiatives. Their demand is supported by remote collaboration needs, document sharing, customer communication, basic automation, cost control, and the need to remain competitive with limited IT resources.
End-use Outlook
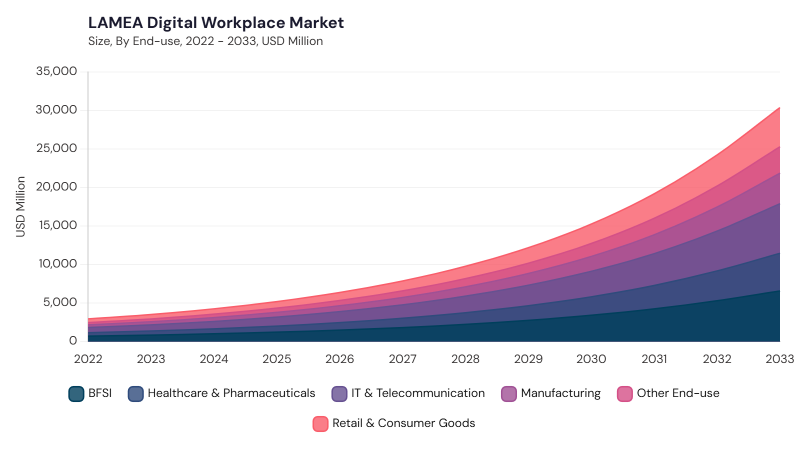
Based on End-use, the market is segmented into BFSI, IT & Telecommunication, Retail & Consumer Goods, Healthcare & Pharmaceuticals, Manufacturing, and Other End-use. BFSI leads due to digital banking growth, fintech expansion, secure collaboration, regulatory compliance, customer data protection, and remote financial service delivery. IT & Telecommunication follows due to broadband expansion, cloud service growth, network operations, software delivery, and the need for connected teams across geographically distributed locations.
Retail & Consumer Goods uses digital workplace tools for e-commerce coordination, omnichannel operations, workforce communication, logistics visibility, and customer engagement. Healthcare & Pharmaceuticals, Manufacturing, and Other End-use areas add demand through telemedicine, clinical collaboration, connected production, industrial coordination, education, public administration, hospitality, professional services, and energy-sector digital workflows.
Free Valuable Insights: Digital Workplace Market Size Worth USD 306.8 Billion billion by 2033
Country Outlook
Based on Country, the market is segmented into Brazil, Argentina, UAE, Saudi Arabia, South Africa, Nigeria, and Rest of LAMEA. The Brazil market dominated the LAMEA Digital Workplace Market by Country in 2025, and would continue to be a dominant market till 2033; thereby, achieving a market value of USD 3.1 billion by 2029, growing at a CAGR of 23.4 % during the forecast period. The Argentina market is expected to witness a CAGR of 25.8% during (2026 - 2033). Additionally, The UAE market is expected to witness a CAGR of 23.9% during (2026 - 2033).
Brazil leads due to hybrid work adoption, cloud collaboration, AI readiness, cybersecurity investment, and rising demand for localized workplace solutions across finance, telecom, and enterprise sectors. Argentina supports market growth through cloud-based collaboration, workforce-centric platforms, AI automation, localized compliance, and hybrid work enablement. The UAE contributes through smart government programs, cloud-native workplace modernization, AI adoption, cybersecurity frameworks, and advanced digital infrastructure. Saudi Arabia, South Africa, and Nigeria add momentum through national digital strategies, mobile-first platforms, workforce upskilling, fintech growth, cloud adoption, and secure collaboration needs, while Rest of LAMEA benefits from digital inclusion, remote work expansion, and localized workplace modernization.
List of Key Companies Profiled
- Microsoft Corporation
- Google LLC (Alphabet Inc.)
- Cisco Systems, Inc.
- Salesforce, Inc.
- IBM Corporation
- ServiceNow, Inc.
- Zoom Communications, Inc.
- Citrix Systems, Inc. (Cloud Software Group)
- VMware LLC (Broadcom Inc.)
- Atos SE
LAMEA Digital Workplace Market Report Segmentation
By Component
- Solutions
- Services
By Organization Size
- Large Enterprises
- Small and Medium-sized Enterprises (SMEs)
By End-use
- BFSI
- IT & Telecommunication
- Retail & Consumer Goods
- Healthcare & Pharmaceuticals
- Manufacturing
- Other End-use
By Country
- Brazil
- Argentina
- UAE
- Saudi Arabia
- South Africa
- Nigeria
- Rest of LAMEA
1.1 Market Overview
1.2 Key Factors Impacting Market
1.2.1 Market Drivers
1.2.2 Market Restraints
1.2.3 Market Opportunities
1.2.4 Market Challenges
1.2.5 Market Trends
1.2.6 State of Competition
1.2.7 Market Consolidation
1.2.8 Key Customer Criteria
1.3 Product Life Cycle
1.4 Segmentation By Product
1.4.1 Paper
1.4.2 Plastic
1.4.3 Other Product
1.5 Segmentation By End-use
1.5.1 Commercial
1.5.2 Institutional
1.5.3 Household
1.6 Segmentation By Country
1.6.1 Brazil
1.6.1.1 Segmentation By Product
1.6.1.1.1 Paper
1.6.1.1.2 Plastic
1.6.1.1.3 Other Product
1.6.1.2 Segmentation By End-use
1.6.1.2.1 Commercial
1.6.1.2.2 Institutional
1.6.1.2.3 Household
1.6.2 Argentina
1.6.2.1 Segmentation By Product
1.6.2.1.1 Paper
1.6.2.1.2 Plastic
1.6.2.1.3 Other Product
1.6.2.2 Segmentation By End-use
1.6.2.2.1 Commercial
1.6.2.2.2 Institutional
1.6.2.2.3 Household
1.6.3 UAE
1.6.3.1 Segmentation By Product
1.6.3.1.1 Paper
1.6.3.1.2 Plastic
1.6.3.1.3 Other Product
1.6.3.2 Segmentation By End-use
1.6.3.2.1 Commercial
1.6.3.2.2 Institutional
1.6.3.2.3 Household
1.6.4 Saudi Arabia
1.6.4.1 Segmentation By Product
1.6.4.1.1 Paper
1.6.4.1.2 Plastic
1.6.4.1.3 Other Product
1.6.4.2 Segmentation By End-use
1.6.4.2.1 Commercial
1.6.4.2.2 Institutional
1.6.4.2.3 Household
1.6.5 South Africa
1.6.5.1 Segmentation By Product
1.6.5.1.1 Paper
1.6.5.1.2 Plastic
1.6.5.1.3 Other Product
1.6.5.2 Segmentation By End-use
1.6.5.2.1 Commercial
1.6.5.2.2 Institutional
1.6.5.2.3 Household
1.6.6 Nigeria
1.6.6.1 Segmentation By Product
1.6.6.1.1 Paper
1.6.6.1.2 Plastic
1.6.6.1.3 Other Product
1.6.6.2 Segmentation By End-use
1.6.6.2.1 Commercial
1.6.6.2.2 Institutional
1.6.6.2.3 Household
1.6.7 Rest of LAMEA
1.6.7.1 Segmentation By Product
1.6.7.1.1 Paper
1.6.7.1.2 Plastic
1.6.7.1.3 Other Product
1.6.7.2 Segmentation By End-use
1.6.7.2.1 Commercial
1.6.7.2.2 Institutional
1.6.7.2.3 Household
Chapter 2. Company Snapshots
2.1 Dart Container Corporation
2.1.1 Business Overview
2.1.2 Key Information
2.1.3 Company Focus on the Disposable Cups Market
2.1.4 Strategic Insights
2.1.5 Strategy Deployed
2.1.6 Product & Service Portfolio
2.1.7 Representative Products
2.1.8 Capability Overview
2.1.9 Technology & Innovation Focus
2.1.10 SWOT Analysis
2.1.11 Customers / End Users
2.1.12 Competitive Positioning
2.1.13 Key Differentiators
2.1.14 Portfolio Matrix
2.1.15 Analyst View
2.1.16 Future Outlook
2.2 Huhtamäki Oyj
2.2.1 Business Overview
2.2.2 Key Information
2.2.3 Company Focus on the Disposable Cups Market
2.2.4 Strategic Insights
2.2.5 Strategy Deployed
2.2.6 Product & Service Portfolio
2.2.7 Representative Products
2.2.8 Capability Overview
2.2.9 Technology & Innovation Focus
2.2.10 SWOT Analysis
2.2.11 Customers / End Users
2.2.12 Competitive Positioning
2.2.13 Key Differentiators
2.2.14 Portfolio Matrix
2.2.15 Analyst View
2.2.16 Future Outlook
2.3 Novolex Holdings LLC
2.3.1 Business Overview
2.3.2 Key Information
2.3.3 Company Focus on the Disposable Cups Market
2.3.4 Strategic Insights
2.3.5 Strategy Deployed
2.3.6 Product & Service Portfolio
2.3.7 Representative Products
2.3.8 Capability Overview
2.3.9 Technology & Innovation Focus
2.3.10 SWOT Analysis
2.3.11 Customers / End Users
2.3.12 Competitive Positioning
2.3.13 Key Differentiators
2.3.14 Portfolio Matrix
2.3.15 Analyst View
2.3.16 Future Outlook
2.4 Graphic Packaging Holding Company
2.4.1 Business Overview
2.4.2 Key Information
2.4.3 Company Focus on the Disposable Cups Market
2.4.4 Strategic Insights
2.4.5 Strategy Deployed
2.4.6 Product & Service Portfolio
2.4.7 Representative Products
2.4.8 Capability Overview
2.4.9 Technology & Innovation Focus
2.4.10 SWOT Analysis
2.4.11 Customers / End Users
2.4.12 Competitive Positioning
2.4.13 Key Differentiators
2.4.14 Portfolio Matrix
2.4.15 Analyst View
2.4.16 Future Outlook
2.5 Georgia-Pacific LLC
2.5.1 Business Overview
2.5.2 Key Information
2.5.3 Company Focus on the Disposable Cups Market
2.5.4 Strategic Insights
2.5.5 Strategy Deployed
2.5.6 Product & Service Portfolio
2.5.7 Representative Products
2.5.8 Capability Overview
2.5.9 Technology & Innovation Focus
2.5.10 SWOT Analysis
2.5.11 Customers / End Users
2.5.12 Competitive Positioning
2.5.13 Key Differentiators
2.5.14 Portfolio Matrix
2.5.15 Analyst View
2.5.16 Future Outlook
2.6 Seda International Packaging Group
2.6.1 Business Overview
2.6.2 Key Information
2.6.3 Company Focus on the Disposable Cups Market
2.6.4 Strategic Insights
2.6.5 Strategy Deployed
2.6.6 Product & Service Portfolio
2.6.7 Representative Products
2.6.8 Capability Overview
2.6.9 Technology & Innovation Focus
2.6.10 SWOT Analysis
2.6.11 Customers / End Users
2.6.12 Competitive Positioning
2.6.13 Key Differentiators
2.6.14 Portfolio Matrix
2.6.15 Analyst View
2.6.16 Future Outlook
2.7 WinCup, Inc.
2.7.1 Business Overview
2.7.2 Key Information
2.7.3 Company Focus on the Disposable Cups Market
2.7.4 Strategic Insights
2.7.5 Strategy Deployed
2.7.6 Product & Service Portfolio
2.7.7 Representative Products
2.7.8 Capability Overview
2.7.9 Technology & Innovation Focus
2.7.10 SWOT Analysis
2.7.11 Customers / End Users
2.7.12 Competitive Positioning
2.7.13 Key Differentiators
2.7.14 Portfolio Matrix
2.7.15 Analyst View
2.7.16 Future Outlook
2.8 Detpak (Detmold Group)
2.8.1 Business Overview
2.8.2 Key Information
2.8.3 Company Focus on the Disposable Cups Market
2.8.4 Strategic Insights
2.8.5 Strategy Deployed
2.8.6 Product & Service Portfolio
2.8.7 Representative Products
2.8.8 Capability Overview
2.8.9 Technology & Innovation Focus
2.8.10 SWOT Analysis
2.8.11 Customers / End Users
2.8.12 Competitive Positioning
2.8.13 Key Differentiators
2.8.14 Portfolio Matrix
2.8.15 Analyst View
2.8.16 Future Outlook
2.9 Go-Pak Group
2.9.1 Business Overview
2.9.2 Key Information
2.9.3 Company Focus on the Disposable Cups Market
2.9.4 Strategic Insights
2.9.5 Strategy Deployed
2.9.6 Product & Service Portfolio
2.9.7 Representative Products
2.9.8 Capability Overview
2.9.9 Technology & Innovation Focus
2.9.10 SWOT Analysis
2.9.11 Customers / End Users
2.9.12 Competitive Positioning
2.9.13 Key Differentiators
2.9.14 Portfolio Matrix
2.9.15 Analyst View
2.9.16 Future Outlook
2.10 Benders Paper Cup Company
2.10.1 Business Overview
2.10.2 Key Information
2.10.3 Company Focus on the Disposable Cups Market
2.10.4 Strategic Insights
2.10.5 Strategy Deployed 2.10.6 Product & Service Portfolio
2.10.7 Representative Products
2.10.8 Capability Overview
2.10.9 Technology & Innovation Focus
2.10.10 SWOT Analysis
2.10.11 Customers / End Users
2.10.12 Competitive Positioning
2.10.13 Key Differentiators
2.10.14 Portfolio Matrix
2.10.15 Analyst View
2.10.16 Future Outlook
Table 1 LAMEA Disposable Cups Market Market, 2022 - 2033, USD Million
Table 2 LAMEA Disposable Cups Market Market by End-use, 2022 - 2033, USD Million
Table 3 LAMEA Commercial Market, 2022 - 2033, USD Million
Table 4 LAMEA Household Market, 2022 - 2033, USD Million
Table 5 LAMEA Institutional Market, 2022 - 2033, USD Million
Table 6 LAMEA Disposable Cups Market Market by Product, 2022 - 2033, USD Million
Table 7 LAMEA Other Product Market, 2022 - 2033, USD Million
Table 8 LAMEA Paper Market, 2022 - 2033, USD Million
Table 9 LAMEA Plastic Market, 2022 - 2033, USD Million
Table 10 Brazil Disposable Cups Market Market, 2022 - 2033, USD Million
Table 11 Brazil Disposable Cups Market Market by End-use, 2022 - 2033, USD Million
Table 12 Brazil Commercial Market, 2022 - 2033, USD Million
Table 13 Brazil Household Market, 2022 - 2033, USD Million
Table 14 Brazil Institutional Market, 2022 - 2033, USD Million
Table 15 Brazil Disposable Cups Market Market by Product, 2022 - 2033, USD Million
Table 16 Brazil Other Product Market, 2022 - 2033, USD Million
Table 17 Brazil Paper Market, 2022 - 2033, USD Million
Table 18 Brazil Plastic Market, 2022 - 2033, USD Million
Table 19 Argentina Disposable Cups Market Market, 2022 - 2033, USD Million
Table 20 Argentina Disposable Cups Market Market by End-use, 2022 - 2033, USD Million
Table 21 Argentina Commercial Market, 2022 - 2033, USD Million
Table 22 Argentina Household Market, 2022 - 2033, USD Million
Table 23 Argentina Institutional Market, 2022 - 2033, USD Million
Table 24 Argentina Disposable Cups Market Market by Product, 2022 - 2033, USD Million
Table 25 Argentina Other Product Market, 2022 - 2033, USD Million
Table 26 Argentina Paper Market, 2022 - 2033, USD Million
Table 27 Argentina Plastic Market, 2022 - 2033, USD Million
Table 28 United Arab Emirates Disposable Cups Market Market, 2022 - 2033, USD Million
Table 29 United Arab Emirates Disposable Cups Market Market by End-use, 2022 - 2033, USD Million
Table 30 United Arab Emirates Commercial Market, 2022 - 2033, USD Million
Table 31 United Arab Emirates Household Market, 2022 - 2033, USD Million
Table 32 United Arab Emirates Institutional Market, 2022 - 2033, USD Million
Table 33 United Arab Emirates Disposable Cups Market Market by Product, 2022 - 2033, USD Million
Table 34 United Arab Emirates Other Product Market, 2022 - 2033, USD Million
Table 35 United Arab Emirates Paper Market, 2022 - 2033, USD Million
Table 36 United Arab Emirates Plastic Market, 2022 - 2033, USD Million
Table 37 Saudi Arabia Disposable Cups Market Market, 2022 - 2033, USD Million
Table 38 Saudi Arabia Disposable Cups Market Market by End-use, 2022 - 2033, USD Million
Table 39 Saudi Arabia Commercial Market, 2022 - 2033, USD Million
Table 40 Saudi Arabia Household Market, 2022 - 2033, USD Million
Table 41 Saudi Arabia Institutional Market, 2022 - 2033, USD Million
Table 42 Saudi Arabia Disposable Cups Market Market by Product, 2022 - 2033, USD Million
Table 43 Saudi Arabia Other Product Market, 2022 - 2033, USD Million
Table 44 Saudi Arabia Paper Market, 2022 - 2033, USD Million
Table 45 Saudi Arabia Plastic Market, 2022 - 2033, USD Million
Table 46 South Africa Disposable Cups Market Market, 2022 - 2033, USD Million
Table 47 South Africa Disposable Cups Market Market by End-use, 2022 - 2033, USD Million
Table 48 South Africa Commercial Market, 2022 - 2033, USD Million
Table 49 South Africa Household Market, 2022 - 2033, USD Million
Table 50 South Africa Institutional Market, 2022 - 2033, USD Million
Table 51 South Africa Disposable Cups Market Market by Product, 2022 - 2033, USD Million
Table 52 South Africa Other Product Market, 2022 - 2033, USD Million
Table 53 South Africa Paper Market, 2022 - 2033, USD Million
Table 54 South Africa Plastic Market, 2022 - 2033, USD Million
Table 55 Nigeria Disposable Cups Market Market, 2022 - 2033, USD Million
Table 56 Nigeria Disposable Cups Market Market by End-use, 2022 - 2033, USD Million
Table 57 Nigeria Commercial Market, 2022 - 2033, USD Million
Table 58 Nigeria Household Market, 2022 - 2033, USD Million
Table 59 Nigeria Institutional Market, 2022 - 2033, USD Million
Table 60 Nigeria Disposable Cups Market Market by Product, 2022 - 2033, USD Million
Table 61 Nigeria Other Product Market, 2022 - 2033, USD Million
Table 62 Nigeria Paper Market, 2022 - 2033, USD Million
Table 63 Nigeria Plastic Market, 2022 - 2033, USD Million
Table 64 Rest of LAMEA Disposable Cups Market Market, 2022 - 2033, USD Million
Table 65 Rest of LAMEA Disposable Cups Market Market by End-use, 2022 - 2033, USD Million
Table 66 Rest of LAMEA Commercial Market, 2022 - 2033, USD Million
Table 67 Rest of LAMEA Household Market, 2022 - 2033, USD Million
Table 68 Rest of LAMEA Institutional Market, 2022 - 2033, USD Million
Table 69 Rest of LAMEA Disposable Cups Market Market by Product, 2022 - 2033, USD Million
Table 70 Rest of LAMEA Other Product Market, 2022 - 2033, USD Million
Table 71 Rest of LAMEA Paper Market, 2022 - 2033, USD Million
Table 72 Rest of LAMEA Plastic Market, 2022 - 2033, USD Million
List of Figures
FIG 1 Key Factors Impacting Market
FIG 2 Market Consolidation
FIG 3 Key Customer Criteria
FIG 4 Product Life Cycle
FIG 5 LAMEA Disposable Cups Market Market, 2022 - 2033, USD Million
FIG 6 LAMEA Disposable Cups Market Market by End-use, 2022 - 2033, USD Million
FIG 7 LAMEA Commercial Market, 2022 - 2033, USD Million
FIG 8 LAMEA Household Market, 2022 - 2033, USD Million
FIG 9 LAMEA Institutional Market, 2022 - 2033, USD Million
FIG 10 LAMEA Disposable Cups Market Market by Product, 2022 - 2033, USD Million
FIG 11 LAMEA Other Product Market, 2022 - 2033, USD Million
FIG 12 LAMEA Paper Market, 2022 - 2033, USD Million
FIG 13 LAMEA Plastic Market, 2022 - 2033, USD Million
FIG 14 Brazil Disposable Cups Market Market, 2022 - 2033, USD Million
FIG 15 Brazil Disposable Cups Market Market by End-use, 2022 - 2033, USD Million
FIG 16 Brazil Commercial Market, 2022 - 2033, USD Million
FIG 17 Brazil Household Market, 2022 - 2033, USD Million
FIG 18 Brazil Institutional Market, 2022 - 2033, USD Million
FIG 19 Brazil Disposable Cups Market Market by Product, 2022 - 2033, USD Million
FIG 20 Brazil Other Product Market, 2022 - 2033, USD Million
FIG 21 Brazil Paper Market, 2022 - 2033, USD Million
FIG 22 Brazil Plastic Market, 2022 - 2033, USD Million
FIG 23 Argentina Disposable Cups Market Market, 2022 - 2033, USD Million
FIG 24 Argentina Disposable Cups Market Market by End-use, 2022 - 2033, USD Million
FIG 25 Argentina Commercial Market, 2022 - 2033, USD Million
FIG 26 Argentina Household Market, 2022 - 2033, USD Million
FIG 27 Argentina Institutional Market, 2022 - 2033, USD Million
FIG 28 Argentina Disposable Cups Market Market by Product, 2022 - 2033, USD Million
FIG 29 Argentina Other Product Market, 2022 - 2033, USD Million
FIG 30 Argentina Paper Market, 2022 - 2033, USD Million
FIG 31 Argentina Plastic Market, 2022 - 2033, USD Million
FIG 32 United Arab Emirates Disposable Cups Market Market, 2022 - 2033, USD Million
FIG 33 United Arab Emirates Disposable Cups Market Market by End-use, 2022 - 2033, USD Million
FIG 34 United Arab Emirates Commercial Market, 2022 - 2033, USD Million
FIG 35 United Arab Emirates Household Market, 2022 - 2033, USD Million
FIG 36 United Arab Emirates Institutional Market, 2022 - 2033, USD Million
FIG 37 United Arab Emirates Disposable Cups Market Market by Product, 2022 - 2033, USD Million
FIG 38 United Arab Emirates Other Product Market, 2022 - 2033, USD Million
FIG 39 United Arab Emirates Paper Market, 2022 - 2033, USD Million
FIG 40 United Arab Emirates Plastic Market, 2022 - 2033, USD Million
FIG 41 Saudi Arabia Disposable Cups Market Market, 2022 - 2033, USD Million
FIG 42 Saudi Arabia Disposable Cups Market Market by End-use, 2022 - 2033, USD Million
FIG 43 Saudi Arabia Commercial Market, 2022 - 2033, USD Million
FIG 44 Saudi Arabia Household Market, 2022 - 2033, USD Million
FIG 45 Saudi Arabia Institutional Market, 2022 - 2033, USD Million
FIG 46 Saudi Arabia Disposable Cups Market Market by Product, 2022 - 2033, USD Million
FIG 47 Saudi Arabia Other Product Market, 2022 - 2033, USD Million
FIG 48 Saudi Arabia Paper Market, 2022 - 2033, USD Million
FIG 49 Saudi Arabia Plastic Market, 2022 - 2033, USD Million
FIG 50 South Africa Disposable Cups Market Market, 2022 - 2033, USD Million
FIG 51 South Africa Disposable Cups Market Market by End-use, 2022 - 2033, USD Million
FIG 52 South Africa Commercial Market, 2022 - 2033, USD Million
FIG 53 South Africa Household Market, 2022 - 2033, USD Million
FIG 54 South Africa Institutional Market, 2022 - 2033, USD Million
FIG 55 South Africa Disposable Cups Market Market by Product, 2022 - 2033, USD Million
FIG 56 South Africa Other Product Market, 2022 - 2033, USD Million
FIG 57 South Africa Paper Market, 2022 - 2033, USD Million
FIG 58 South Africa Plastic Market, 2022 - 2033, USD Million
FIG 59 Nigeria Disposable Cups Market Market, 2022 - 2033, USD Million
FIG 60 Nigeria Disposable Cups Market Market by End-use, 2022 - 2033, USD Million
FIG 61 Nigeria Commercial Market, 2022 - 2033, USD Million
FIG 62 Nigeria Household Market, 2022 - 2033, USD Million
FIG 63 Nigeria Institutional Market, 2022 - 2033, USD Million
FIG 64 Nigeria Disposable Cups Market Market by Product, 2022 - 2033, USD Million
FIG 65 Nigeria Other Product Market, 2022 - 2033, USD Million
FIG 66 Nigeria Paper Market, 2022 - 2033, USD Million
FIG 67 Nigeria Plastic Market, 2022 - 2033, USD Million
FIG 68 Rest of LAMEA Disposable Cups Market Market, 2022 - 2033, USD Million
FIG 69 Rest of LAMEA Disposable Cups Market Market by End-use, 2022 - 2033, USD Million
FIG 70 Rest of LAMEA Commercial Market, 2022 - 2033, USD Million
FIG 71 Rest of LAMEA Household Market, 2022 - 2033, USD Million
FIG 72 Rest of LAMEA Institutional Market, 2022 - 2033, USD Million
FIG 73 Rest of LAMEA Disposable Cups Market Market by Product, 2022 - 2033, USD Million
FIG 74 Rest of LAMEA Other Product Market, 2022 - 2033, USD Million
FIG 75 Rest of LAMEA Paper Market, 2022 - 2033, USD Million
FIG 76 Rest of LAMEA Plastic Market, 2022 - 2033, USD Million