The sample copy of this report is available for access.
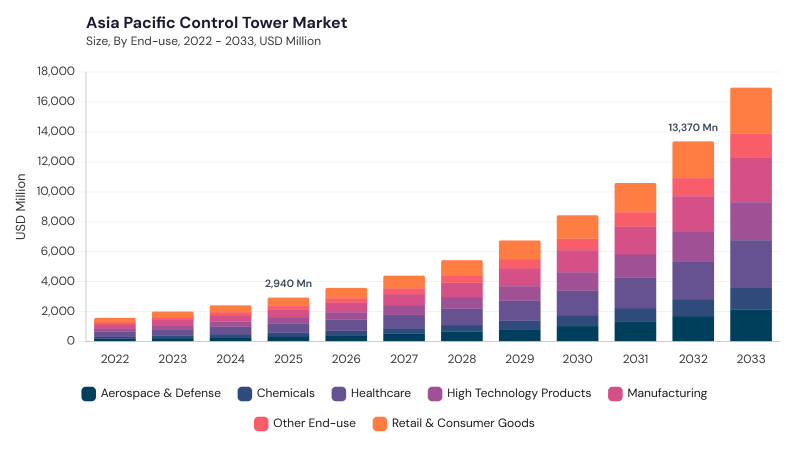
The Asia Pacific Control Tower Market is expected to reach USD 8.4 billion by 2030, growing at a CAGR of 24.8% during (2026 – 2033).
The Asia Pacific Control Tower Market evolved as supply chains became more regionalized, digitized, and globally connected across manufacturing, logistics, retail, and healthcare sectors. Early control towers mainly worked as centralized visibility centers, using basic data aggregation and manual oversight to monitor shipments, inventory, and operational activities. With the rise of cloud computing, IoT, artificial intelligence, and advanced analytics, these systems gradually shifted into intelligent coordination platforms. Expanding trade corridors, e-commerce growth, smart manufacturing, and cross-border logistics increased the need for stronger operational control.
The Asia Pacific Control Tower Market is being shaped by rapid industrialization, urbanization, digital supply chain transformation, sustainability priorities, and demand for end-to-end operational visibility. Organizations are using control towers to manage supplier coordination, shipment tracking, demand forecasting, inventory planning, transportation monitoring, and disruption response. Demand is supported by AI-enabled analytics, IoT-based data capture, 5G connectivity, cloud deployment, digital trust frameworks, and regional collaborative supply chain networks. Vendors are focusing on scalable platforms, local compliance support, cybersecurity, data integration, ESG tracking, and mobile-accessible dashboards.
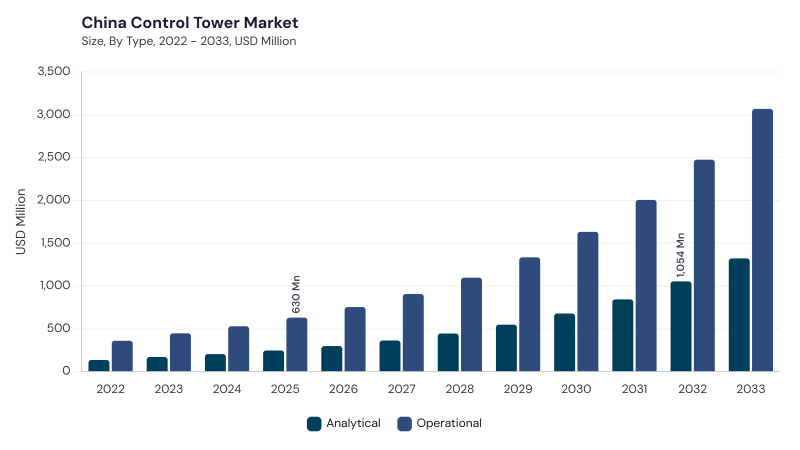
Based on Type, the market is segmented into Operational and Analytical. The Operational market dominated the Asia Pacific Control Tower Market by Type in 2025, and would continue to be a dominant market till 2033; thereby, achieving a market value of USD 6.0 billion by 2030, growing at a CAGR of 24.4 % during the forecast period. Additionally, The Analytical market is expected to witness highest CAGR of 25.9% during (2026 - 2033).
Operational control towers lead due to their strong role in real-time execution, shipment monitoring, inventory visibility, warehouse coordination, and exception handling across complex regional supply chains. They help enterprises manage transportation, manufacturing, order fulfillment, and supplier activities through centralized dashboards and automated alerts. Analytical control towers remain important as companies increasingly need predictive forecasting, risk modeling, demand planning, and scenario analysis. This segment benefits from AI, machine learning, big data platforms, digital twins, and cloud analytics that support proactive supply chain decisions and improve continuity across volatile regional markets.
Based on Application, the market is segmented into Supply Chain and Transportation. The Supply Chain market dominated the Asia Pacific Control Tower Market by Application in 2025, and would continue to be a dominant market till 2033; thereby, achieving a market value of USD 4.9 billion by 2030, growing at a CAGR of 24.3 % during the forecast period. Additionally, The Transportation market is expected to witness highest CAGR of 25.6% during (2026 - 2033).
Supply Chain leads due to expanding manufacturing hubs, growing e-commerce activity, complex supplier networks, and rising need for end-to-end visibility across procurement, production, warehousing, and distribution. Enterprises use supply chain control towers to monitor supplier performance, detect risks, optimize inventory, and improve coordination across multi-country operations. Transportation remains significant as logistics providers and enterprises invest in fleet tracking, route optimization, carrier management, freight visibility, and last-mile delivery coordination. This segment is supported by IoT sensors, GPS tracking, 5G connectivity, AI-based routing, multimodal logistics monitoring, and emissions tracking across regional transport networks.
Based on End-use, the market is segmented into Healthcare, Retail & Consumer Goods, Manufacturing, High Technology Products, Aerospace & Defense, Chemicals, and Other End-use. Healthcare leads due to growing pharmaceutical production, medical supply chain modernization, cold chain requirements, equipment distribution needs, and stronger focus on reliable delivery of critical healthcare products.
Retail & Consumer Goods uses control towers for omnichannel fulfillment, demand sensing, inventory synchronization, warehouse visibility, and consumer delivery performance. Manufacturing applies these platforms for smart factory operations, supplier monitoring, production scheduling, and disruption management. High Technology Products, Aerospace & Defense, Chemicals, and Other End-use areas add demand through electronics component tracking, export compliance, asset visibility, hazardous material monitoring, ESG reporting, agriculture, energy, and logistics service coordination.
Free Valuable Insights: Control Tower Market is Predicted to reach USD 60.4 Billion billion by 2033, at a CAGR of 23.9%
Based on Country, the market is segmented into China, Japan, India, South Korea, Singapore, Malaysia, and Rest of Asia Pacific. The China market dominated the Asia Pacific Control Tower Market by Country in 2025, and would continue to be a dominant market till 2033; thereby, achieving a market value of USD 2.3 billion by 2030, growing at a CAGR of 22.6 % during the forecast period. The Japan market is expected to witness a CAGR of 24% during (2026 - 2033). Additionally, The India market is expected to witness a CAGR of 25.6% during (2026 - 2033).
China leads due to its large manufacturing base, smart factory adoption, cloud-based control tower deployment, AI-enabled visibility tools, and growing focus on domestic supply chain resilience. Japan supports market growth through advanced logistics systems, AI-based decision support, secure data-sharing frameworks, and sustainability-focused supply chain operations. India is advancing through rapid digital infrastructure growth, expanding manufacturing, logistics modernization, AI-based risk monitoring, and demand for end-to-end visibility across fragmented networks. South Korea, Singapore, and Malaysia add momentum through high-tech manufacturing, trade hub operations, Industry 4.0 adoption, regulatory alignment, and cloud-based platforms, while Rest of Asia Pacific benefits from edge computing, regional trade growth, digital logistics, and localized control tower deployments.
By Type
By Application
By End-use
By Country
Set to reach $8.4 Billion by 2030, growing at 24.8% CAGR during 2026-2033.
China leads with $2.3 billion by 2030, growing at 22.6% CAGR during the forecast period.
Rising demand in the Supply Chain segment, reaching $4.9 billion by 2030 at 24.3% CAGR.
Operational segment hits $6.0 billion by 2030, growing at 24.4% CAGR during the forecast period.
India is expected to witness a CAGR of 25.6% during 2026-2033.
The Analytical segment is expected to witness the highest CAGR of 25.9% during 2026-2033.
Our team of dedicated experts can provide you with attractive expansion opportunities for your business.



 Unique Offerings