The sample copy of this report is available for access.
The Asia Pacific Automated Optical Inspection Systems Market is expected to reach USD 625.2 million by 2030, growing at a CAGR of 9.1% during (2026 – 2033).
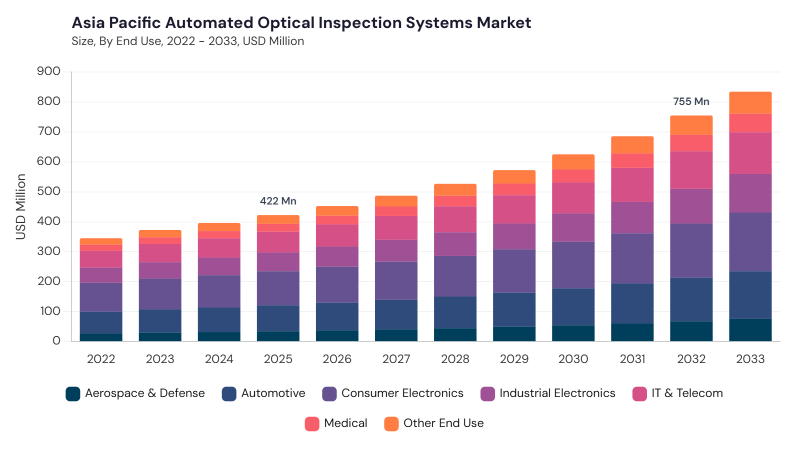
The Asia Pacific Automated Optical Inspection Systems Market developed from the region’s expanding need for faster and more accurate quality control in electronics and PCB manufacturing. Early AOI systems were introduced as automated alternatives to manual visual inspection, mainly detecting solder defects, missing components, and placement errors. Over time, high-resolution cameras, improved lighting, machine vision algorithms, and advanced image processing increased inspection reliability across high-volume production lines. The rise of electronics hubs in China, Japan, South Korea, Taiwan, and Southeast Asia accelerated AOI adoption across manufacturing clusters.
The Asia Pacific Automated Optical Inspection Systems Market is being shaped by AI-driven analytics, PCB manufacturing expansion, smart factory adoption, real-time data processing, and stronger quality compliance needs. Manufacturers are deploying AOI systems to improve yield, reduce rework, minimize false positives, and support traceable inspection workflows across complex electronic assemblies. Demand is supported by consumer electronics, semiconductor packaging, automotive electronics, 5G infrastructure, medical electronics, and industrial automation. Vendors are focusing on 3D imaging, dual-sided inspection, edge computing, modular architectures, cloud integration, and AI-based defect classification.
Based on Type, the market is segmented into 2D AOI and 3D AOI. The 2D AOI market dominated the Asia Pacific Automated Optical Inspection Systems Market by Type in 2025, and would continue to be a dominant market till 2033; thereby, achieving a market value of USD 337.3 million by 2030, growing at a CAGR of 8.6 % during the forecast period. The 3D AOI market is expected to witness a CAGR of 9.7% during (2026 - 2033).
2D AOI leads due to its cost-effective deployment, fast inspection cycle, and extensive use across PCB production for consumer electronics, industrial electronics, and standard assembly lines. These systems are widely adopted to detect soldering errors, surface defects, missing components, component misplacement, and visible assembly irregularities. 3D AOI is gaining momentum as manufacturers shift toward high-density electronic assemblies, semiconductor packaging, EV electronics, and advanced automotive control systems. Its ability to inspect solder volume, component height, warped surfaces, coplanarity, and complex multi-layer structures makes it increasingly important in precision-driven manufacturing environments.
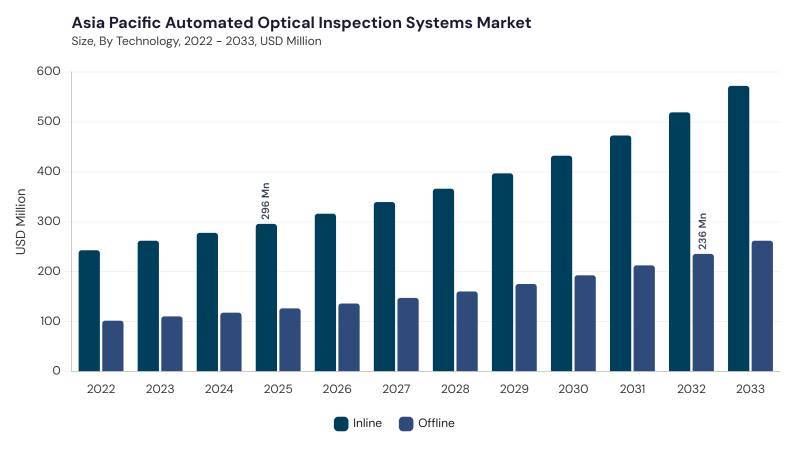
Based on Technology, the market is segmented into Inline and Offline. The Inline market dominated the Asia Pacific Automated Optical Inspection Systems Market by Technology in 2025, and would continue to be a dominant market till 2033; thereby, achieving a market value of USD 432.4 million by 2030, growing at a CAGR of 8.8 % during the forecast period. The Offline market is expected to witness a CAGR of 9.8% during (2026 - 2033).
Inline AOI leads due to its integration with high-volume production lines, continuous quality monitoring, real-time defect detection, and ability to reduce downtime across automated factories. These systems are highly relevant for PCB assembly, semiconductor packaging, consumer electronics, automotive electronics, telecom hardware, and smart manufacturing operations. Inline inspection supports immediate corrective action, better throughput, traceability, and process optimization within Industry 4.0 production environments. Offline AOI remains important for prototype evaluation, low-volume manufacturing, research activities, failure analysis, final quality checks, and detailed inspection where flexibility and independent defect assessment are preferred.
Based on End Use, the market is segmented into Consumer Electronics, Automotive, IT & Telecom, Industrial Electronics, Aerospace & Defense, Medical, and Other End Use. Consumer Electronics leads due to Asia Pacific’s strong manufacturing base for smartphones, laptops, tablets, wearable devices, televisions, home electronics, and compact PCB assemblies requiring rapid inspection. Automotive follows as electric vehicles, battery systems, ADAS, sensors, lighting modules, and electronic control units increase demand for reliable inspection.
IT & Telecom benefits from 5G infrastructure, servers, routers, cloud equipment, semiconductor production, and data center hardware. Industrial Electronics, Aerospace & Defense, Medical, and Other End Use areas add demand through factory automation, defense electronics, avionics, diagnostic equipment, medical devices, energy electronics, transportation systems, research equipment, and specialized industrial applications.
Free Valuable Insights: Automated Optical Inspection Systems Market is Predicted to reach USD 1.8 Billion billion by 2033, at a CAGR of 8.8%
Based on Country, the market is segmented into China, Japan, India, South Korea, Singapore, Malaysia, and Rest of Asia Pacific. The China market dominated the Asia Pacific Automated Optical Inspection Systems Market by Country in 2025, and would continue to be a dominant market till 2033; thereby, achieving a market value of USD 184.1 million by 2030, growing at a CAGR of 7.3 % during the forecast period. The Japan market is expected to witness a CAGR of 8.4% during (2026 - 2033). Additionally, The India market is expected to witness a CAGR of 10.2% during (2026 - 2033).
China leads due to its large electronics manufacturing base, PCB assembly scale, smart factory investments, AI-enabled inspection adoption, and growing integration of AOI with AXI and other quality systems. Japan supports market growth through precision manufacturing, semiconductor production, automotive electronics, high-speed inline AOI, and strong demand for customized inspection solutions. India is advancing through electronics manufacturing expansion, AI-enabled AOI adoption, modular inspection platforms, Industry 4.0 integration, and growing domestic PCB production. South Korea, Singapore, and Malaysia add momentum through semiconductor packaging, consumer electronics, EV electronics, smart manufacturing, and localized technical support, while Rest of Asia Pacific benefits from manufacturing diversification and rising automation.
By Type
By Technology
By End Use
By Country
Set to reach $625.2 Million by 2030, growing at 9.1% CAGR during (2026–2033).
China leads with $184.1 million by 2030, growing at a CAGR of 7.3% during the forecast period.
Rising demand for Inline technology, which will reach $432.4 million by 2030 at an 8.8% CAGR.
The 2D AOI segment will reach $337.3 million by 2030, growing at an 8.6% CAGR during the forecast period.
The India market is expected to witness a CAGR of 10.2% during (2026–2033).
The 3D AOI segment is expected to witness a CAGR of 9.7% during (2026–2033).
Our team of dedicated experts can provide you with attractive expansion opportunities for your business.




 Unique Offerings