North America Trade Management Software Market Size, Share & Industry Analysis Report By Deployment (Cloud, and On-premise), By Component (Solutions, and Services), By End Use (Manufacturing, Transportation & logistics, Government, Energy, and Retail), By Country Outlook and Forecast, 2026 - 2033
Published Date : 02-Sep-2026 |
Pages: 218 |
Report Format: PDF + Excel |
COVID-19 Impact on the North America Trade Management Software Market
The North America Trade Management Software Market is expected to reach USD 964.7 million by 2032, growing at a CAGR of 9.2% during (2026 – 2033).
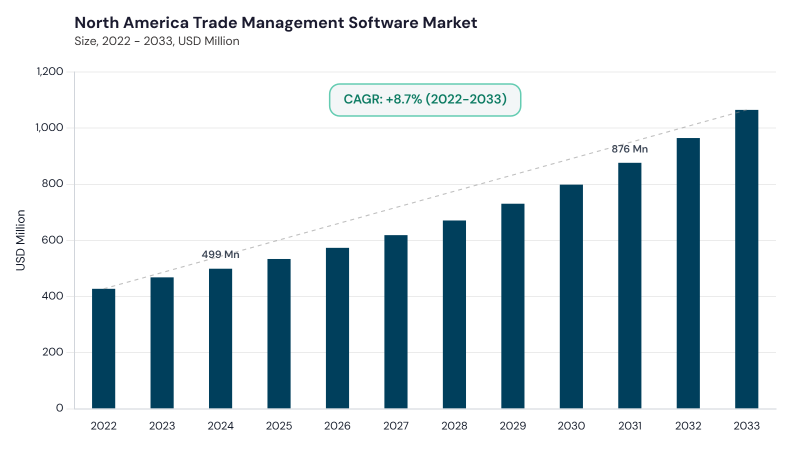
The North America Trade Management Software Market developed as companies began digitizing customs documentation, shipment tracking, tariff classification, and cross-border compliance workflows. Early adoption focused on replacing manual trade processes with structured systems that reduced filing errors and improved operational efficiency. As supply chains became more global and regulations grew more complex, software platforms expanded into integrated compliance, logistics, finance, and visibility tools. Cloud computing, AI, automation, real-time data exchange, and analytics later transformed the market from basic documentation support into strategic trade intelligence.
The North America Trade Management Software Market is being shaped by AI-enabled compliance, cloud-based platforms, nearshoring, supply chain realignment, regulatory complexity, and the need for end-to-end trade visibility. Enterprises are adopting these platforms to manage customs filings, sanctions screening, tariff updates, origin determination, logistics coordination, and trade risk assessment. Demand is supported by e-commerce growth, multi-modal transportation, cross-border manufacturing, real-time regulatory updates, and tighter data security requirements. Vendors are focusing on predictive analytics, automated documentation, ERP integration, SaaS delivery, block chain-enabled audit trails, and configurable workflows.
Deployment Outlook
Based on Deployment, the market is segmented into Cloud and On-premise. The Cloud market dominated the North America Trade Management Software Market by Deployment in 2025, and would continue to be a dominant market till 2033; thereby, achieving a market value of USD 600.6 million by 2032, growing at a CAGR of 9.4 % during the forecast period. The On-premise market is expected to witness a CAGR of 9% during (2026 - 2033).
Cloud deployment leads due to enterprise demand for scalable access, faster implementation, remote collaboration, automatic regulatory updates, and lower infrastructure burden. Cloud platforms support real-time compliance monitoring, ERP integration, tariff management, shipment visibility, and AI-enabled trade risk analytics across distributed teams. On-premise deployment remains significant among organizations with strict data control, customized workflows, confidential compliance processes, and legacy IT environments. This segment is supported by regulated industries, defense-linked trade, healthcare, finance, and enterprises requiring internally managed systems with deep customization and localized security control.
Component Outlook
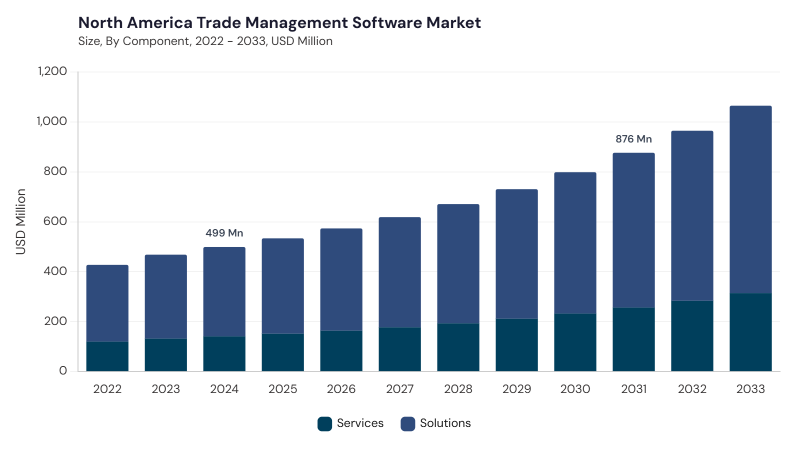
Based on Component, the market is segmented into Solutions and Services. The Solutions market dominated the North America Trade Management Software Market by Component in 2025, and would continue to be a dominant market till 2033; thereby, achieving a market value of USD 681.3 million by 2032, growing at a CAGR of 9 % during the forecast period. The Services market is expected to witness a CAGR of 9.8% during (2026 - 2033).
Solutions lead as enterprises rely on software platforms for customs management, trade compliance, import-export documentation, tariff classification, duty optimization, shipment tracking, and risk monitoring. These tools help companies automate manual processes, reduce errors, improve audit readiness, and respond quickly to regulatory changes. Services remain significant because organizations require consulting, implementation, integration, customization, training, regulatory support, and maintenance to maximize software value. This segment benefits from complex ERP environments, evolving trade policies, AI adoption, cloud migration, and the need for expert configuration across industry-specific workflows.
End Use Outlook
Based on End Use, the market is segmented into Manufacturing, Retail, Transportation & Logistics, Government, Energy, Healthcare, and Other End Uses. Manufacturing leads due to global sourcing, complex supplier networks, cross-border production, nearshoring activity, and the need for automated trade compliance across raw materials and finished goods. Retail remains significant as e-commerce, international sourcing, inventory visibility, customs compliance, and omni-channel distribution increase demand for scalable trade platforms.
Transportation & Logistics uses these systems for freight movement, shipment visibility, customs automation, and carrier coordination. Government adoption is driven by customs modernization, while Energy and Healthcare require export controls, sanctions checks, equipment tracking, pharmaceutical compliance, medical device documentation, and supply chain traceability.
Free Valuable Insights: The Global Trade Management Software Market will hit USD 3029.0 Million billion by 2033, at a CAGR of 9.8%
Country Outlook
Based on Country, the market is segmented into US, Canada, Mexico, and Rest of North America. The US market dominated the North America Trade Management Software Market by Country in 2025, and would continue to be a dominant market till 2033; thereby, achieving a market value of USD 708.7 million by 2032, growing at a CAGR of 8.5 % during the forecast period. The Canada market is expected to witness a CAGR of 11.2% during (2026 - 2033). Additionally, The Mexico market is expected to witness a CAGR of 10.8% during (2026 - 2033).
The US leads due to large import-export volumes, advanced enterprise software adoption, complex customs requirements, AI-enabled compliance investment, and strong integration between trade, logistics, ERP, and supply chain systems. Canada supports market growth through regulated trade workflows, cloud-based documentation, bilingual compliance needs, real-time regulatory updates, and rising use of AI for customs and risk management. Mexico is advancing through nearshoring, manufacturing expansion, customs modernization, supply chain digitization, and demand for trade visibility across North American corridors. Rest of North America benefits from cloud adoption, regulatory automation, regional trade integration, and growing demand for flexible platforms that manage diverse cross-border workflows.
List of Key Companies Profiled
- SAP SE
- Oracle Corporation
- e2open Parent Holdings, Inc.
- Thomson Reuters Corporation
- Descartes Systems Group Inc.
- WiseTech Global Limited
- Infor, Inc.
- QAD Inc. (Thoma Bravo, L.P.)
- MIC Datenverarbeitung GmbH
- Bamboo Rose LLC
North America Trade Management Software Market Report Segmentation
By Deployment
- Cloud
- On-premise
By Component
- Solutions
- Services
By End Use
- Manufacturing
- Retail
- Transportation & Logistics
- Government
- Energy
- Healthcare
- Other End Uses
By Country
- US
- Canada
- Mexico
- Rest of North America
1.1 Market Overview
1.2 Key Factors Impacting Market
1.2.1 Market Drivers
1.2.2 Market Restraints
1.2.3 Market Opportunities
1.2.4 Market Challenges
1.2.5 Market Trends
1.2.6 State of Competition
1.2.7 Market Consolidation
1.2.8 Key Customer Criteria
1.3 Product Life Cycle
1.4 Segmentation By Type
1.4.1 Low Voltage Cables
1.4.2 Medium Voltage Cables
1.4.3 High Voltage Cables
1.5 Segmentation By Installation
1.5.1 Direct Buried
1.5.2 Duct
1.5.3 Submarine
1.6 Segmentation By End Use
1.6.1 Utilities
1.6.2 Residential
1.6.3 Industrial
1.6.4 Commercial
1.7 Segmentation By Country
1.7.1 US
1.7.1.1 Segmentation By Type
1.7.1.1.1 Low Voltage Cables
1.7.1.1.2 Medium Voltage Cables
1.7.1.1.3 High Voltage Cables
1.7.1.2 Segmentation By Installation
1.7.1.2.1 Direct Buried
1.7.1.2.2 Duct
1.7.1.2.3 Submarine
1.7.1.3 Segmentation By End Use
1.7.1.3.1 Utilities
1.7.1.3.2 Residential
1.7.1.3.3 Industrial
1.7.1.3.4 Commercial
1.7.2 Canada
1.7.2.1 Segmentation By Type
1.7.2.1.1 Low Voltage Cables
1.7.2.1.2 Medium Voltage Cables
1.7.2.1.3 High Voltage Cables
1.7.2.2 Segmentation By Installation
1.7.2.2.1 Direct Buried
1.7.2.2.2 Duct
1.7.2.2.3 Submarine
1.7.2.3 Segmentation By End Use
1.7.2.3.1 Utilities
1.7.2.3.2 Residential
1.7.2.3.3 Industrial
1.7.2.3.4 Commercial
1.7.3 Mexico
1.7.3.1 Segmentation By Type
1.7.3.1.1 Low Voltage Cables
1.7.3.1.2 Medium Voltage Cables
1.7.3.1.3 High Voltage Cables
1.7.3.2 Segmentation By Installation
1.7.3.2.1 Direct Buried
1.7.3.2.2 Duct
1.7.3.2.3 Submarine
1.7.3.3 Segmentation By End Use
1.7.3.3.1 Utilities
1.7.3.3.2 Residential
1.7.3.3.3 Industrial
1.7.3.3.4 Commercial
1.7.4 Rest of North America
1.7.4.1 Segmentation By Type
1.7.4.1.1 Low Voltage Cables
1.7.4.1.2 Medium Voltage Cables
1.7.4.1.3 High Voltage Cables
1.7.4.2 Segmentation By Installation
1.7.4.2.1 Direct Buried
1.7.4.2.2 Duct
1.7.4.2.3 Submarine
1.7.4.3 Segmentation By End Use
1.7.4.3.1 Utilities
1.7.4.3.2 Residential
1.7.4.3.3 Industrial
1.7.4.3.4 Commercial
Chapter 2. Company Snapshots
2.1 Prysmian Group
2.1.1 Business Overview
2.1.2 Key Information
2.1.3 Company Focus on the Underground Cables Market
2.1.4 Strategic Insights
2.1.5 Strategy Deployed for the Underground Cables Market
2.1.6 Product & Service Portfolio
2.1.7 Capability Overview
2.1.8 Technology & Innovation Focus
2.1.9 SWOT Analysis
2.1.10 Customers / End Users
2.1.11 Competitive Positioning
2.1.12 Key Differentiators
2.1.13 Portfolio Matrix
2.1.14 Analyst View
2.1.15 Future Outlook
2.2 Nexans S.A.
2.2.1 Business Overview
2.2.2 Company Profile
2.2.3 Company Focus on the Underground Cables Market
2.2.4 Strategic Insights on the Underground Cables Market
2.2.5 Strategy Deployed for the Underground Cables Market
2.2.6 Product & Service Portfolio
2.2.7 Capability Overview
2.2.8 Technology & Innovation Focus
2.2.9 SWOT Analysis
2.2.10 Customers / End Users
2.2.11 Competitive Positioning
2.2.12 Key Differentiators
2.2.13 Portfolio Matrix
2.2.14 Analyst View
2.2.15 Future Outlook
2.3 NKT A/S
2.3.1 Business Overview
2.3.2 Company Profile
2.3.3 Company Focus on the Underground Cables Market
2.3.4 Strategic Insights on the Underground Cables Market
2.3.5 Strategy Deployed for the Underground Cables Market
2.3.6 Product & Service Portfolio
2.3.7 Capability Overview
2.3.8 Technology & Innovation Focus
2.3.9 SWOT Analysis
2.3.10 Customers / End Users
2.3.11 Competitive Positioning
2.3.12 Key Differentiators
2.3.13 Portfolio Matrix
2.3.14 Analyst View
2.3.15 Future Outlook
2.4 Sumitomo Electric Industries, Ltd.
2.4.1 Business Overview
2.4.2 Company Profile
2.4.3 Company Focus on the Underground Cables Market
2.4.4 Strategic Insights
2.4.5 Strategy Deployed
2.4.6 Product & Service Portfolio
2.4.7 Capability Overview
2.4.8 Technology & Innovation Focus
2.4.9 SWOT Analysis
2.4.10 Customers / End Users
2.4.11 Competitive Positioning
2.4.12 Key Differentiators
2.4.13 Portfolio Matrix
2.4.14 Analyst View
2.4.15 Future Outlook
2.5 Southwire Company, LLC
2.5.1 Business Overview
2.5.2 Key Information
2.5.3 Company Focus on Underground Cables Market
2.5.4 Strategic Insights
2.5.5 Strategy Deployed
2.5.6 Product & Service Portfolio
2.5.7 Representative Products
2.5.8 Capability Overview
2.5.9 Technology & Innovation Focus
2.5.10 SWOT Analysis
2.5.11 Customers / End Users
2.5.12 Competitive Positioning
2.5.13 Key Differentiators
2.5.14 Portfolio Matrix
2.5.15 Analyst View
2.5.16 Future Outlook
2.6 LS Cable & System Ltd.
2.6.1 Business Overview
2.6.2 Key Information
2.6.3 Company Focus on Underground Cables Market
2.6.4 Strategic Insights
2.6.5 Strategy Deployed for Underground Cables Market
2.6.6 Product & Service Portfolio
2.6.7 Representative Products / Services
2.6.8 Capability Overview
2.6.9 Technology & Innovation Focus
2.6.10 SWOT Analysis
2.6.11 Customers / End Users
2.6.12 Competitive Positioning
2.6.13 Key Differentiators
2.6.14 Portfolio Matrix
2.6.15 Analyst View
2.6.16 Future Outlook
2.7 Furukawa Electric Co., Ltd.
2.7.1 Business Overview
2.7.2 Key Information
2.7.3 Company Focus on Underground Cables Market
2.7.4 Strategic Insights
2.7.5 Strategy Deployed
2.7.6 Product & Service Portfolio
2.7.7 Representative Products / Services
2.7.8 Capability Overview
2.7.9 Technology & Innovation Focus
2.7.10 SWOT Analysis
2.7.11 Customers / End Users
2.7.12 Competitive Positioning
2.7.13 Key Differentiators
2.7.14 Portfolio Matrix
2.7.15 Analyst View
2.7.16 Future Outlook for Underground Cables Market
2.8 Riyadh Cables Group Company
2.8.1 Business Overview
2.8.2 Company Profile
2.8.3 Company Focus on Underground Cables Market
2.8.4 Strategic Insights on Underground Cables Market
2.8.5 Strategy Deployed for Underground Cables Market
2.8.6 Product & Service Portfolio
2.8.7 Representative Products / Services
2.8.8 Capability Overview
2.8.9 Technology & Innovation Focus
2.8.10 SWOT Analysis
2.8.11 Customers / End Users
2.8.12 Competitive Positioning
2.8.13 Key Differentiators
2.8.14 Portfolio Matrix
2.8.15 Analyst View
2.8.16 Future Outlook for Underground Cables Market
2.9 Taihan Cable & Solution Co., Ltd.
2.9.1 Business Overview
2.9.2 Company Profile
2.9.3 Company Focus on Underground Cables Market
2.9.4 Strategic Insights on Underground Cables Market
2.9.5 Strategy Deployed for Underground Cables Market
2.9.6 Product & Service Portfolio
2.9.7 Representative Products / Services
2.9.8 Capability Overview
2.9.9 Technology & Innovation Focus
2.9.10 SWOT Analysis
2.9.11 Customers / End Users
2.9.12 Competitive Positioning
2.9.13 Key Differentiators
2.9.14 Portfolio Matrix
2.9.15 Analyst View
2.9.16 Future Outlook for Underground Cables Market
2.10 Hellenic Cables S.A.
2.10.1 Business Overview
2.10.2 Key Information
2.10.3 Company Focus on Underground Cables Market
2.10.4 Strategic Insights on Underground Cables Market
2.10.5 Strategy Deployed for Underground Cables Market
2.10.6 Product & Service Portfolio
2.10.7 Representative Products / Services
2.10.8 Capability Overview
2.10.9 Technology & Innovation Focus
2.10.10 SWOT Analysis
2.10.11 Customers / End Users 2.10.12 Competitive Positioning
2.10.13 Key Differentiators
2.10.14 Portfolio Matrix
2.10.15 Analyst View
2.10.16 Future Outlook for Underground Cables Market
Table 1 North America Underground Cables Market Market, 2022 - 2033, USD Million
Table 2 North America Underground Cables Market Market by End Use, 2022 - 2033, USD Million
Table 3 North America Commercial Market, 2022 - 2033, USD Million
Table 4 North America Industrial Market, 2022 - 2033, USD Million
Table 5 North America Residential Market, 2022 - 2033, USD Million
Table 6 North America Utilities Market, 2022 - 2033, USD Million
Table 7 North America Underground Cables Market Market by Installation, 2022 - 2033, USD Million
Table 8 North America Direct Buried Market, 2022 - 2033, USD Million
Table 9 North America Duct Market, 2022 - 2033, USD Million
Table 10 North America Submarine Market, 2022 - 2033, USD Million
Table 11 North America Underground Cables Market Market by Type, 2022 - 2033, USD Million
Table 12 North America High Voltage Cables Market, 2022 - 2033, USD Million
Table 13 North America Low Voltage Cables Market, 2022 - 2033, USD Million
Table 14 North America Medium Voltage Cables Market, 2022 - 2033, USD Million
Table 15 United States Underground Cables Market Market, 2022 - 2033, USD Million
Table 16 United States Underground Cables Market Market by End Use, 2022 - 2033, USD Million
Table 17 United States Commercial Market, 2022 - 2033, USD Million
Table 18 United States Industrial Market, 2022 - 2033, USD Million
Table 19 United States Residential Market, 2022 - 2033, USD Million
Table 20 United States Utilities Market, 2022 - 2033, USD Million
Table 21 United States Underground Cables Market Market by Installation, 2022 - 2033, USD Million
Table 22 United States Direct Buried Market, 2022 - 2033, USD Million
Table 23 United States Duct Market, 2022 - 2033, USD Million
Table 24 United States Submarine Market, 2022 - 2033, USD Million
Table 25 United States Underground Cables Market Market by Type, 2022 - 2033, USD Million
Table 26 United States High Voltage Cables Market, 2022 - 2033, USD Million
Table 27 United States Low Voltage Cables Market, 2022 - 2033, USD Million
Table 28 United States Medium Voltage Cables Market, 2022 - 2033, USD Million
Table 29 Canada Underground Cables Market Market, 2022 - 2033, USD Million
Table 30 Canada Underground Cables Market Market by End Use, 2022 - 2033, USD Million
Table 31 Canada Commercial Market, 2022 - 2033, USD Million
Table 32 Canada Industrial Market, 2022 - 2033, USD Million
Table 33 Canada Residential Market, 2022 - 2033, USD Million
Table 34 Canada Utilities Market, 2022 - 2033, USD Million
Table 35 Canada Underground Cables Market Market by Installation, 2022 - 2033, USD Million
Table 36 Canada Direct Buried Market, 2022 - 2033, USD Million
Table 37 Canada Duct Market, 2022 - 2033, USD Million
Table 38 Canada Submarine Market, 2022 - 2033, USD Million
Table 39 Canada Underground Cables Market Market by Type, 2022 - 2033, USD Million
Table 40 Canada High Voltage Cables Market, 2022 - 2033, USD Million
Table 41 Canada Low Voltage Cables Market, 2022 - 2033, USD Million
Table 42 Canada Medium Voltage Cables Market, 2022 - 2033, USD Million
Table 43 Mexico Underground Cables Market Market, 2022 - 2033, USD Million
Table 44 Mexico Underground Cables Market Market by End Use, 2022 - 2033, USD Million
Table 45 Mexico Commercial Market, 2022 - 2033, USD Million
Table 46 Mexico Industrial Market, 2022 - 2033, USD Million
Table 47 Mexico Residential Market, 2022 - 2033, USD Million
Table 48 Mexico Utilities Market, 2022 - 2033, USD Million
Table 49 Mexico Underground Cables Market Market by Installation, 2022 - 2033, USD Million
Table 50 Mexico Direct Buried Market, 2022 - 2033, USD Million
Table 51 Mexico Duct Market, 2022 - 2033, USD Million
Table 52 Mexico Submarine Market, 2022 - 2033, USD Million
Table 53 Mexico Underground Cables Market Market by Type, 2022 - 2033, USD Million
Table 54 Mexico High Voltage Cables Market, 2022 - 2033, USD Million
Table 55 Mexico Low Voltage Cables Market, 2022 - 2033, USD Million
Table 56 Mexico Medium Voltage Cables Market, 2022 - 2033, USD Million
Table 57 Rest of North America Underground Cables Market Market, 2022 - 2033, USD Million
Table 58 Rest of North America Underground Cables Market Market by End Use, 2022 - 2033, USD Million
Table 59 Rest of North America Commercial Market, 2022 - 2033, USD Million
Table 60 Rest of North America Industrial Market, 2022 - 2033, USD Million
Table 61 Rest of North America Residential Market, 2022 - 2033, USD Million
Table 62 Rest of North America Utilities Market, 2022 - 2033, USD Million
Table 63 Rest of North America Underground Cables Market Market by Installation, 2022 - 2033, USD Million
Table 64 Rest of North America Direct Buried Market, 2022 - 2033, USD Million
Table 65 Rest of North America Duct Market, 2022 - 2033, USD Million
Table 66 Rest of North America Submarine Market, 2022 - 2033, USD Million
Table 67 Rest of North America Underground Cables Market Market by Type, 2022 - 2033, USD Million
Table 68 Rest of North America High Voltage Cables Market, 2022 - 2033, USD Million
Table 69 Rest of North America Low Voltage Cables Market, 2022 - 2033, USD Million
Table 70 Rest of North America Medium Voltage Cables Market, 2022 - 2033, USD Million
List of Figures
FIG 1 Key Factors Impacting Market
FIG 2 Market Consolidation
FIG 3 Key Customer Criteria
FIG 4 Product Life Cycle
FIG 5 North America Underground Cables Market Market, 2022 - 2033, USD Million
FIG 6 North America Underground Cables Market Market by End Use, 2022 - 2033, USD Million
FIG 7 North America Commercial Market, 2022 - 2033, USD Million
FIG 8 North America Industrial Market, 2022 - 2033, USD Million
FIG 9 North America Residential Market, 2022 - 2033, USD Million
FIG 10 North America Utilities Market, 2022 - 2033, USD Million
FIG 11 North America Underground Cables Market Market by Installation, 2022 - 2033, USD Million
FIG 12 North America Direct Buried Market, 2022 - 2033, USD Million
FIG 13 North America Duct Market, 2022 - 2033, USD Million
FIG 14 North America Submarine Market, 2022 - 2033, USD Million
FIG 15 North America Underground Cables Market Market by Type, 2022 - 2033, USD Million
FIG 16 North America High Voltage Cables Market, 2022 - 2033, USD Million
FIG 17 North America Low Voltage Cables Market, 2022 - 2033, USD Million
FIG 18 North America Medium Voltage Cables Market, 2022 - 2033, USD Million
FIG 19 United States Underground Cables Market Market, 2022 - 2033, USD Million
FIG 20 United States Underground Cables Market Market by End Use, 2022 - 2033, USD Million
FIG 21 United States Commercial Market, 2022 - 2033, USD Million
FIG 22 United States Industrial Market, 2022 - 2033, USD Million
FIG 23 United States Residential Market, 2022 - 2033, USD Million
FIG 24 United States Utilities Market, 2022 - 2033, USD Million
FIG 25 United States Underground Cables Market Market by Installation, 2022 - 2033, USD Million
FIG 26 United States Direct Buried Market, 2022 - 2033, USD Million
FIG 27 United States Duct Market, 2022 - 2033, USD Million
FIG 28 United States Submarine Market, 2022 - 2033, USD Million
FIG 29 United States Underground Cables Market Market by Type, 2022 - 2033, USD Million
FIG 30 United States High Voltage Cables Market, 2022 - 2033, USD Million
FIG 31 United States Low Voltage Cables Market, 2022 - 2033, USD Million
FIG 32 United States Medium Voltage Cables Market, 2022 - 2033, USD Million
FIG 33 Canada Underground Cables Market Market, 2022 - 2033, USD Million
FIG 34 Canada Underground Cables Market Market by End Use, 2022 - 2033, USD Million
FIG 35 Canada Commercial Market, 2022 - 2033, USD Million
FIG 36 Canada Industrial Market, 2022 - 2033, USD Million
FIG 37 Canada Residential Market, 2022 - 2033, USD Million
FIG 38 Canada Utilities Market, 2022 - 2033, USD Million
FIG 39 Canada Underground Cables Market Market by Installation, 2022 - 2033, USD Million
FIG 40 Canada Direct Buried Market, 2022 - 2033, USD Million
FIG 41 Canada Duct Market, 2022 - 2033, USD Million
FIG 42 Canada Submarine Market, 2022 - 2033, USD Million
FIG 43 Canada Underground Cables Market Market by Type, 2022 - 2033, USD Million
FIG 44 Canada High Voltage Cables Market, 2022 - 2033, USD Million
FIG 45 Canada Low Voltage Cables Market, 2022 - 2033, USD Million
FIG 46 Canada Medium Voltage Cables Market, 2022 - 2033, USD Million
FIG 47 Mexico Underground Cables Market Market, 2022 - 2033, USD Million
FIG 48 Mexico Underground Cables Market Market by End Use, 2022 - 2033, USD Million
FIG 49 Mexico Commercial Market, 2022 - 2033, USD Million
FIG 50 Mexico Industrial Market, 2022 - 2033, USD Million
FIG 51 Mexico Residential Market, 2022 - 2033, USD Million
FIG 52 Mexico Utilities Market, 2022 - 2033, USD Million
FIG 53 Mexico Underground Cables Market Market by Installation, 2022 - 2033, USD Million
FIG 54 Mexico Direct Buried Market, 2022 - 2033, USD Million
FIG 55 Mexico Duct Market, 2022 - 2033, USD Million
FIG 56 Mexico Submarine Market, 2022 - 2033, USD Million
FIG 57 Mexico Underground Cables Market Market by Type, 2022 - 2033, USD Million
FIG 58 Mexico High Voltage Cables Market, 2022 - 2033, USD Million
FIG 59 Mexico Low Voltage Cables Market, 2022 - 2033, USD Million
FIG 60 Mexico Medium Voltage Cables Market, 2022 - 2033, USD Million
FIG 61 Rest of North America Underground Cables Market Market, 2022 - 2033, USD Million
FIG 62 Rest of North America Underground Cables Market Market by End Use, 2022 - 2033, USD Million
FIG 63 Rest of North America Commercial Market, 2022 - 2033, USD Million
FIG 64 Rest of North America Industrial Market, 2022 - 2033, USD Million
FIG 65 Rest of North America Residential Market, 2022 - 2033, USD Million
FIG 66 Rest of North America Utilities Market, 2022 - 2033, USD Million
FIG 67 Rest of North America Underground Cables Market Market by Installation, 2022 - 2033, USD Million
FIG 68 Rest of North America Direct Buried Market, 2022 - 2033, USD Million
FIG 69 Rest of North America Duct Market, 2022 - 2033, USD Million
FIG 70 Rest of North America Submarine Market, 2022 - 2033, USD Million
FIG 71 Rest of North America Underground Cables Market Market by Type, 2022 - 2033, USD Million
FIG 72 Rest of North America High Voltage Cables Market, 2022 - 2033, USD Million
FIG 73 Rest of North America Low Voltage Cables Market, 2022 - 2033, USD Million
FIG 74 Rest of North America Medium Voltage Cables Market, 2022 - 2033, USD Million