North America Recreational Vehicle Market Size, Share & Industry Analysis Report By Propulsion Type (Non-motorized and Motorized), By Application (Personal Use and Commercial Use), By Type (Towable, Class A, Class C, and Class B), By Country and Forecast, 2026 - 2033
Published Date : 22-Sep-2026 |
Pages: 149 |
Report Format: PDF + Excel |
COVID-19 Impact on the North America Recreational Vehicle Market
The North America Recreational Vehicle Market is expected to reach USD 34.9 billion by 2032, growing at a CAGR of 3.7% during (2026 - 2033).
The North America Recreational Vehicle Market evolved from early passenger-vehicle conversions and basic camper trailers into specialized motorhomes and towable units offering integrated living, utility, and recreational capabilities. Expansion of highways, campgrounds, and post-war leisure travel broadened RV adoption, while advances in manufacturing introduced lightweight materials, improved chassis systems, modern safety features, and more sophisticated interiors. Recent development increasingly emphasizes digital connectivity, energy-efficient systems, electrification, and flexible access models such as subscriptions and rentals. This progression has transformed RVs from basic mobile shelters into technologically advanced living and travel platforms serving diverse recreational lifestyles.
Electrification, smart connectivity, flexible ownership, lightweight materials, and changing travel lifestyles are shaping current market development. Manufacturers are increasingly integrating hybrid and electric powertrains, solar systems, IoT-enabled appliances, advanced navigation, telematics, predictive maintenance, and connected vehicle functions to enhance efficiency and user experience. Subscription services, peer-to-peer rentals, and digital booking platforms are reducing ownership barriers, while remote work and experiential travel are broadening the consumer base. At the same time, emissions regulations, vehicle acquisition costs, charging infrastructure, service-network availability, supply chain resilience, and regional manufacturing strategies continue to influence product development and market accessibility.
Propulsion Type Outlook
Based on Propulsion Type, the market is segmented into Non-motorized and Motorized. The Non-motorized market dominated the North America Recreational Vehicle Market by Propulsion Type in 2025, and would continue to be a dominant market till 2033; thereby, achieving a market value of USD 24.3 billion by 2032, growing at a CAGR of 3.4 % during the forecast period. The Motorized market is expected to witness a CAGR of 4.3% during (2026 - 2033).
Non-motorized RVs include travel trailers, fifth wheels, camper trailers, and other towable units that allow consumers to separate recreational accommodation from everyday transportation. Product development increasingly emphasizes lightweight construction, aerodynamics, efficient floorplans, durability, connectivity, and compatibility with evolving tow-vehicle technologies. Motorized RVs include motorhomes and camper vans that combine transportation and living functions in a self-contained platform. Demand is supported by road-trip travel, premium touring, digital connectivity, energy management, driver-assistance features, and growing development of hybrid and electric propulsion technologies.
Application Outlook
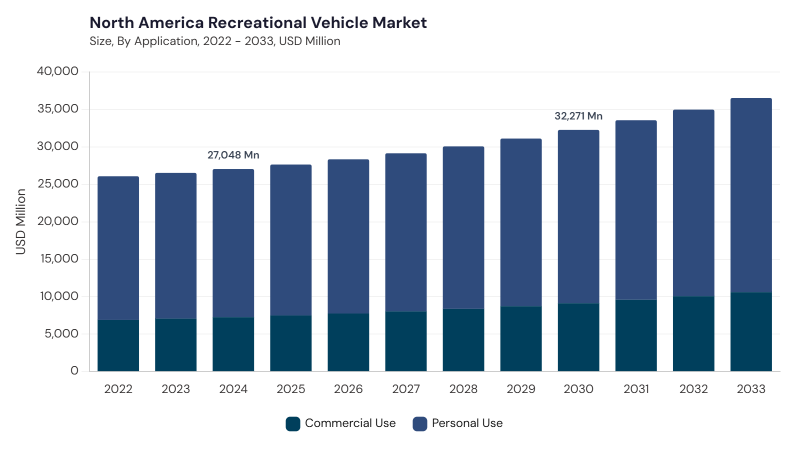
Based on Application, the market is segmented into Personal Use and Commercial Use. The Personal Use market dominated the North America Recreational Vehicle Market by Application in 2025, and would continue to be a dominant market till 2033; thereby, achieving a market value of USD 24.9 billion by 2032, growing at a CAGR of 3.3 % during the forecast period. The Commercial Use market is expected to witness a CAGR of 4.6% during (2026 - 2033).
Personal Use includes RV ownership for leisure travel, camping, extended road trips, remote working, seasonal travel, and lifestyle mobility, with demand increasingly influenced by customization, smart features, solar energy, and connected technologies. Commercial Use includes rental fleets, tourism services, mobile offices, event-support vehicles, mobile healthcare, disaster response, entertainment applications, and other specialized operations. Commercial operators prioritize durability, telematics, fleet management, regulatory compliance, maintenance efficiency, and flexible utilization while increasingly evaluating electric and hybrid RV platforms to improve operational sustainability.
Type Outlook
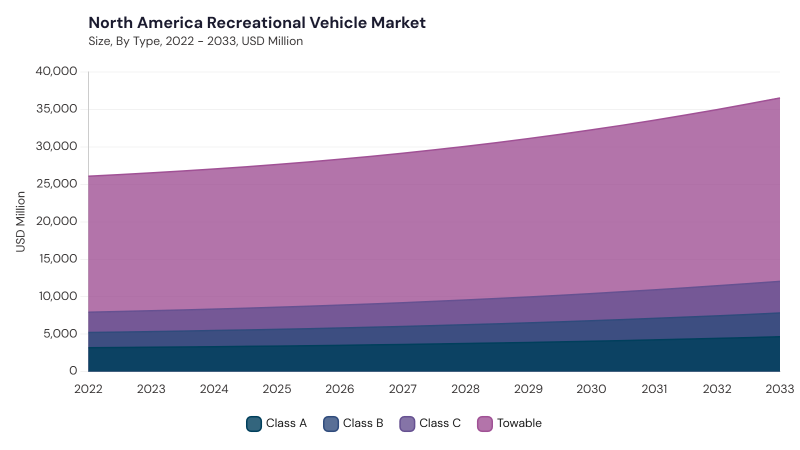
Based on Type, the market is segmented into Towable, Class A, Class C, and Class B. Towable RVs range from compact travel trailers to large fifth-wheel units and appeal to consumers seeking flexibility, affordability, and customizable layouts. Class A motorhomes target premium and long-duration travelers through spacious interiors, extensive amenities, advanced technology, and self-contained living environments.
Class C motorhomes offer a balance of living space, maneuverability, and affordability, supporting family travel and rental applications. Class B motorhomes emphasize compact dimensions, easier driving, fuel efficiency, modular interiors, and van-based adventure travel, making them increasingly relevant among younger travelers, couples, digital nomads, and urban users.
Free Valuable Insights: The Global Recreational Vehicle Market will hit USD 70.0 Billion billion by 2033, at a CAGR of 4.2%
Country Outlook
Based on Country, the market is segmented into US, Canada, Mexico, and Rest of North America. The US market dominated the North America Recreational Vehicle Market by Country in 2025, and would continue to be a dominant market till 2033; thereby, achieving a market value of USD 27.9 billion by 2032, growing at a CAGR of 3.1 % during the forecast period. The Canada market is expected to witness a CAGR of 6.1% during (2026 - 2033). Additionally, The Mexico market is expected to witness a CAGR of 6.3% during (2026 - 2033).
Across North America, RV adoption is being shaped by electrification, smart technology, sustainable materials, flexible ownership models, and changing leisure preferences. The US emphasizes electric and hybrid RV development, connected vehicle systems, remote-work-compatible layouts, lightweight materials, and digital ownership experiences, while Canada focuses on pre-owned RV demand, smart home features, solar integration, sustainable design, and region-specific vehicle configurations. Mexico is advancing energy-efficient RVs, smart connectivity, localized manufacturing, nearshoring, lightweight materials, and tailored product development, whereas Rest of North America emphasizes electric powertrains, subscription services, connected vehicles, predictive maintenance, and localized offerings suited to diverse regulatory and consumer requirements.
List of Key Companies Profiled
- THOR Industries
- Forest River
- Trigano
- Winnebago Industries
- Knaus Tabbert
- Rapido Group
- REV Group
- Hobby
- Brinkley RV
- Alliance RV
North America Recreational Vehicle Market Report Segmentation
By Propulsion Type
- Non-motorized
- Motorized
By Application
- Personal Use
- Commercial Use
By Type
- Towable
- Class A
- Class C
- Class B
By Country
- US
- Canada
- Mexico
- Rest of North America
1.1 Market Overview
1.2 Key Factors Impacting Market
1.2.1 Market Drivers
1.2.2 Market Restraints
1.2.3 Market Opportunities
1.2.4 Market Challenges
1.2.5 Market Trends
1.2.6 State of Competition
1.2.7 Market Consolidation
1.2.8 Key Customer Criteria
1.3 Product Life Cycle
1.4 Segmentation By Propulsion Type
1.4.1 Motorized
1.4.2 Non-motorized
1.5 Segmentation By Application
1.5.1 Personal Use
1.5.2 Commercial Use
1.6 Segmentation By Type
1.6.1 Towable
1.6.2 Class A
1.6.3 Class C
1.6.4 Class B
1.7 Segmentation By Country
1.7.1 US
1.7.1.1 Segmentation By Propulsion Type
1.7.1.1.1 Motorized
1.7.1.1.2 Non-motorized
1.7.1.2 Segmentation By Application
1.7.1.2.1 Personal Use
1.7.1.2.2 Commercial Use
1.7.1.3 Segmentation By Type
1.7.1.3.1 Towable
1.7.1.3.2 Class A
1.7.1.3.3 Class C
1.7.1.3.4 Class B
1.7.2 Canada
1.7.2.1 Segmentation By Propulsion Type
1.7.2.1.1 Motorized
1.7.2.1.2 Non-motorized
1.7.2.2 Segmentation By Application
1.7.2.2.1 Personal Use
1.7.2.2.2 Commercial Use
1.7.2.3 Segmentation By Type
1.7.2.3.1 Towable
1.7.2.3.2 Class A
1.7.2.3.3 Class C
1.7.2.3.4 Class B
1.7.3 Mexico
1.7.3.1 Segmentation By Propulsion Type
1.7.3.1.1 Motorized
1.7.3.1.2 Non-motorized
1.7.3.2 Segmentation By Application
1.7.3.2.1 Personal Use
1.7.3.2.2 Commercial Use
1.7.3.3 Segmentation By Type
1.7.3.3.1 Towable
1.7.3.3.2 Class A
1.7.3.3.3 Class C
1.7.3.3.4 Class B
1.7.4 Rest of North America
1.7.4.1 Segmentation By Propulsion Type
1.7.4.1.1 Motorized
1.7.4.1.2 Non-motorized
1.7.4.2 Segmentation By Application
1.7.4.2.1 Personal Use
1.7.4.2.2 Commercial Use
1.7.4.3 Segmentation By Type
1.7.4.3.1 Towable
1.7.4.3.2 Class A
1.7.4.3.3 Class C
1.7.4.3.4 Class B
Chapter 2. Company Snapshots
2.1 THOR Industries
2.1.1 Business Overview
2.1.2 Key Information
2.1.3 Company Focus on Recreational Vehicle Market
2.1.4 Strategic Insights
2.1.5 Strategy Deployed
2.1.6 SWOT Analysis
2.1.7 Portfolio Matrix
2.1.8 Key Differentiators
2.1.9 Future Outlook
2.2 Forest River
2.2.1 Business Overview
2.2.2 Key Information
2.2.3 Company Focus on Recreational Vehicle Market
2.2.4 Strategic Insights
2.2.5 Strategy Deployed
2.2.6 SWOT Analysis
2.2.7 Key Differentiators
2.2.8 Future Outlook
2.3 Trigano
2.3.1 Business Overview
2.3.2 Key Information
2.3.3 Company Focus on Recreational Vehicle Market
2.3.4 Strategic Insights
2.3.5 Strategy Deployed
2.3.6 SWOT Analysis
2.3.7 Key Differentiators
2.3.8 Future Outlook
2.4 Winnebago Industries
2.4.1 Business Overview
2.4.2 Key Information
2.4.3 Company Focus on Recreational Vehicle Market
2.4.4 Strategic Insights
2.4.5 Strategy Deployed
2.4.6 SWOT Analysis
2.4.7 Key Differentiators
2.4.8 Future Outlook
2.5 Knaus Tabbert
2.5.1 Business Overview
2.5.2 Key Information
2.5.3 Company Focus on Recreational Vehicle Market
2.5.4 Strategic Insights
2.5.5 Strategy Deployed
2.5.6 SWOT Analysis
2.5.7 Key Differentiators
2.5.8 Future Outlook
2.6 Rapido Group
2.6.1 Business Overview
2.6.2 Key Information
2.6.3 Company Focus on Recreational Vehicle Market
2.6.4 Strategic Insights
2.6.5 Strategy Deployed
2.6.6 SWOT Analysis
2.6.7 Key Differentiators
2.6.8 Future Outlook
2.7 REV Group
2.7.1 Business Overview
2.7.2 Key Information
2.7.3 Company Focus on Recreational Vehicle Market
2.7.4 Strategic Insights
2.7.5 Strategy Deployed
2.7.6 SWOT Analysis
2.7.7 Key Differentiators
2.7.8 Future Outlook
2.8 Hobby
2.8.1 Business Overview
2.8.2 Key Information
2.8.3 Company Focus on Recreational Vehicle Market
2.8.4 Strategic Insights
2.8.5 Strategy Deployed
2.8.6 SWOT Analysis
2.8.7 Key Differentiators
2.8.8 Future Outlook
2.9 Brinkley RV
2.9.1 Business Overview
2.9.2 Key Information
2.9.3 Company Focus on Recreational Vehicle Market
2.9.4 Strategic Insights
2.9.5 Strategy Deployed
2.9.6 SWOT Analysis
2.9.7 Key Differentiators
2.9.8 Future Outlook
2.10 Alliance RV
2.10.1 Business Overview
2.10.2 Key Information
2.10.3 Company Focus on Recreational Vehicle Market
2.10.4 Strategic Insights
2.10.5 Strategy Deployed
2.10.6 SWOT Analysis
2.10.7 Key Differentiators
2.10.8 Future Outlook
Table 1 North America Recreational Vehicle Market Market, 2022 - 2033, USD Million
Table 2 North America Recreational Vehicle Market Market by Application, 2022 - 2033, USD Million
Table 3 North America Commercial Use Market, 2022 - 2033, USD Million
Table 4 North America Personal Use Market, 2022 - 2033, USD Million
Table 5 North America Recreational Vehicle Market Market by Propulsion Type, 2022 - 2033, USD Million
Table 6 North America Motorized Market, 2022 - 2033, USD Million
Table 7 North America Non-motorized Market, 2022 - 2033, USD Million
Table 8 North America Recreational Vehicle Market Market by Type, 2022 - 2033, USD Million
Table 9 North America Class A Market, 2022 - 2033, USD Million
Table 10 North America Class B Market, 2022 - 2033, USD Million
Table 11 North America Class C Market, 2022 - 2033, USD Million
Table 12 North America Towable Market, 2022 - 2033, USD Million
Table 13 United States Recreational Vehicle Market Market, 2022 - 2033, USD Million
Table 14 United States Recreational Vehicle Market Market by Application, 2022 - 2033, USD Million
Table 15 United States Commercial Use Market, 2022 - 2033, USD Million
Table 16 United States Personal Use Market, 2022 - 2033, USD Million
Table 17 United States Recreational Vehicle Market Market by Propulsion Type, 2022 - 2033, USD Million
Table 18 United States Motorized Market, 2022 - 2033, USD Million
Table 19 United States Non-motorized Market, 2022 - 2033, USD Million
Table 20 United States Recreational Vehicle Market Market by Type, 2022 - 2033, USD Million
Table 21 United States Class A Market, 2022 - 2033, USD Million
Table 22 United States Class B Market, 2022 - 2033, USD Million
Table 23 United States Class C Market, 2022 - 2033, USD Million
Table 24 United States Towable Market, 2022 - 2033, USD Million
Table 25 Canada Recreational Vehicle Market Market, 2022 - 2033, USD Million
Table 26 Canada Recreational Vehicle Market Market by Application, 2022 - 2033, USD Million
Table 27 Canada Commercial Use Market, 2022 - 2033, USD Million
Table 28 Canada Personal Use Market, 2022 - 2033, USD Million
Table 29 Canada Recreational Vehicle Market Market by Propulsion Type, 2022 - 2033, USD Million
Table 30 Canada Motorized Market, 2022 - 2033, USD Million
Table 31 Canada Non-motorized Market, 2022 - 2033, USD Million
Table 32 Canada Recreational Vehicle Market Market by Type, 2022 - 2033, USD Million
Table 33 Canada Class A Market, 2022 - 2033, USD Million
Table 34 Canada Class B Market, 2022 - 2033, USD Million
Table 35 Canada Class C Market, 2022 - 2033, USD Million
Table 36 Canada Towable Market, 2022 - 2033, USD Million
Table 37 Mexico Recreational Vehicle Market Market, 2022 - 2033, USD Million
Table 38 Mexico Recreational Vehicle Market Market by Application, 2022 - 2033, USD Million
Table 39 Mexico Commercial Use Market, 2022 - 2033, USD Million
Table 40 Mexico Personal Use Market, 2022 - 2033, USD Million
Table 41 Mexico Recreational Vehicle Market Market by Propulsion Type, 2022 - 2033, USD Million
Table 42 Mexico Motorized Market, 2022 - 2033, USD Million
Table 43 Mexico Non-motorized Market, 2022 - 2033, USD Million
Table 44 Mexico Recreational Vehicle Market Market by Type, 2022 - 2033, USD Million
Table 45 Mexico Class A Market, 2022 - 2033, USD Million
Table 46 Mexico Class B Market, 2022 - 2033, USD Million
Table 47 Mexico Class C Market, 2022 - 2033, USD Million
Table 48 Mexico Towable Market, 2022 - 2033, USD Million
Table 49 Rest of North America Recreational Vehicle Market Market, 2022 - 2033, USD Million
Table 50 Rest of North America Recreational Vehicle Market Market by Application, 2022 - 2033, USD Million
Table 51 Rest of North America Commercial Use Market, 2022 - 2033, USD Million
Table 52 Rest of North America Personal Use Market, 2022 - 2033, USD Million
Table 53 Rest of North America Recreational Vehicle Market Market by Propulsion Type, 2022 - 2033, USD Million
Table 54 Rest of North America Motorized Market, 2022 - 2033, USD Million
Table 55 Rest of North America Non-motorized Market, 2022 - 2033, USD Million
Table 56 Rest of North America Recreational Vehicle Market Market by Type, 2022 - 2033, USD Million
Table 57 Rest of North America Class A Market, 2022 - 2033, USD Million
Table 58 Rest of North America Class B Market, 2022 - 2033, USD Million
Table 59 Rest of North America Class C Market, 2022 - 2033, USD Million
Table 60 Rest of North America Towable Market, 2022 - 2033, USD Million
List of Figures
FIG 1 Key Factors Impacting Market
FIG 2 Market Consolidation
FIG 3 Key Customer Criteria
FIG 4 Product Life Cycle
FIG 5 North America Recreational Vehicle Market Market, 2022 - 2033, USD Million
FIG 6 North America Recreational Vehicle Market Market by Application, 2022 - 2033, USD Million
FIG 7 North America Commercial Use Market, 2022 - 2033, USD Million
FIG 8 North America Personal Use Market, 2022 - 2033, USD Million
FIG 9 North America Recreational Vehicle Market Market by Propulsion Type, 2022 - 2033, USD Million
FIG 10 North America Motorized Market, 2022 - 2033, USD Million
FIG 11 North America Non-motorized Market, 2022 - 2033, USD Million
FIG 12 North America Recreational Vehicle Market Market by Type, 2022 - 2033, USD Million
FIG 13 North America Class A Market, 2022 - 2033, USD Million
FIG 14 North America Class B Market, 2022 - 2033, USD Million
FIG 15 North America Class C Market, 2022 - 2033, USD Million
FIG 16 North America Towable Market, 2022 - 2033, USD Million
FIG 17 United States Recreational Vehicle Market Market, 2022 - 2033, USD Million
FIG 18 United States Recreational Vehicle Market Market by Application, 2022 - 2033, USD Million
FIG 19 United States Commercial Use Market, 2022 - 2033, USD Million
FIG 20 United States Personal Use Market, 2022 - 2033, USD Million
FIG 21 United States Recreational Vehicle Market Market by Propulsion Type, 2022 - 2033, USD Million
FIG 22 United States Motorized Market, 2022 - 2033, USD Million
FIG 23 United States Non-motorized Market, 2022 - 2033, USD Million
FIG 24 United States Recreational Vehicle Market Market by Type, 2022 - 2033, USD Million
FIG 25 United States Class A Market, 2022 - 2033, USD Million
FIG 26 United States Class B Market, 2022 - 2033, USD Million
FIG 27 United States Class C Market, 2022 - 2033, USD Million
FIG 28 United States Towable Market, 2022 - 2033, USD Million
FIG 29 Canada Recreational Vehicle Market Market, 2022 - 2033, USD Million
FIG 30 Canada Recreational Vehicle Market Market by Application, 2022 - 2033, USD Million
FIG 31 Canada Commercial Use Market, 2022 - 2033, USD Million
FIG 32 Canada Personal Use Market, 2022 - 2033, USD Million
FIG 33 Canada Recreational Vehicle Market Market by Propulsion Type, 2022 - 2033, USD Million
FIG 34 Canada Motorized Market, 2022 - 2033, USD Million
FIG 35 Canada Non-motorized Market, 2022 - 2033, USD Million
FIG 36 Canada Recreational Vehicle Market Market by Type, 2022 - 2033, USD Million
FIG 37 Canada Class A Market, 2022 - 2033, USD Million
FIG 38 Canada Class B Market, 2022 - 2033, USD Million
FIG 39 Canada Class C Market, 2022 - 2033, USD Million
FIG 40 Canada Towable Market, 2022 - 2033, USD Million
FIG 41 Mexico Recreational Vehicle Market Market, 2022 - 2033, USD Million
FIG 42 Mexico Recreational Vehicle Market Market by Application, 2022 - 2033, USD Million
FIG 43 Mexico Commercial Use Market, 2022 - 2033, USD Million
FIG 44 Mexico Personal Use Market, 2022 - 2033, USD Million
FIG 45 Mexico Recreational Vehicle Market Market by Propulsion Type, 2022 - 2033, USD Million
FIG 46 Mexico Motorized Market, 2022 - 2033, USD Million
FIG 47 Mexico Non-motorized Market, 2022 - 2033, USD Million
FIG 48 Mexico Recreational Vehicle Market Market by Type, 2022 - 2033, USD Million
FIG 49 Mexico Class A Market, 2022 - 2033, USD Million
FIG 50 Mexico Class B Market, 2022 - 2033, USD Million
FIG 51 Mexico Class C Market, 2022 - 2033, USD Million
FIG 52 Mexico Towable Market, 2022 - 2033, USD Million
FIG 53 Rest of North America Recreational Vehicle Market Market, 2022 - 2033, USD Million
FIG 54 Rest of North America Recreational Vehicle Market Market by Application, 2022 - 2033, USD Million
FIG 55 Rest of North America Commercial Use Market, 2022 - 2033, USD Million
FIG 56 Rest of North America Personal Use Market, 2022 - 2033, USD Million
FIG 57 Rest of North America Recreational Vehicle Market Market by Propulsion Type, 2022 - 2033, USD Million
FIG 58 Rest of North America Motorized Market, 2022 - 2033, USD Million
FIG 59 Rest of North America Non-motorized Market, 2022 - 2033, USD Million
FIG 60 Rest of North America Recreational Vehicle Market Market by Type, 2022 - 2033, USD Million
FIG 61 Rest of North America Class A Market, 2022 - 2033, USD Million
FIG 62 Rest of North America Class B Market, 2022 - 2033, USD Million
FIG 63 Rest of North America Class C Market, 2022 - 2033, USD Million
FIG 64 Rest of North America Towable Market, 2022 - 2033, USD Million