Europe Vegan Cheese Market Size, Share & Industry Analysis Report By Application (B2B, and B2C), By Source (Cashew, Coconut, Almond, and Soy), By Product (Mozzarella, Cream Cheese, Parmesan, Ricotta, and Cheddar), By Country Outlook and Forecast, 2026 - 2033
Published Date : 02-Sep-2026 |
Pages: 282 |
Report Format: PDF + Excel |
COVID-19 Impact on the Europe Vegan Cheese Market
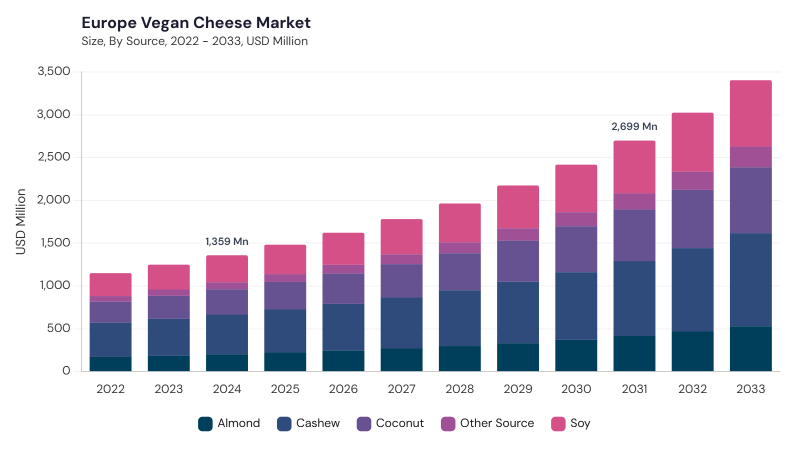
The Europe Vegan Cheese Market is expected to reach USD 2698.5 million by 2031, growing at a CAGR of 11.2% during (2026 – 2033).
Vegan cheese development across Europe emerged from growing consumer interest in plant-based alternatives driven by ethical, environmental, and health considerations. Early products were primarily niche and artisanal, relying on ingredients such as nuts and soy while often facing limitations in taste, texture, and functional similarity to dairy cheese. Advances in fermentation, food biotechnology, microbial cultures, and ingredient formulation progressively improved flavor complexity, texture, and culinary performance. Greater investment in alternative proteins, clearer regulatory frameworks, and expanding retail distribution subsequently supported the transition from specialty offerings toward a more diversified and mainstream plant-based cheese category.
Fermentation innovation, regulatory compliance, sustainability, and changing consumer lifestyles are increasingly shaping market development. Producers are adopting microbial cultures, precision fermentation, novel plant proteins, and advanced texturization methods to improve meltability, flavor, nutritional quality, and product authenticity. European consumers are also placing greater emphasis on clean-label formulations, ingredient transparency, ethical sourcing, and environmentally responsible production. At the same time, vegan and flexitarian dietary trends, broader supermarket availability, e-commerce growth, and expanding foodservice applications are increasing product visibility and supporting wider adoption across the region.
Application Outlook
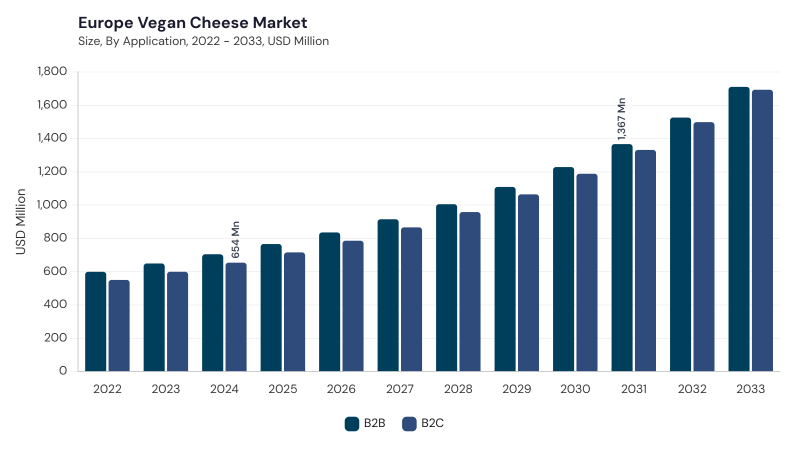
Based on Application, the market is segmented into B2B and B2C. The B2B market dominated the Europe Vegan Cheese Market by Application in 2025, and would continue to be a dominant market till 2033; thereby, achieving a market value of USD 1366.7 million by 2031, growing at a CAGR of 10.8 % during the forecast period. The B2C market is expected to witness a CAGR of 11.6% during (2026 - 2033).
B2B demand is supported by restaurants, foodservice operators, and food manufacturers incorporating vegan cheese into ready meals, frozen foods, bakery products, pizzas, sandwiches, and other dairy-free offerings. Commercial users increasingly require products with consistent texture, meltability, flavor, scalability, and reliable supply across multiple applications. B2C represents household and direct consumer demand through supermarkets, specialty stores, online platforms, and other retail channels. Growing vegan and flexitarian populations, wider supermarket assortments, premium product availability, and greater consumer awareness of plant-based foods continue to strengthen retail adoption.
Source Outlook
Based on Source, the market is segmented into Cashew, Soy, Coconut, Almond, and Other Source. The Cashew market dominated the Europe Vegan Cheese Market by Source in 2025, and would continue to be a dominant market till 2033; thereby, achieving a market value of USD 876.0 million by 2031, growing at a CAGR of 10.3 % during the forecast period. The Soy market is expected to witness a CAGR of 10.9% during (2026 - 2033). Additionally, The Coconut market is expected to witness highest CAGR of 11.7% during (2026 - 2033).
Cashew-based cheese benefits from its rich texture and suitability for fermentation, aging, soft cheeses, spreads, and premium artisanal formulations. Soy followed because of its protein content, established consumer acceptance, cost efficiency, and versatility across slices, spreads, and processed cheese alternatives. Coconut continues to gain popularity for its rich mouthfeel and melting characteristics, while Almond serves health-conscious and premium consumers seeking mild flavor and clean-label positioning. Other Source includes oat, pea protein, sunflower seed, chickpea, rice, hemp, and other emerging ingredients that support allergen-conscious formulations, sustainability objectives, and continued product diversification.
Product Outlook
Based on Product, the market is segmented into Mozzarella, Cheddar, Cream Cheese, Parmesan, Ricotta, and Other Product. Mozzarella remains important for pizzas, sandwiches, salads, and other applications where melting and stretch are essential, while Cheddar supports sandwiches, burgers, snack foods, and convenience meals through its familiar flavor and versatile formats. Cream Cheese continues to expand across breakfast, bakery, spreads, dips, and dessert applications, supported by demand for soft and indulgent dairy-free alternatives.
Parmesan is increasingly used in pasta, salads, and gourmet recipes, whereas Ricotta supports lasagna, stuffed pasta, baked dishes, and specialty culinary preparations. Other Product includes vegan feta, gouda, camembert, blue cheese, smoked varieties, and other specialty formats developed to satisfy evolving consumer tastes and strengthen product differentiation.
Free Valuable Insights: The Worldwide Vegan Cheese Market is projected to reach USD 9.4 Billion billion by 2033, at a CAGR of 11.7%
Country Outlook
Based on Country, the market is segmented into Germany, UK, France, Russia, Spain, Italy, and Rest of Europe. The UK market dominated the Europe Vegan Cheese Market by Country in 2025, and would continue to be a dominant market till 2033; thereby, achieving a market value of USD 583.1 million by 2031, growing at a CAGR of 9.8 % during the forecast period. The Germany market is expected to witness a CAGR of 10.2% during (2026 - 2033). Additionally, The France market is expected to witness a CAGR of 12% during (2026 - 2033).
Across Europe, vegan cheese adoption is increasingly influenced by fermentation technology, sustainability, clean-label preferences, regulatory requirements, and the mainstreaming of plant-based diets. Germany is advancing biotechnology, transparent sourcing, and diversified premium formulations, while the UK is strengthening fermentation-based products, sustainability positioning, convenience formats, and mainstream retail availability. France is combining artisanal heritage with advanced fermentation, localized sourcing, and gourmet product development, whereas Russia is expanding clean-label formulations, digital retail, and locally adapted products. Spain is focusing on improved nutrition, convenience, fermentation, and sustainable production, while Italy is blending traditional culinary heritage with plant-based fermentation, regional flavors, and product innovation. Rest of Europe is also progressing through precision fermentation, ingredient diversification, localized production, and environmentally responsible manufacturing.
List of Key Companies Profiled
- Upfield B.V.
- Otsuka Holdings Co., Ltd.
- Danone S.A.
- Bel Group
- Maple Leaf Foods Inc.
- Hochland SE
- Saputo Inc.
- Miyoko's Creamery
- Kite Hill
- Tofutti Brands Inc.
Europe Vegan Cheese Market Report Segmentation
By Application
- B2B
- B2C
By Source
- Cashew
- Soy
- Coconut
- Almond
- Other Source
By Product
- Mozzarella
- Cheddar
- Cream Cheese
- Parmesan
- Ricotta
- Other Product
By Country
- Germany
- UK
- France
- Russia
- Spain
- Italy
- Rest of Europe
1.1 Market Overview
1.2 Key Factors Impacting Market
1.2.1 Market Drivers
1.2.2 Market Restraints
1.2.3 Market Opportunities
1.2.4 Market Challenges
1.2.5 Market Trends
1.2.6 State of Competition
1.2.7 Market Consolidation
1.2.8 Key Customer Criteria
1.3 Product Life Cycle
1.4 Segmentation By Offering
1.4.1 Solutions
1.4.2 Services
1.5 Segmentation By Application
1.5.1 Smartphones & Tablets
1.5.2 Smart Speakers
1.5.3 Voice-controlled Devices
1.5.4 Interactive Voice Response
1.5.5 Other Application
1.6 Segmentation By Vertical
1.6.1 Consumer Electronics
1.6.2 Retail & E-commerce
1.6.3 BFSI
1.6.4 Automotive & Transportation
1.6.5 Healthcare & Life Sciences
1.6.6 Travel & Hospitality
1.6.7 Government & Defense Sector
1.6.8 Other Vertical
1.7 Segmentation By Country
1.7.1 Germany
1.7.1.1 Segmentation By Offering
1.7.1.1.1 Solutions
1.7.1.1.2 Services
1.7.1.2 Segmentation By Application
1.7.1.2.1 Smartphones & Tablets
1.7.1.2.2 Smart Speakers
1.7.1.2.3 Voice-controlled Devices
1.7.1.2.4 Interactive Voice Response
1.7.1.2.5 Other Application
1.7.1.3 Segmentation By Vertical
1.7.1.3.1 Consumer Electronics
1.7.1.3.2 Retail & E-commerce
1.7.1.3.3 BFSI
1.7.1.3.4 Automotive & Transportation
1.7.1.3.5 Healthcare & Life Science
1.7.1.3.6 Travel & Hospitality
1.7.1.3.7 Government & Defense Sector
1.7.1.3.8 Other Vertical
1.7.2 UK
1.7.2.1 Segmentation By Offering
1.7.2.1.1 Solutions
1.7.2.1.2 Services
1.7.2.2 Segmentation By Application
1.7.2.2.1 Smartphones & Tablets
1.7.2.2.2 Smart Speakers
1.7.2.2.3 Voice-controlled Devices
1.7.2.2.4 Interactive Voice Response
1.7.2.2.5 Other Application
1.7.2.3 Segmentation By Vertical
1.7.2.3.1 Consumer Electronics
1.7.2.3.2 Retail & E-commerce
1.7.2.3.3 BFSI
1.7.2.3.4 Automotive & Transportation
1.7.2.3.5 Healthcare & Life Science
1.7.2.3.6 Travel & Hospitality
1.7.2.3.7 Government & Defense Sector
1.7.2.3.8 Other Vertical
1.7.3 France
1.7.3.1 Segmentation By Offering
1.7.3.1.1 Solutions
1.7.3.1.2 Services
1.7.3.2 Segmentation By Application
1.7.3.2.1 Smartphones & Tablets
1.7.3.2.2 Smart Speakers
1.7.3.2.3 Voice-controlled Devices
1.7.3.2.4 Interactive Voice Response
1.7.3.2.5 Other Application
1.7.3.3 Segmentation By Vertical
1.7.3.3.1 Consumer Electronics
1.7.3.3.2 Retail & E-commerce
1.7.3.3.3 BFSI
1.7.3.3.4 Automotive & Transportation
1.7.3.3.5 Healthcare & Life Science
1.7.3.3.6 Travel & Hospitality
1.7.3.3.7 Government & Defense Sector
1.7.3.3.8 Other Vertical
1.7.4 Russia
1.7.4.1 Segmentation By Offering
1.7.4.1.1 Solutions
1.7.4.1.2 Services
1.7.4.2 Segmentation By Application
1.7.4.2.1 Smartphones & Tablets
1.7.4.2.2 Smart Speakers
1.7.4.2.3 Voice-controlled Devices
1.7.4.2.4 Interactive Voice Response
1.7.4.2.5 Other Application
1.7.4.3 Segmentation By Vertical
1.7.4.3.1 Consumer Electronics
1.7.4.3.2 Retail & E-commerce
1.7.4.3.3 BFSI
1.7.4.3.4 Automotive & Transportation
1.7.4.3.5 Healthcare & Life Science
1.7.4.3.6 Travel & Hospitality
1.7.4.3.7 Government & Defense Sector
1.7.4.3.8 Other Vertical
1.7.5 Spain
1.7.5.1 Segmentation By Offering
1.7.5.1.1 Solutions
1.7.5.1.2 Services
1.7.5.2 Segmentation By Application
1.7.5.2.1 Smartphones & Tablets
1.7.5.2.2 Smart Speakers
1.7.5.2.3 Voice-controlled Devices
1.7.5.2.4 Interactive Voice Response
1.7.5.2.5 Other Application
1.7.5.3 Segmentation By Vertical
1.7.5.3.1 Consumer Electronics
1.7.5.3.2 Retail & E-commerce
1.7.5.3.3 BFSI
1.7.5.3.4 Automotive & Transportation
1.7.5.3.5 Healthcare & Life Science
1.7.5.3.6 Travel & Hospitality
1.7.5.3.7 Government & Defense Sector
1.7.5.3.8 Other Vertical
1.7.6 Italy
1.7.6.1 Segmentation By Offering
1.7.6.1.1 Solutions
1.7.6.1.2 Services
1.7.6.2 Segmentation By Application
1.7.6.2.1 Smartphones & Tablets
1.7.6.2.2 Smart Speakers
1.7.6.2.3 Voice-controlled Devices
1.7.6.2.4 Interactive Voice Response
1.7.6.2.5 Other Application
1.7.6.3 Segmentation By Vertical
1.7.6.3.1 Consumer Electronics
1.7.6.3.2 Retail & E-commerce
1.7.6.3.3 BFSI
1.7.6.3.4 Automotive & Transportation
1.7.6.3.5 Healthcare & Life Science
1.7.6.3.6 Travel & Hospitality
1.7.6.3.7 Government & Defense Sector
1.7.6.3.8 Other Vertical
1.7.7 Rest of Europe
1.7.7.1 Segmentation By Offering
1.7.7.1.1 Solutions
1.7.7.1.2 Services
1.7.7.2 Segmentation By Application
1.7.7.2.1 Smartphones & Tablets
1.7.7.2.2 Smart Speakers
1.7.7.2.3 Voice-controlled Devices
1.7.7.2.4 Interactive Voice Response
1.7.7.2.5 Other Application
1.7.7.3 Segmentation By Vertical
1.7.7.3.1 Consumer Electronics
1.7.7.3.2 Retail & E-commerce
1.7.7.3.3 BFSI
1.7.7.3.4 Automotive & Transportation
1.7.7.3.5 Healthcare & Life Science
1.7.7.3.6 Travel & Hospitality
1.7.7.3.7 Government & Defense Sector
1.7.7.3.8 Other Vertical
Chapter 2. Company Snapshots
2.1 Google LLC
2.1.1 Business Overview
2.1.2 Key Information
2.1.3 Company Focus on Voice User Interface Market
2.1.4 Strategic Insights
2.1.5 Strategy Deployed
2.1.6 Product & Service Portfolio
2.1.7 Representative Products
2.1.8 Capability Overview
2.1.9 Technology & Innovation Focus
2.1.10 SWOT Analysis
2.1.11 Customers / End Users
2.1.12 Competitive Positioning
2.1.13 Key Differentiators
2.1.14 Portfolio Matrix
2.1.15 Analyst View
2.1.16 Future Outlook
2.2 Amazon.com, Inc.
2.2.1 Business Overview
2.2.2 Key Information
2.2.3 Company Focus on Voice User Interface Market
2.2.4 Strategic Insights
2.2.5 Strategy Deployed
2.2.6 Product & Service Portfolio
2.2.7 Representative Products
2.2.8 Capability Overview
2.2.9 Technology & Innovation Focus
2.2.10 SWOT Analysis
2.2.11 Customers / End Users
2.2.12 Competitive Positioning
2.2.13 Key Differentiators
2.2.14 Portfolio Matrix
2.2.15 Analyst View
2.2.16 Future Outlook
2.3 Microsoft Corporation
2.3.1 Business Overview
2.3.2 Key Information
2.3.3 Company Focus on Voice User Interface Market
2.3.4 Strategic Insights
2.3.5 Strategy Deployed
2.3.6 Product & Service Portfolio
2.3.7 Representative Products
2.3.8 Capability Overview
2.3.9 Technology & Innovation Focus
2.3.10 SWOT Analysis
2.3.11 Customers / End Users
2.3.12 Competitive Positioning
2.3.13 Key Differentiators
2.3.14 Portfolio Matrix
2.3.15 Analyst View
2.3.16 Future Outlook
2.4 Apple Inc.
2.4.1 Business Overview
2.4.2 Key Information
2.4.3 Company Focus on Voice User Interface Market
2.4.4 Strategic Insights
2.4.5 Strategy Deployed
2.4.6 Product & Service Portfolio
2.4.7 Representative Products
2.4.8 Capability Overview
2.4.9 Technology & Innovation Focus
2.4.10 SWOT Analysis
2.4.11 Customers / End Users
2.4.12 Competitive Positioning
2.4.13 Key Differentiators
2.4.14 Portfolio Matrix
2.4.15 Analyst View
2.4.16 Future Outlook
2.5 Samsung Electronics Co., Ltd.
2.5.1 Business Overview
2.5.2 Key Information
2.5.3 Company Focus on Voice User Interface Market
2.5.4 Strategic Insights
2.5.5 Strategy Deployed
2.5.6 Product & Service Portfolio
2.5.7 Representative Products
2.5.8 Capability Overview
2.5.9 Technology & Innovation Focus
2.5.10 SWOT Analysis 2.5.11 Customers / End Users
2.5.12 Competitive Positioning
2.5.13 Key Differentiators
2.5.14 Portfolio Matrix
2.5.15 Analyst View
2.5.16 Future Outlook
2.6 Cerence Inc.
2.6.1 Business Overview
2.6.2 Key Information
2.6.3 Company Focus on Voice User Interface Market
2.6.4 Strategic Insights
2.6.5 Strategy Deployed
2.6.6 Product & Service Portfolio
2.6.7 Representative Products
2.6.8 Capability Overview
2.6.9 Technology & Innovation Focus
2.6.10 SWOT Analysis
2.6.11 Customers / End Users
2.6.12 Competitive Positioning
2.6.13 Key Differentiators
2.6.14 Portfolio Matrix
2.6.15 Analyst View
2.6.16 Future Outlook
2.7 SoundHound AI, Inc.
2.7.1 Business Overview
2.7.2 Key Information
2.7.3 Company Focus on Voice User Interface Market
2.7.4 Strategic Insights
2.7.5 Strategy Deployed
2.7.6 Product & Service Portfolio
2.7.7 Representative Products
2.7.8 Capability Overview
2.7.9 Technology & Innovation Focus
2.7.10 SWOT Analysis
2.7.11 Customers / End Users
2.7.12 Competitive Positioning
2.7.13 Key Differentiators
2.7.14 Portfolio Matrix
2.7.15 Analyst View
2.7.16 Future Outlook
2.8 Baidu, Inc.
2.8.1 Business Overview
2.8.2 Key Information
2.8.3 Company Focus on Voice User Interface Market
2.8.4 Strategic Insights
2.8.5 Strategy Deployed
2.8.6 Product & Service Portfolio
2.8.7 Representative Products
2.8.8 Capability Overview
2.8.9 Technology & Innovation Focus
2.8.10 SWOT Analysis
2.8.11 Customers / End Users
2.8.12 Competitive Positioning
2.8.13 Key Differentiators
2.8.14 Portfolio Matrix
2.8.15 Analyst View
2.8.16 Future Outlook
2.9 IBM Corporation
2.9.1 Business Overview
2.9.2 Key Information
2.9.3 Company Focus on Voice User Interface Market
2.9.4 Strategic Insights
2.9.5 Strategy Deployed
2.9.6 Product & Service Portfolio
2.9.7 Representative Products
2.9.8 Capability Overview
2.9.9 Technology & Innovation Focus
2.9.10 SWOT Analysis
2.9.11 Customers / End Users
2.9.12 Competitive Positioning
2.9.13 Key Differentiators
2.9.14 Portfolio Matrix
2.9.15 Analyst View
2.9.16 Future Outlook
2.10 OpenAI, LLC
2.10.1 Business Overview
2.10.2 Key Influencing Factors
2.10.3 Company Focus on Voice User Interface Market
2.10.4 Strategic Insights
2.10.5 Strategy Deployed for Voice User Interface Market
2.10.6 Product & Service Portfolio
2.10.7 Representative Products
2.10.8 Capability Overview
2.10.9 Technology & Innovation Focus
2.10.10 SWOT Analysis
2.10.11 Customers / End Users
2.10.12 Competitive Positioning
2.10.13 Key Differentiators
2.10.14 Portfolio Matrix
2.10.15 Analyst View
2.10.16 Future Outlook
Table 1 Europe Voice User Interface Market Market, 2022 - 2033, USD Million
Table 2 Europe Voice User Interface Market Market by Application, 2022 - 2033, USD Million
Table 3 Europe Interactive Voice Response Market, 2022 - 2033, USD Million
Table 4 Europe Other Application Market, 2022 - 2033, USD Million
Table 5 Europe Smart Speakers Market, 2022 - 2033, USD Million
Table 6 Europe Smartphones & Tablets Market, 2022 - 2033, USD Million
Table 7 Europe Voice-controlled Devices Market, 2022 - 2033, USD Million
Table 8 Europe Voice User Interface Market Market by Offering, 2022 - 2033, USD Million
Table 9 Europe Services Market, 2022 - 2033, USD Million
Table 10 Europe Solution Market, 2022 - 2033, USD Million
Table 11 Europe Voice User Interface Market Market by Vertical, 2022 - 2033, USD Million
Table 12 Europe Automotive & Transportation Market, 2022 - 2033, USD Million
Table 13 Europe BFSI Market, 2022 - 2033, USD Million
Table 14 Europe Consumer Electronics Market, 2022 - 2033, USD Million
Table 15 Europe Government & Defense Sector Market, 2022 - 2033, USD Million
Table 16 Europe Healthcare & Life Science Market, 2022 - 2033, USD Million
Table 17 Europe Other Vertical Market, 2022 - 2033, USD Million
Table 18 Europe Retail & E-commerce Market, 2022 - 2033, USD Million
Table 19 Europe Travel & Hospitality Market, 2022 - 2033, USD Million
Table 20 Germany Voice User Interface Market Market, 2022 - 2033, USD Million
Table 21 Germany Voice User Interface Market Market by Application, 2022 - 2033, USD Million
Table 22 Germany Interactive Voice Response Market, 2022 - 2033, USD Million
Table 23 Germany Other Application Market, 2022 - 2033, USD Million
Table 24 Germany Smart Speakers Market, 2022 - 2033, USD Million
Table 25 Germany Smartphones & Tablets Market, 2022 - 2033, USD Million
Table 26 Germany Voice-controlled Devices Market, 2022 - 2033, USD Million
Table 27 Germany Voice User Interface Market Market by Offering, 2022 - 2033, USD Million
Table 28 Germany Services Market, 2022 - 2033, USD Million
Table 29 Germany Solution Market, 2022 - 2033, USD Million
Table 30 Germany Voice User Interface Market Market by Vertical, 2022 - 2033, USD Million
Table 31 Germany Automotive & Transportation Market, 2022 - 2033, USD Million
Table 32 Germany BFSI Market, 2022 - 2033, USD Million
Table 33 Germany Consumer Electronics Market, 2022 - 2033, USD Million
Table 34 Germany Government & Defense Sector Market, 2022 - 2033, USD Million
Table 35 Germany Healthcare & Life Science Market, 2022 - 2033, USD Million
Table 36 Germany Other Vertical Market, 2022 - 2033, USD Million
Table 37 Germany Retail & E-commerce Market, 2022 - 2033, USD Million
Table 38 Germany Travel & Hospitality Market, 2022 - 2033, USD Million
Table 39 United Kingdom Voice User Interface Market Market, 2022 - 2033, USD Million
Table 40 United Kingdom Voice User Interface Market Market by Application, 2022 - 2033, USD Million
Table 41 United Kingdom Interactive Voice Response Market, 2022 - 2033, USD Million
Table 42 United Kingdom Other Application Market, 2022 - 2033, USD Million
Table 43 United Kingdom Smart Speakers Market, 2022 - 2033, USD Million
Table 44 United Kingdom Smartphones & Tablets Market, 2022 - 2033, USD Million
Table 45 United Kingdom Voice-controlled Devices Market, 2022 - 2033, USD Million
Table 46 United Kingdom Voice User Interface Market Market by Offering, 2022 - 2033, USD Million
Table 47 United Kingdom Services Market, 2022 - 2033, USD Million
Table 48 United Kingdom Solution Market, 2022 - 2033, USD Million
Table 49 United Kingdom Voice User Interface Market Market by Vertical, 2022 - 2033, USD Million
Table 50 United Kingdom Automotive & Transportation Market, 2022 - 2033, USD Million
Table 51 United Kingdom BFSI Market, 2022 - 2033, USD Million
Table 52 United Kingdom Consumer Electronics Market, 2022 - 2033, USD Million
Table 53 United Kingdom Government & Defense Sector Market, 2022 - 2033, USD Million
Table 54 United Kingdom Healthcare & Life Science Market, 2022 - 2033, USD Million
Table 55 United Kingdom Other Vertical Market, 2022 - 2033, USD Million
Table 56 United Kingdom Retail & E-commerce Market, 2022 - 2033, USD Million
Table 57 United Kingdom Travel & Hospitality Market, 2022 - 2033, USD Million
Table 58 France Voice User Interface Market Market, 2022 - 2033, USD Million
Table 59 France Voice User Interface Market Market by Application, 2022 - 2033, USD Million
Table 60 France Interactive Voice Response Market, 2022 - 2033, USD Million
Table 61 France Other Application Market, 2022 - 2033, USD Million
Table 62 France Smart Speakers Market, 2022 - 2033, USD Million
Table 63 France Smartphones & Tablets Market, 2022 - 2033, USD Million
Table 64 France Voice-controlled Devices Market, 2022 - 2033, USD Million
Table 65 France Voice User Interface Market Market by Offering, 2022 - 2033, USD Million
Table 66 France Services Market, 2022 - 2033, USD Million
Table 67 France Solution Market, 2022 - 2033, USD Million
Table 68 France Voice User Interface Market Market by Vertical, 2022 - 2033, USD Million
Table 69 France Automotive & Transportation Market, 2022 - 2033, USD Million
Table 70 France BFSI Market, 2022 - 2033, USD Million
Table 71 France Consumer Electronics Market, 2022 - 2033, USD Million
Table 72 France Government & Defense Sector Market, 2022 - 2033, USD Million
Table 73 France Healthcare & Life Science Market, 2022 - 2033, USD Million
Table 74 France Other Vertical Market, 2022 - 2033, USD Million
Table 75 France Retail & E-commerce Market, 2022 - 2033, USD Million
Table 76 France Travel & Hospitality Market, 2022 - 2033, USD Million
Table 77 Russia Voice User Interface Market Market, 2022 - 2033, USD Million
Table 78 Russia Voice User Interface Market Market by Application, 2022 - 2033, USD Million
Table 79 Russia Interactive Voice Response Market, 2022 - 2033, USD Million
Table 80 Russia Other Application Market, 2022 - 2033, USD Million
Table 81 Russia Smart Speakers Market, 2022 - 2033, USD Million
Table 82 Russia Smartphones & Tablets Market, 2022 - 2033, USD Million
Table 83 Russia Voice-controlled Devices Market, 2022 - 2033, USD Million
Table 84 Russia Voice User Interface Market Market by Offering, 2022 - 2033, USD Million
Table 85 Russia Services Market, 2022 - 2033, USD Million
Table 86 Russia Solution Market, 2022 - 2033, USD Million
Table 87 Russia Voice User Interface Market Market by Vertical, 2022 - 2033, USD Million
Table 88 Russia Automotive & Transportation Market, 2022 - 2033, USD Million
Table 89 Russia BFSI Market, 2022 - 2033, USD Million
Table 90 Russia Consumer Electronics Market, 2022 - 2033, USD Million
Table 91 Russia Government & Defense Sector Market, 2022 - 2033, USD Million
Table 92 Russia Healthcare & Life Science Market, 2022 - 2033, USD Million
Table 93 Russia Other Vertical Market, 2022 - 2033, USD Million
Table 94 Russia Retail & E-commerce Market, 2022 - 2033, USD Million
Table 95 Russia Travel & Hospitality Market, 2022 - 2033, USD Million
Table 96 Spain Voice User Interface Market Market, 2022 - 2033, USD Million
Table 97 Spain Voice User Interface Market Market by Application, 2022 - 2033, USD Million
Table 98 Spain Interactive Voice Response Market, 2022 - 2033, USD Million
Table 99 Spain Other Application Market, 2022 - 2033, USD Million
Table 100 Spain Smart Speakers Market, 2022 - 2033, USD Million
Table 101 Spain Smartphones & Tablets Market, 2022 - 2033, USD Million
Table 102 Spain Voice-controlled Devices Market, 2022 - 2033, USD Million
Table 103 Spain Voice User Interface Market Market by Offering, 2022 - 2033, USD Million
Table 104 Spain Services Market, 2022 - 2033, USD Million
Table 105 Spain Solution Market, 2022 - 2033, USD Million
Table 106 Spain Voice User Interface Market Market by Vertical, 2022 - 2033, USD Million
Table 107 Spain Automotive & Transportation Market, 2022 - 2033, USD Million
Table 108 Spain BFSI Market, 2022 - 2033, USD Million
Table 109 Spain Consumer Electronics Market, 2022 - 2033, USD Million
Table 110 Spain Government & Defense Sector Market, 2022 - 2033, USD Million
Table 111 Spain Healthcare & Life Science Market, 2022 - 2033, USD Million
Table 112 Spain Other Vertical Market, 2022 - 2033, USD Million
Table 113 Spain Retail & E-commerce Market, 2022 - 2033, USD Million
Table 114 Spain Travel & Hospitality Market, 2022 - 2033, USD Million
Table 115 Italy Voice User Interface Market Market, 2022 - 2033, USD Million
Table 116 Italy Voice User Interface Market Market by Application, 2022 - 2033, USD Million
Table 117 Italy Interactive Voice Response Market, 2022 - 2033, USD Million
Table 118 Italy Other Application Market, 2022 - 2033, USD Million
Table 119 Italy Smart Speakers Market, 2022 - 2033, USD Million
Table 120 Italy Smartphones & Tablets Market, 2022 - 2033, USD Million
Table 121 Italy Voice-controlled Devices Market, 2022 - 2033, USD Million
Table 122 Italy Voice User Interface Market Market by Offering, 2022 - 2033, USD Million
Table 123 Italy Services Market, 2022 - 2033, USD Million
Table 124 Italy Solution Market, 2022 - 2033, USD Million
Table 125 Italy Voice User Interface Market Market by Vertical, 2022 - 2033, USD Million
Table 126 Italy Automotive & Transportation Market, 2022 - 2033, USD Million
Table 127 Italy BFSI Market, 2022 - 2033, USD Million
Table 128 Italy Consumer Electronics Market, 2022 - 2033, USD Million
Table 129 Italy Government & Defense Sector Market, 2022 - 2033, USD Million
Table 130 Italy Healthcare & Life Science Market, 2022 - 2033, USD Million
Table 131 Italy Other Vertical Market, 2022 - 2033, USD Million
Table 132 Italy Retail & E-commerce Market, 2022 - 2033, USD Million
Table 133 Italy Travel & Hospitality Market, 2022 - 2033, USD Million
Table 134 Rest of Europe Voice User Interface Market Market, 2022 - 2033, USD Million
Table 135 Rest of Europe Voice User Interface Market Market by Application, 2022 - 2033, USD Million
Table 136 Rest of Europe Interactive Voice Response Market, 2022 - 2033, USD Million
Table 137 Rest of Europe Other Application Market, 2022 - 2033, USD Million
Table 138 Rest of Europe Smart Speakers Market, 2022 - 2033, USD Million
Table 139 Rest of Europe Smartphones & Tablets Market, 2022 - 2033, USD Million
Table 140 Rest of Europe Voice-controlled Devices Market, 2022 - 2033, USD Million
Table 141 Rest of Europe Voice User Interface Market Market by Offering, 2022 - 2033, USD Million
Table 142 Rest of Europe Services Market, 2022 - 2033, USD Million
Table 143 Rest of Europe Solution Market, 2022 - 2033, USD Million
Table 144 Rest of Europe Voice User Interface Market Market by Vertical, 2022 - 2033, USD Million
Table 145 Rest of Europe Automotive & Transportation Market, 2022 - 2033, USD Million
Table 146 Rest of Europe BFSI Market, 2022 - 2033, USD Million
Table 147 Rest of Europe Consumer Electronics Market, 2022 - 2033, USD Million
Table 148 Rest of Europe Government & Defense Sector Market, 2022 - 2033, USD Million
Table 149 Rest of Europe Healthcare & Life Science Market, 2022 - 2033, USD Million
Table 150 Rest of Europe Other Vertical Market, 2022 - 2033, USD Million
Table 151 Rest of Europe Retail & E-commerce Market, 2022 - 2033, USD Million
Table 152 Rest of Europe Travel & Hospitality Market, 2022 - 2033, USD Million
List of Figures
FIG 1 Key Factors Impacting Market
FIG 2 Market Consolidation
FIG 3 Key Customer Criteria
FIG 4 Product Life Cycle
FIG 5 Europe Voice User Interface Market Market, 2022 - 2033, USD Million
FIG 6 Europe Voice User Interface Market Market by Application, 2022 - 2033, USD Million
FIG 7 Europe Interactive Voice Response Market, 2022 - 2033, USD Million
FIG 8 Europe Other Application Market, 2022 - 2033, USD Million
FIG 9 Europe Smart Speakers Market, 2022 - 2033, USD Million
FIG 10 Europe Smartphones & Tablets Market, 2022 - 2033, USD Million
FIG 11 Europe Voice-controlled Devices Market, 2022 - 2033, USD Million
FIG 12 Europe Voice User Interface Market Market by Offering, 2022 - 2033, USD Million
FIG 13 Europe Services Market, 2022 - 2033, USD Million
FIG 14 Europe Solution Market, 2022 - 2033, USD Million
FIG 15 Europe Voice User Interface Market Market by Vertical, 2022 - 2033, USD Million
FIG 16 Europe Automotive & Transportation Market, 2022 - 2033, USD Million
FIG 17 Europe BFSI Market, 2022 - 2033, USD Million
FIG 18 Europe Consumer Electronics Market, 2022 - 2033, USD Million
FIG 19 Europe Government & Defense Sector Market, 2022 - 2033, USD Million
FIG 20 Europe Healthcare & Life Science Market, 2022 - 2033, USD Million
FIG 21 Europe Other Vertical Market, 2022 - 2033, USD Million
FIG 22 Europe Retail & E-commerce Market, 2022 - 2033, USD Million
FIG 23 Europe Travel & Hospitality Market, 2022 - 2033, USD Million
FIG 24 Germany Voice User Interface Market Market, 2022 - 2033, USD Million
FIG 25 Germany Voice User Interface Market Market by Application, 2022 - 2033, USD Million
FIG 26 Germany Interactive Voice Response Market, 2022 - 2033, USD Million
FIG 27 Germany Other Application Market, 2022 - 2033, USD Million
FIG 28 Germany Smart Speakers Market, 2022 - 2033, USD Million
FIG 29 Germany Smartphones & Tablets Market, 2022 - 2033, USD Million
FIG 30 Germany Voice-controlled Devices Market, 2022 - 2033, USD Million
FIG 31 Germany Voice User Interface Market Market by Offering, 2022 - 2033, USD Million
FIG 32 Germany Services Market, 2022 - 2033, USD Million
FIG 33 Germany Solution Market, 2022 - 2033, USD Million
FIG 34 Germany Voice User Interface Market Market by Vertical, 2022 - 2033, USD Million
FIG 35 Germany Automotive & Transportation Market, 2022 - 2033, USD Million
FIG 36 Germany BFSI Market, 2022 - 2033, USD Million
FIG 37 Germany Consumer Electronics Market, 2022 - 2033, USD Million
FIG 38 Germany Government & Defense Sector Market, 2022 - 2033, USD Million
FIG 39 Germany Healthcare & Life Science Market, 2022 - 2033, USD Million
FIG 40 Germany Other Vertical Market, 2022 - 2033, USD Million
FIG 41 Germany Retail & E-commerce Market, 2022 - 2033, USD Million
FIG 42 Germany Travel & Hospitality Market, 2022 - 2033, USD Million
FIG 43 United Kingdom Voice User Interface Market Market, 2022 - 2033, USD Million
FIG 44 United Kingdom Voice User Interface Market Market by Application, 2022 - 2033, USD Million
FIG 45 United Kingdom Interactive Voice Response Market, 2022 - 2033, USD Million
FIG 46 United Kingdom Other Application Market, 2022 - 2033, USD Million
FIG 47 United Kingdom Smart Speakers Market, 2022 - 2033, USD Million
FIG 48 United Kingdom Smartphones & Tablets Market, 2022 - 2033, USD Million
FIG 49 United Kingdom Voice-controlled Devices Market, 2022 - 2033, USD Million
FIG 50 United Kingdom Voice User Interface Market Market by Offering, 2022 - 2033, USD Million
FIG 51 United Kingdom Services Market, 2022 - 2033, USD Million
FIG 52 United Kingdom Solution Market, 2022 - 2033, USD Million
FIG 53 United Kingdom Voice User Interface Market Market by Vertical, 2022 - 2033, USD Million
FIG 54 United Kingdom Automotive & Transportation Market, 2022 - 2033, USD Million
FIG 55 United Kingdom BFSI Market, 2022 - 2033, USD Million
FIG 56 United Kingdom Consumer Electronics Market, 2022 - 2033, USD Million
FIG 57 United Kingdom Government & Defense Sector Market, 2022 - 2033, USD Million
FIG 58 United Kingdom Healthcare & Life Science Market, 2022 - 2033, USD Million
FIG 59 United Kingdom Other Vertical Market, 2022 - 2033, USD Million
FIG 60 United Kingdom Retail & E-commerce Market, 2022 - 2033, USD Million
FIG 61 United Kingdom Travel & Hospitality Market, 2022 - 2033, USD Million
FIG 62 France Voice User Interface Market Market, 2022 - 2033, USD Million
FIG 63 France Voice User Interface Market Market by Application, 2022 - 2033, USD Million
FIG 64 France Interactive Voice Response Market, 2022 - 2033, USD Million
FIG 65 France Other Application Market, 2022 - 2033, USD Million
FIG 66 France Smart Speakers Market, 2022 - 2033, USD Million
FIG 67 France Smartphones & Tablets Market, 2022 - 2033, USD Million
FIG 68 France Voice-controlled Devices Market, 2022 - 2033, USD Million
FIG 69 France Voice User Interface Market Market by Offering, 2022 - 2033, USD Million
FIG 70 France Services Market, 2022 - 2033, USD Million
FIG 71 France Solution Market, 2022 - 2033, USD Million
FIG 72 France Voice User Interface Market Market by Vertical, 2022 - 2033, USD Million
FIG 73 France Automotive & Transportation Market, 2022 - 2033, USD Million
FIG 74 France BFSI Market, 2022 - 2033, USD Million
FIG 75 France Consumer Electronics Market, 2022 - 2033, USD Million
FIG 76 France Government & Defense Sector Market, 2022 - 2033, USD Million
FIG 77 France Healthcare & Life Science Market, 2022 - 2033, USD Million
FIG 78 France Other Vertical Market, 2022 - 2033, USD Million
FIG 79 France Retail & E-commerce Market, 2022 - 2033, USD Million
FIG 80 France Travel & Hospitality Market, 2022 - 2033, USD Million
FIG 81 Russia Voice User Interface Market Market, 2022 - 2033, USD Million
FIG 82 Russia Voice User Interface Market Market by Application, 2022 - 2033, USD Million
FIG 83 Russia Interactive Voice Response Market, 2022 - 2033, USD Million
FIG 84 Russia Other Application Market, 2022 - 2033, USD Million
FIG 85 Russia Smart Speakers Market, 2022 - 2033, USD Million
FIG 86 Russia Smartphones & Tablets Market, 2022 - 2033, USD Million
FIG 87 Russia Voice-controlled Devices Market, 2022 - 2033, USD Million
FIG 88 Russia Voice User Interface Market Market by Offering, 2022 - 2033, USD Million
FIG 89 Russia Services Market, 2022 - 2033, USD Million
FIG 90 Russia Solution Market, 2022 - 2033, USD Million FIG 91 Russia Voice User Interface Market Market by Vertical, 2022 - 2033, USD Million
FIG 92 Russia Automotive & Transportation Market, 2022 - 2033, USD Million
FIG 93 Russia BFSI Market, 2022 - 2033, USD Million
FIG 94 Russia Consumer Electronics Market, 2022 - 2033, USD Million
FIG 95 Russia Government & Defense Sector Market, 2022 - 2033, USD Million
FIG 96 Russia Healthcare & Life Science Market, 2022 - 2033, USD Million
FIG 97 Russia Other Vertical Market, 2022 - 2033, USD Million
FIG 98 Russia Retail & E-commerce Market, 2022 - 2033, USD Million
FIG 99 Russia Travel & Hospitality Market, 2022 - 2033, USD Million
FIG 100 Spain Voice User Interface Market Market, 2022 - 2033, USD Million
FIG 101 Spain Voice User Interface Market Market by Application, 2022 - 2033, USD Million
FIG 102 Spain Interactive Voice Response Market, 2022 - 2033, USD Million
FIG 103 Spain Other Application Market, 2022 - 2033, USD Million
FIG 104 Spain Smart Speakers Market, 2022 - 2033, USD Million
FIG 105 Spain Smartphones & Tablets Market, 2022 - 2033, USD Million
FIG 106 Spain Voice-controlled Devices Market, 2022 - 2033, USD Million
FIG 107 Spain Voice User Interface Market Market by Offering, 2022 - 2033, USD Million
FIG 108 Spain Services Market, 2022 - 2033, USD Million
FIG 109 Spain Solution Market, 2022 - 2033, USD Million
FIG 110 Spain Voice User Interface Market Market by Vertical, 2022 - 2033, USD Million
FIG 111 Spain Automotive & Transportation Market, 2022 - 2033, USD Million
FIG 112 Spain BFSI Market, 2022 - 2033, USD Million
FIG 113 Spain Consumer Electronics Market, 2022 - 2033, USD Million
FIG 114 Spain Government & Defense Sector Market, 2022 - 2033, USD Million
FIG 115 Spain Healthcare & Life Science Market, 2022 - 2033, USD Million
FIG 116 Spain Other Vertical Market, 2022 - 2033, USD Million
FIG 117 Spain Retail & E-commerce Market, 2022 - 2033, USD Million
FIG 118 Spain Travel & Hospitality Market, 2022 - 2033, USD Million
FIG 119 Italy Voice User Interface Market Market, 2022 - 2033, USD Million
FIG 120 Italy Voice User Interface Market Market by Application, 2022 - 2033, USD Million
FIG 121 Italy Interactive Voice Response Market, 2022 - 2033, USD Million
FIG 122 Italy Other Application Market, 2022 - 2033, USD Million
FIG 123 Italy Smart Speakers Market, 2022 - 2033, USD Million
FIG 124 Italy Smartphones & Tablets Market, 2022 - 2033, USD Million
FIG 125 Italy Voice-controlled Devices Market, 2022 - 2033, USD Million
FIG 126 Italy Voice User Interface Market Market by Offering, 2022 - 2033, USD Million
FIG 127 Italy Services Market, 2022 - 2033, USD Million
FIG 128 Italy Solution Market, 2022 - 2033, USD Million
FIG 129 Italy Voice User Interface Market Market by Vertical, 2022 - 2033, USD Million
FIG 130 Italy Automotive & Transportation Market, 2022 - 2033, USD Million
FIG 131 Italy BFSI Market, 2022 - 2033, USD Million
FIG 132 Italy Consumer Electronics Market, 2022 - 2033, USD Million
FIG 133 Italy Government & Defense Sector Market, 2022 - 2033, USD Million
FIG 134 Italy Healthcare & Life Science Market, 2022 - 2033, USD Million
FIG 135 Italy Other Vertical Market, 2022 - 2033, USD Million
FIG 136 Italy Retail & E-commerce Market, 2022 - 2033, USD Million
FIG 137 Italy Travel & Hospitality Market, 2022 - 2033, USD Million
FIG 138 Rest of Europe Voice User Interface Market Market, 2022 - 2033, USD Million
FIG 139 Rest of Europe Voice User Interface Market Market by Application, 2022 - 2033, USD Million
FIG 140 Rest of Europe Interactive Voice Response Market, 2022 - 2033, USD Million
FIG 141 Rest of Europe Other Application Market, 2022 - 2033, USD Million
FIG 142 Rest of Europe Smart Speakers Market, 2022 - 2033, USD Million
FIG 143 Rest of Europe Smartphones & Tablets Market, 2022 - 2033, USD Million
FIG 144 Rest of Europe Voice-controlled Devices Market, 2022 - 2033, USD Million
FIG 145 Rest of Europe Voice User Interface Market Market by Offering, 2022 - 2033, USD Million
FIG 146 Rest of Europe Services Market, 2022 - 2033, USD Million
FIG 147 Rest of Europe Solution Market, 2022 - 2033, USD Million
FIG 148 Rest of Europe Voice User Interface Market Market by Vertical, 2022 - 2033, USD Million
FIG 149 Rest of Europe Automotive & Transportation Market, 2022 - 2033, USD Million
FIG 150 Rest of Europe BFSI Market, 2022 - 2033, USD Million
FIG 151 Rest of Europe Consumer Electronics Market, 2022 - 2033, USD Million
FIG 152 Rest of Europe Government & Defense Sector Market, 2022 - 2033, USD Million
FIG 153 Rest of Europe Healthcare & Life Science Market, 2022 - 2033, USD Million
FIG 154 Rest of Europe Other Vertical Market, 2022 - 2033, USD Million
FIG 155 Rest of Europe Retail & E-commerce Market, 2022 - 2033, USD Million
FIG 156 Rest of Europe Travel & Hospitality Market, 2022 - 2033, USD Million