The Asia Pacific Shortening Market would witness market growth of 4.6% CAGR during the forecast period (2023-2030). In the year 2021, the Asia Pacific market's volume surged to 70,838.59 Tonnes, showcasing a growth of 4.6% (2019-2022).
Shortening's plasticity and ability to trap air bubbles during mixing contribute to the light and fluffy texture of cakes and pastries, while its solid form at room temperature helps create flaky and tender pie crusts. In cookie and biscuit manufacturing, shortening provides richness, moisture retention, and spread control, influencing the cookie's texture, appearance, and shelf stability. Therefore, the Japan market utilized 6,507.43 Tonnes of shortening in bakery products in 2022.

The China market dominated the Asia Pacific Shortening Market by Country in 2022, and would continue to be a dominant market till 2030; thereby, achieving a market value of $459 Million by 2030. The Japan market is registering a CAGR of 3.9% during (2023 - 2030). Additionally, The India market would showcase a CAGR of 5.3% during (2023 - 2030).
Shortening's adoption is also driven by its ability to provide convenience and cost efficiency in large-scale food production. Its stable composition contributes to the extended shelf life of products, reducing waste and ensuring a longer timeframe for distribution and retail. Additionally, the cost-effectiveness of shortening compared to certain alternatives makes it an attractive choice for manufacturers seeking to balance quality and production costs.
Moreover, the versatility of shortening in culinary applications has contributed to its adoption in both traditional and innovative recipes. It serves as a foundational ingredient in classic pastries while also being used in creating modern, cutting-edge culinary creations. Chefs appreciate its adaptability, allowing them to experiment with different textures and flavors in their dishes.
As per the International Trade Administration, according to the Food Labeling Standards of China (GB7718-2011), imported foods must be marked with the nation of origin and the name and address of the general distributor registered in the country, among other details. The emphasis on food labeling in China has led to increased consumer awareness and education about food products' ingredients and nutritional content, including shortening. Therefore, due to the above-mentioned factors, the shortening market will grow significantly in this region.
Free Valuable Insights: The Global Shortening Market is Predict to reach USD 5.8 Billion by 2030, at a CAGR of 3.9%
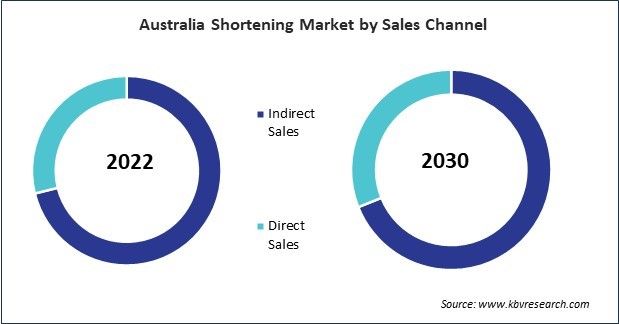
Based on Source, the market is segmented into Vegetable, and Animal. Based on Application, the market is segmented into Bakery Products, Confectionery Products, Snacks & Savory Products, and Others. Based on Sales Channel, the market is segmented into Indirect Sales, and Direct Sales. Based on countries, the market is segmented into China, Japan, India, South Korea, Australia, Malaysia, and Rest of Asia Pacific.
By Source (Volume, Tonnes, USD Billion, 2019-2030)
By Application (Volume, Tonnes, USD Billion, 2019-2030)
By Sales Channel (Volume, Tonnes, USD Billion, 2019-2030)
By Country (Volume, Tonnes, USD Billion, 2019-2030)
Our team of dedicated experts can provide you with attractive expansion opportunities for your business.
