Asia Pacific Semiconductor Metrology and Inspection Equipment Market Size, Share & Industry Analysis Report By Type (Optical, and Beam), By Dimension (2D Metrology/Inspection, and 3D Metrology/Inspection), By End-User (Foundries, and Integrated Device Manufacturing Firms), By Technology, By Country Outlook and Forecast, 2026 - 2033
Published Date : 02-Sep-2026 |
Pages: 335 |
Report Format: PDF + Excel |
COVID-19 Impact on the Asia Pacific Semiconductor Metrology and Inspection Equipment Market
The Asia Pacific Semiconductor Metrology and Inspection Equipment Market is expected to reach USD 9.6 billion by 2030, growing at a CAGR of 8% during (2026 – 2033).
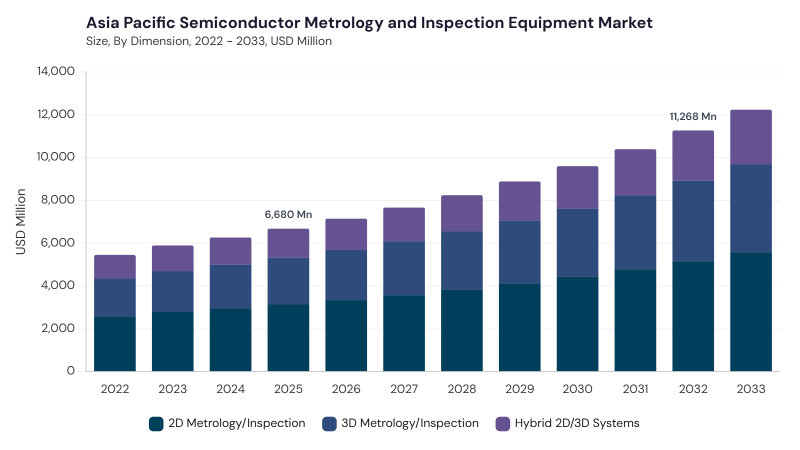
The Asia Pacific Semiconductor Metrology and Inspection Equipment Market developed alongside the region’s rapid expansion in semiconductor fabrication, assembly, and advanced chip production. Early adoption focused on basic mechanical and optical tools used for wafer measurement, dimensional checks, and defect identification. As process nodes became smaller and device structures more complex, the market shifted toward electron beam, laser scanning, X-ray, and high-resolution optical inspection systems. The growth of FinFETs, 3D NAND, advanced packaging, and heterogeneous integration increased the need for multidimensional and inline metrology platforms.
The Asia Pacific Semiconductor Metrology and Inspection Equipment Market is being shaped by expanding fab capacity, advanced packaging adoption, AI semiconductor demand, quality control pressure, and localization of semiconductor supply chains. Manufacturers are using inspection equipment to detect nanoscale defects, improve wafer yield, monitor thin films, verify photomasks, and ensure package reliability. Demand is supported by strong foundry activity, OSAT capacity growth, government-backed semiconductor programs, and high-volume electronics production. Vendors are focusing on AI-driven defect detection, hybrid metrology, inline inspection, non-destructive failure analysis, automation-ready platforms, and region-specific service support.
Type Outlook
Based on Type, the market is segmented into Optical and Beam. The Optical market dominated the Asia Pacific Semiconductor Metrology and Inspection Equipment Market by Type in 2025, and would continue to be a dominant market till 2033; thereby, achieving a market value of USD 6.7 billion by 2030, growing at a CAGR of 7.6 % during the forecast period. The Beam market is expected to witness a CAGR of 8.9% during (2026 - 2033).
Optical leads due to its high-speed, non-contact inspection capability and strong suitability for inline monitoring across high-volume semiconductor manufacturing lines. These systems are widely used for surface inspection, overlay measurement, film analysis, critical dimension control, and process monitoring across fabrication stages. Demand is reinforced by expanding consumer electronics, automotive chips, AI semiconductors, and advanced node production across Asia Pacific. Beam-based systems remain important for ultra-high-resolution defect review, mask inspection, failure analysis, root cause evaluation, and advanced node applications where atomic-level imaging and detailed defect characterization are required.
Dimension Outlook
Based on Dimension, the market is segmented into 2D Metrology/Inspection, 3D Metrology/Inspection, and Hybrid 2D/3D Systems. The 2D Metrology/Inspection market dominated the Asia Pacific Semiconductor Metrology and Inspection Equipment Market by Dimension in 2025, and would continue to be a dominant market till 2033; thereby, achieving a market value of USD 4.4 billion by 2030, growing at a CAGR of 7.6 % during the forecast period. The 3D Metrology/Inspection market is expected to witness a CAGR of 8.4% during (2026 - 2033). The Hybrid 2D/3D Systems market is expected to witness a CAGR of 8.4% during (2026 - 2033).
2D Metrology/Inspection leads due to its broad use in planar wafer measurement, pattern inspection, overlay control, film monitoring, and quality assurance across mature and advanced production lines. These systems remain essential because they deliver reliable measurements, strong throughput, and cost-effective process control for high-volume fabs. 3D Metrology/Inspection is gaining traction as advanced packaging, 3D NAND, stacked dies, and heterogeneous integration require volumetric defect detection and structural analysis. Hybrid 2D/3D Systems are gradually expanding as manufacturers seek combined platforms that improve inspection efficiency, reduce tool duplication, and support increasingly complex semiconductor architectures.
End-User Outlook
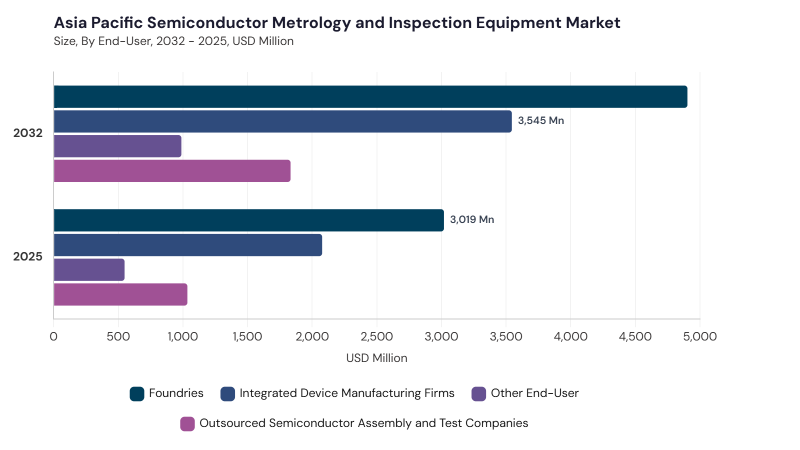
Based on End-User, the market is segmented into Foundries, Integrated Device Manufacturing Firms, Outsourced Semiconductor Assembly and Test Companies, and Other End-User. The Foundries market dominated the Asia Pacific Semiconductor Metrology and Inspection Equipment Market by End-User in 2025, and would continue to be a dominant market till 2033; thereby, achieving a market value of USD 4.2 billion by 2030, growing at a CAGR of 7.4 % during the forecast period. The Integrated Device Manufacturing Firms market is expected to witness a CAGR of 8.2% during (2026 - 2033). Additionally, The Outsourced Semiconductor Assembly and Test Companies market is expected to witness highest CAGR of 8.8% during (2026 - 2033).
Foundries lead due to the region’s strong concentration of high-volume wafer fabrication facilities and continuous investment in advanced process nodes. These companies rely on metrology and inspection equipment to improve yield, control defects, maintain customer specifications, and support complex semiconductor manufacturing flows. Integrated Device Manufacturing Firms use inspection platforms for memory, logic, power semiconductor, and mixed-signal device production where process consistency remains critical. Outsourced Semiconductor Assembly and Test Companies and Other End-User areas add demand through advanced package inspection, wire bond analysis, solder joint evaluation, failure analysis, research activity, specialty chip development, and emerging semiconductor innovation.
Technology Outlook
Based on Technology, the market is segmented into Wafer Inspection System, Thin Film Metrology, Mask Inspection System, Package Inspection, and Other Technology. Wafer Inspection System leads due to its central role in early defect detection, process monitoring, wafer quality control, and yield improvement across fabrication lines. These systems help identify particles, pattern defects, process variations, and irregularities before defects move into later manufacturing stages.
Thin Film Metrology remains essential for measuring film thickness, refractive index, material uniformity, stress, and layer consistency in advanced semiconductor processes. Mask Inspection System, Package Inspection, and Other Technology areas add demand through photomask defect review, EUV-related mask quality control, X-ray package inspection, acoustic microscopy, quantum sensing, laser-based monitoring, and specialized failure analysis.
Free Valuable Insights: Semiconductor Metrology and Inspection Equipment Market is Predicted to reach USD 26.8 Billion billion by 2033, at a CAGR of 7.6%
Country Outlook
Based on Country, the market is segmented into China, Japan, India, South Korea, Singapore, Malaysia, and Rest of Asia Pacific. The China market dominated the Asia Pacific Semiconductor Metrology and Inspection Equipment Market by Country in 2025, and would continue to be a dominant market till 2033; thereby, achieving a market value of USD 2.3 billion by 2030, growing at a CAGR of 5.8 % during the forecast period. The Japan market is expected to witness a CAGR of 7% during (2026 - 2033). Additionally, The India market is expected to witness a CAGR of 9.9% during (2026 - 2033).
China leads due to semiconductor self-sufficiency efforts, expanding fab capacity, domestic metrology development, hybrid inspection adoption, and growing demand for advanced process control tools. Japan supports market growth through precision engineering, strong metrology expertise, e-beam inspection, AI-enabled analytics, and advanced semiconductor manufacturing support. India is advancing through semiconductor localization, government-backed fab initiatives, AI-based inspection adoption, and demand for automated quality control tools. South Korea, Singapore, and Malaysia add momentum through memory production, advanced packaging, OSAT activity, smart manufacturing, localized service hubs, and non-destructive inspection adoption, while Rest of Asia Pacific benefits from fab expansion and advanced equipment modernization.
List of Key Companies Profiled
- KLA Corporation
- Applied Materials, Inc.
- Hitachi High-Tech Corporation
- ASML Holding N.V.
- Onto Innovation Inc.
- Lasertec Corporation
- Nova Ltd.
- Camtek Ltd.
- Bruker Corporation
- SCREEN Holdings Co., Ltd.
Asia Pacific Semiconductor Metrology and Inspection Equipment Market Report Segmentation
By Type
- Optical
- Beam
By Dimension
- 2D Metrology/Inspection
- 3D Metrology/Inspection
- Hybrid 2D/3D Systems
By End-User
- Foundries
- Integrated Device Manufacturing Firms
- Outsourced Semiconductor Assembly and Test Companies
- Other End-User
By Technology
- Wafer Inspection System
- Thin Film Metrology
- Mask Inspection System
- Package Inspection
- Other Technology
By Country
- China
- Japan
- India
- South Korea
- Singapore
- Malaysia
- Rest of Asia Pacific
1.1 Market Overview
1.2 Key Factors Impacting Market
1.2.1 Market Drivers
1.2.2 Market Restraints
1.2.3 Market Opportunities
1.2.4 Market Challenges
1.2.5 Market Trends
1.2.6 State of Competition
1.2.7 Market Consolidation
1.2.8 Key Customer Criteria
1.3 Product Life Cycle
1.4 Segmentation By Offering
1.4.1 Fully Managed
1.4.2 Co-Managed
1.5 Segmentation By Enterprise Size
1.5.1 Large Enterprises
1.5.2 Small & Medium Enterprises (SMEs)
1.6 Segmentation By Service
1.6.1 Incident Response Services
1.6.2 Detection Services
1.6.3 Prevention Services
1.7 Segmentation By Application
1.7.1 Cloud Security
1.7.2 Network Security
1.7.3 Endpoint Security
1.7.4 Application Security
1.7.5 Other Application
1.8 Segmentation By End Use
1.8.1 BFSI
1.8.2 IT & Telecom
1.8.3 Healthcare
1.8.4 Government & Public Sector
1.8.5 Manufacturing
1.8.6 Energy & Utilities
1.8.7 Transportation & Logistics
1.8.8 Other End Uses
1.9 Segmentation By Country
1.9.1 China
1.9.1.1 Segmentation By Offering
1.9.1.1.1 Fully Managed
1.9.1.1.2 Co-Managed
1.9.1.2 Segmentation By Enterprise Size
1.9.1.2.1 Large Enterprises
1.9.1.2.2 Small & Medium Enterprises (SMEs)
1.9.1.3 Segmentation By Service
1.9.1.3.1 Incident Response Services
1.9.1.3.2 Detection Services
1.9.1.3.3 Prevention Services
1.9.1.4 Segmentation By Application
1.9.1.4.1 Endpoint Security
1.9.1.4.2 Network Security
1.9.1.4.3 Cloud Security
1.9.1.4.4 Application Security
1.9.1.4.5 Other Application
1.9.1.5 Segmentation By End Use
1.9.1.5.1 BFSI
1.9.1.5.2 IT & Telecom
1.9.1.5.3 Healthcare
1.9.1.5.4 Government & Public Sector
1.9.1.5.5 Manufacturing
1.9.1.5.6 Energy & Utilities
1.9.1.5.7 Transportation & Logistics
1.9.1.5.8 Other End Uses
1.9.2 Japan
1.9.2.1 Segmentation By Offering
1.9.2.1.1 Fully Managed
1.9.2.1.2 Co-Managed
1.9.2.2 Segmentation By Enterprise Size
1.9.2.2.1 Large Enterprises
1.9.2.2.2 Small & Medium Enterprises (SMEs)
1.9.2.3 Segmentation By Service
1.9.2.3.1 Incident Response Services
1.9.2.3.2 Detection Services
1.9.2.3.3 Prevention Services
1.9.2.4 Segmentation By Application
1.9.2.4.1 Endpoint Security
1.9.2.4.2 Network Security
1.9.2.4.3 Cloud Security
1.9.2.4.4 Application Security
1.9.2.4.5 Other Application
1.9.2.5 Segmentation By End Use
1.9.2.5.1 BFSI
1.9.2.5.2 IT & Telecom
1.9.2.5.3 Healthcare
1.9.2.5.4 Government & Public Sector
1.9.2.5.5 Manufacturing
1.9.2.5.6 Energy & Utilities
1.9.2.5.7 Transportation & Logistics
1.9.2.5.8 Other End Uses
1.9.3 India
1.9.3.1 Segmentation By Offering
1.9.3.1.1 Fully Managed
1.9.3.1.2 Co-Managed
1.9.3.2 Segmentation By Enterprise Size
1.9.3.2.1 Large Enterprises
1.9.3.2.2 Small & Medium Enterprises (SMEs)
1.9.3.3 Segmentation By Service
1.9.3.3.1 Incident Response Services
1.9.3.3.2 Detection Services
1.9.3.3.3 Prevention Services
1.9.3.4 Segmentation By Application
1.9.3.4.1 Endpoint Security
1.9.3.4.2 Network Security
1.9.3.4.3 Cloud Security
1.9.3.4.4 Application Security
1.9.3.4.5 Other Application
1.9.3.5 Segmentation By End Use
1.9.3.5.1 BFSI
1.9.3.5.2 IT & Telecom
1.9.3.5.3 Healthcare
1.9.3.5.4 Government & Public Sector
1.9.3.5.5 Manufacturing
1.9.3.5.6 Energy & Utilities
1.9.3.5.7 Transportation & Logistics
1.9.3.5.8 Other End Uses
1.9.4 South Korea
1.9.4.1 Segmentation By Offering
1.9.4.1.1 Fully Managed
1.9.4.1.2 Co-Managed
1.9.4.2 Segmentation By Enterprise Size
1.9.4.2.1 Large Enterprises
1.9.4.2.2 Small & Medium Enterprises (SMEs)
1.9.4.3 Segmentation By Service
1.9.4.3.1 Incident Response Services
1.9.4.3.2 Detection Services
1.9.4.3.3 Prevention Services
1.9.4.4 Segmentation By Application
1.9.4.4.1 Endpoint Security
1.9.4.4.2 Network Security
1.9.4.4.3 Cloud Security
1.9.4.4.4 Application Security
1.9.4.4.5 Other Application
1.9.4.5 Segmentation By End Use
1.9.4.5.1 BFSI
1.9.4.5.2 IT & Telecom
1.9.4.5.3 Healthcare
1.9.4.5.4 Government & Public Sector
1.9.4.5.5 Manufacturing
1.9.4.5.6 Energy & Utilities
1.9.4.5.7 Transportation & Logistics
1.9.4.5.8 Other End Uses
1.9.5 Singapore
1.9.5.1 Segmentation By Offering
1.9.5.1.1 Fully Managed
1.9.5.1.2 Co-Managed
1.9.5.2 Segmentation By Enterprise Size
1.9.5.2.1 Large Enterprises
1.9.5.2.2 Small & Medium Enterprises (SMEs)
1.9.5.3 Segmentation By Service
1.9.5.3.1 Incident Response Services
1.9.5.3.2 Detection Services
1.9.5.3.3 Prevention Services
1.9.5.4 Segmentation By Application
1.9.5.4.1 Endpoint Security
1.9.5.4.2 Network Security
1.9.5.4.3 Cloud Security
1.9.5.4.4 Application Security
1.9.5.4.5 Other Application
1.9.5.5 Segmentation By End Use
1.9.5.5.1 BFSI
1.9.5.5.2 IT & Telecom
1.9.5.5.3 Healthcare
1.9.5.5.4 Government & Public Sector
1.9.5.5.5 Manufacturing
1.9.5.5.6 Energy & Utilities
1.9.5.5.7 Transportation & Logistics
1.9.5.5.8 Other End Uses
1.9.6 Malaysia
1.9.6.1 Segmentation By Offering
1.9.6.1.1 Fully Managed
1.9.6.1.2 Co-Managed
1.9.6.2 Segmentation By Enterprise Size
1.9.6.2.1 Large Enterprises
1.9.6.2.2 Small & Medium Enterprises (SMEs)
1.9.6.3 Segmentation By Service
1.9.6.3.1 Incident Response Services
1.9.6.3.2 Detection Services
1.9.6.3.3 Prevention Services
1.9.6.4 Segmentation By Application
1.9.6.4.1 Endpoint Security
1.9.6.4.2 Network Security
1.9.6.4.3 Cloud Security
1.9.6.4.4 Application Security
1.9.6.4.5 Other Application
1.9.6.5 Segmentation By End Use
1.9.6.5.1 BFSI
1.9.6.5.2 IT & Telecom
1.9.6.5.3 Healthcare
1.9.6.5.4 Government & Public Sector
1.9.6.5.5 Manufacturing
1.9.6.5.6 Energy & Utilities
1.9.6.5.7 Transportation & Logistics
1.9.6.5.8 Other End Uses
1.9.7 Rest of Asia Pacific
1.9.7.1 Segmentation By Offering
1.9.7.1.1 Fully Managed
1.9.7.1.2 Co-Managed
1.9.7.2 Segmentation By Enterprise Size
1.9.7.2.1 Large Enterprises
1.9.7.2.2 Small & Medium Enterprises (SMEs)
1.9.7.3 Segmentation By Service
1.9.7.3.1 Incident Response Services
1.9.7.3.2 Detection Services
1.9.7.3.3 Prevention Services
1.9.7.4 Segmentation By Application
1.9.7.4.1 Endpoint Security
1.9.7.4.2 Network Security
1.9.7.4.3 Cloud Security
1.9.7.4.4 Application Security
1.9.7.4.5 Other Application
1.9.7.5 Segmentation By End Use
1.9.7.5.1 BFSI
1.9.7.5.2 IT & Telecom
1.9.7.5.3 Healthcare
1.9.7.5.4 Government & Public Sector
1.9.7.5.5 Manufacturing
1.9.7.5.6 Energy & Utilities
1.9.7.5.7 Transportation & Logistics
1.9.7.5.8 Other End Uses
Chapter 2. Company Snapshots
2.1 Arctic Wolf Networks, Inc.
2.1.1 Business Overview
2.1.2 Key Information
2.1.3 Company Focus on SOC as a Service Market
2.1.4 Strategic Insights
2.1.5 Strategy Deployed
2.1.6 Product & Service Portfolio
2.1.7 Representative Products
2.1.8 Capability Overview
2.1.9 Technology & Innovation Focus
2.1.10 SWOT Analysis
2.1.11 Customers / End Users
2.1.12 Competitive Positioning
2.1.13 Key Differentiators
2.1.14 Portfolio Matrix
2.1.15 Analyst View
2.1.16 Future Outlook
2.2 eSentire, Inc.
2.2.1 Business Overview
2.2.2 Key Information
2.2.3 Company Focus on SOC as a Service Market
2.2.4 Strategic Insights
2.2.5 Strategy Deployed 2.2.6 Product & Service Portfolio
2.2.7 Representative Products / Services
2.2.8 Capability Overview
2.2.9 Technology & Innovation Focus
2.2.10 SWOT Analysis
2.2.11 Customers / End Users
2.2.12 Competitive Positioning
2.2.13 Key Differentiators
2.2.14 Portfolio Matrix
2.2.15 Analyst View
2.2.16 Future Outlook
2.3 Expel, Inc.
2.3.1 Business Overview
2.3.2 Key Information
2.3.3 Company Focus on SOC as a Service Market
2.3.4 Strategic Insights
2.3.5 Strategy Deployed
2.3.6 Product & Service Portfolio
2.3.7 Representative Products / Services
2.3.8 Capability Overview
2.3.9 Technology & Innovation Focus
2.3.10 SWOT Analysis
2.3.11 Customers / End Users
2.3.12 Competitive Positioning
2.3.13 Key Differentiators
2.3.14 Portfolio Matrix
2.3.15 Analyst View
2.3.16 Future Outlook
2.4 ReliaQuest, LLC
2.4.1 Business Overview
2.4.2 Key Information
2.4.3 Company Focus on SOC as a Service Market
2.4.4 Strategic Insights
2.4.5 Strategy Deployed
2.4.6 Product & Service Portfolio
2.4.7 Representative Products / Services
2.4.8 Capability Overview
2.4.9 Technology & Innovation Focus
2.4.10 SWOT Analysis
2.4.11 Customers / End Users
2.4.12 Competitive Positioning
2.4.13 Key Differentiators
2.4.14 Portfolio Matrix
2.4.15 Analyst View
2.4.16 Future Outlook
2.5 Secureworks Corp.
2.5.1 Business Overview
2.5.2 Key Information
2.5.3 Company Focus on SOC as a Service Market
2.5.4 Strategic Insights
2.5.5 Strategy Deployed
2.5.6 Product & Service Portfolio
2.5.7 Representative Products / Services
2.5.8 Capability Overview
2.5.9 Technology & Innovation Focus
2.5.10 SWOT Analysis
2.5.11 Customers / End Users
2.5.12 Competitive Positioning
2.5.13 Key Differentiators
2.5.14 Portfolio Matrix
2.5.15 Analyst View
2.5.16 Future Outlook
2.6 AT&T Inc.
2.6.1 Business Overview
2.6.2 Key Information
2.6.3 Company Focus on SOC as a Service Market
2.6.4 Strategic Insights
2.6.5 Strategy Deployed
2.6.6 Product & Service Portfolio
2.6.7 Representative Products
2.6.8 Capability Overview
2.6.9 Technology & Innovation Focus
2.6.10 SWOT Analysis
2.6.11 Customers / End Users
2.6.12 Competitive Positioning
2.6.13 Key Differentiators
2.6.14 Portfolio Matrix
2.6.15 Analyst View
2.6.16 Future Outlook
2.7 IBM Corporation
2.7.1 Business Overview
2.7.2 Key Information
2.7.3 Company Focus on SOC as a Service Market
2.7.4 Strategic Insights
2.7.5 Strategy Deployed
2.7.6 Product & Service Portfolio
2.7.7 Representative Products
2.7.8 Capability Overview
2.7.9 Technology & Innovation Focus
2.7.10 SWOT Analysis
2.7.11 Customers / End Users
2.7.12 Competitive Positioning
2.7.13 Key Differentiators
2.7.14 Portfolio Matrix
2.7.15 Analyst View
2.7.16 Future Outlook
2.8 Palo Alto Networks, Inc.
2.8.1 Business Overview
2.8.2 Key Information
2.8.3 Company Focus on SOC as a Service Market
2.8.4 Strategic Insights
2.8.5 Strategy Deployed
2.8.6 Product & Service Portfolio
2.8.7 Representative Products
2.8.8 Capability Overview
2.8.9 Technology & Innovation Focus
2.8.10 SWOT Analysis
2.8.11 Customers / End Users
2.8.12 Competitive Positioning
2.8.13 Key Differentiators
2.8.14 Portfolio Matrix
2.8.15 Analyst View
2.8.16 Future Outlook
2.9 Verizon Communications Inc.
2.9.1 Business Overview
2.9.2 Key Information
2.9.3 Company Focus on SOC as a Service Market
2.9.4 Strategic Insights
2.9.5 Strategy Deployed
2.9.6 Product & Service Portfolio
2.9.7 Representative Products
2.9.8 Capability Overview
2.9.9 Technology & Innovation Focus
2.9.10 SWOT Analysis
2.9.11 Customers / End Users
2.9.12 Competitive Positioning
2.9.13 Key Differentiators
2.9.14 Portfolio Matrix
2.9.15 Analyst View
2.9.16 Future Outlook
2.10 Orange Cyberdefense S.A.
2.10.1 Business Overview
2.10.2 Company Profile
2.10.3 Company Focus on SOC as a Service Market
2.10.4 Strategic Insights
2.10.5 Strategy Deployed
2.10.6 Product & Service Portfolio
2.10.7 Representative Products
2.10.8 Capability Overview
2.10.9 Technology & Innovation Focus
2.10.10 SWOT Analysis
2.10.11 Customers / End Users
2.10.12 Competitive Positioning
2.10.13 Key Differentiators
2.10.14 Portfolio Matrix
2.10.15 Analyst View
2.10.16 Future Outlook
Table 1 Asia Pacific SoC as a Service Market Market, 2022 - 2033, USD Million
Table 2 Asia Pacific SoC as a Service Market Market by Application, 2022 - 2033, USD Million
Table 3 Asia Pacific Application Security Market, 2022 - 2033, USD Million
Table 4 Asia Pacific Cloud Security Market, 2022 - 2033, USD Million
Table 5 Asia Pacific Endpoint Security Market, 2022 - 2033, USD Million
Table 6 Asia Pacific Network Security Market, 2022 - 2033, USD Million
Table 7 Asia Pacific Other Application Market, 2022 - 2033, USD Million
Table 8 Asia Pacific SoC as a Service Market Market by End Use, 2022 - 2033, USD Million
Table 9 Asia Pacific BFSI Market, 2022 - 2033, USD Million
Table 10 Asia Pacific Energy & Utilities Market, 2022 - 2033, USD Million
Table 11 Asia Pacific Government & Public Sector Market, 2022 - 2033, USD Million
Table 12 Asia Pacific Healthcare Market, 2022 - 2033, USD Million
Table 13 Asia Pacific IT & Telecom Market, 2022 - 2033, USD Million
Table 14 Asia Pacific Manufacturing Market, 2022 - 2033, USD Million
Table 15 Asia Pacific Other End Uses Market, 2022 - 2033, USD Million
Table 16 Asia Pacific Transportation & logistics Market, 2022 - 2033, USD Million
Table 17 Asia Pacific SoC as a Service Market Market by Enterprise Size, 2022 - 2033, USD Million
Table 18 Asia Pacific Large Enterprises Market, 2022 - 2033, USD Million
Table 19 Asia Pacific Small & Medium Enterprises (SMEs) Market, 2022 - 2033, USD Million
Table 20 Asia Pacific SoC as a Service Market Market by Offering, 2022 - 2033, USD Million
Table 21 Asia Pacific Co-Managed Market, 2022 - 2033, USD Million
Table 22 Asia Pacific Fully Managed Market, 2022 - 2033, USD Million
Table 23 Asia Pacific SoC as a Service Market Market by Service, 2022 - 2033, USD Million
Table 24 Asia Pacific Detection Services Market, 2022 - 2033, USD Million
Table 25 Asia Pacific Incident Response Services Market, 2022 - 2033, USD Million
Table 26 Asia Pacific Prevention Services Market, 2022 - 2033, USD Million
Table 27 China SoC as a Service Market Market, 2022 - 2033, USD Million
Table 28 China SoC as a Service Market Market by Application, 2022 - 2033, USD Million
Table 29 China Application Security Market, 2022 - 2033, USD Million
Table 30 China Cloud Security Market, 2022 - 2033, USD Million
Table 31 China Endpoint Security Market, 2022 - 2033, USD Million
Table 32 China Network Security Market, 2022 - 2033, USD Million
Table 33 China Other Application Market, 2022 - 2033, USD Million
Table 34 China SoC as a Service Market Market by End Use, 2022 - 2033, USD Million
Table 35 China BFSI Market, 2022 - 2033, USD Million
Table 36 China Energy & Utilities Market, 2022 - 2033, USD Million
Table 37 China Government & Public Sector Market, 2022 - 2033, USD Million
Table 38 China Healthcare Market, 2022 - 2033, USD Million
Table 39 China IT & Telecom Market, 2022 - 2033, USD Million
Table 40 China Manufacturing Market, 2022 - 2033, USD Million
Table 41 China Other End Uses Market, 2022 - 2033, USD Million
Table 42 China Transportation & logistics Market, 2022 - 2033, USD Million
Table 43 China SoC as a Service Market Market by Enterprise Size, 2022 - 2033, USD Million
Table 44 China Large Enterprises Market, 2022 - 2033, USD Million
Table 45 China Small & Medium Enterprises (SMEs) Market, 2022 - 2033, USD Million
Table 46 China SoC as a Service Market Market by Offering, 2022 - 2033, USD Million
Table 47 China Co-Managed Market, 2022 - 2033, USD Million
Table 48 China Fully Managed Market, 2022 - 2033, USD Million
Table 49 China SoC as a Service Market Market by Service, 2022 - 2033, USD Million
Table 50 China Detection Services Market, 2022 - 2033, USD Million
Table 51 China Incident Response Services Market, 2022 - 2033, USD Million
Table 52 China Prevention Services Market, 2022 - 2033, USD Million
Table 53 Japan SoC as a Service Market Market, 2022 - 2033, USD Million
Table 54 Japan SoC as a Service Market Market by Application, 2022 - 2033, USD Million
Table 55 Japan Application Security Market, 2022 - 2033, USD Million
Table 56 Japan Cloud Security Market, 2022 - 2033, USD Million
Table 57 Japan Endpoint Security Market, 2022 - 2033, USD Million
Table 58 Japan Network Security Market, 2022 - 2033, USD Million
Table 59 Japan Other Application Market, 2022 - 2033, USD Million
Table 60 Japan SoC as a Service Market Market by End Use, 2022 - 2033, USD Million
Table 61 Japan BFSI Market, 2022 - 2033, USD Million
Table 62 Japan Energy & Utilities Market, 2022 - 2033, USD Million
Table 63 Japan Government & Public Sector Market, 2022 - 2033, USD Million
Table 64 Japan Healthcare Market, 2022 - 2033, USD Million
Table 65 Japan IT & Telecom Market, 2022 - 2033, USD Million
Table 66 Japan Manufacturing Market, 2022 - 2033, USD Million
Table 67 Japan Other End Uses Market, 2022 - 2033, USD Million
Table 68 Japan Transportation & logistics Market, 2022 - 2033, USD Million
Table 69 Japan SoC as a Service Market Market by Enterprise Size, 2022 - 2033, USD Million
Table 70 Japan Large Enterprises Market, 2022 - 2033, USD Million
Table 71 Japan Small & Medium Enterprises (SMEs) Market, 2022 - 2033, USD Million
Table 72 Japan SoC as a Service Market Market by Offering, 2022 - 2033, USD Million
Table 73 Japan Co-Managed Market, 2022 - 2033, USD Million
Table 74 Japan Fully Managed Market, 2022 - 2033, USD Million
Table 75 Japan SoC as a Service Market Market by Service, 2022 - 2033, USD Million
Table 76 Japan Detection Services Market, 2022 - 2033, USD Million
Table 77 Japan Incident Response Services Market, 2022 - 2033, USD Million
Table 78 Japan Prevention Services Market, 2022 - 2033, USD Million
Table 79 India SoC as a Service Market Market, 2022 - 2033, USD Million
Table 80 India SoC as a Service Market Market by Application, 2022 - 2033, USD Million
Table 81 India Application Security Market, 2022 - 2033, USD Million
Table 82 India Cloud Security Market, 2022 - 2033, USD Million
Table 83 India Endpoint Security Market, 2022 - 2033, USD Million
Table 84 India Network Security Market, 2022 - 2033, USD Million
Table 85 India Other Application Market, 2022 - 2033, USD Million
Table 86 India SoC as a Service Market Market by End Use, 2022 - 2033, USD Million
Table 87 India BFSI Market, 2022 - 2033, USD Million
Table 88 India Energy & Utilities Market, 2022 - 2033, USD Million
Table 89 India Government & Public Sector Market, 2022 - 2033, USD Million
Table 90 India Healthcare Market, 2022 - 2033, USD Million
Table 91 India IT & Telecom Market, 2022 - 2033, USD Million
Table 92 India Manufacturing Market, 2022 - 2033, USD Million
Table 93 India Other End Uses Market, 2022 - 2033, USD Million
Table 94 India Transportation & logistics Market, 2022 - 2033, USD Million
Table 95 India SoC as a Service Market Market by Enterprise Size, 2022 - 2033, USD Million
Table 96 India Large Enterprises Market, 2022 - 2033, USD Million
Table 97 India Small & Medium Enterprises (SMEs) Market, 2022 - 2033, USD Million
Table 98 India SoC as a Service Market Market by Offering, 2022 - 2033, USD Million
Table 99 India Co-Managed Market, 2022 - 2033, USD Million
Table 100 India Fully Managed Market, 2022 - 2033, USD Million
Table 101 India SoC as a Service Market Market by Service, 2022 - 2033, USD Million
Table 102 India Detection Services Market, 2022 - 2033, USD Million
Table 103 India Incident Response Services Market, 2022 - 2033, USD Million
Table 104 India Prevention Services Market, 2022 - 2033, USD Million
Table 105 South Korea SoC as a Service Market Market, 2022 - 2033, USD Million
Table 106 South Korea SoC as a Service Market Market by Application, 2022 - 2033, USD Million
Table 107 South Korea Application Security Market, 2022 - 2033, USD Million
Table 108 South Korea Cloud Security Market, 2022 - 2033, USD Million
Table 109 South Korea Endpoint Security Market, 2022 - 2033, USD Million
Table 110 South Korea Network Security Market, 2022 - 2033, USD Million
Table 111 South Korea Other Application Market, 2022 - 2033, USD Million
Table 112 South Korea SoC as a Service Market Market by End Use, 2022 - 2033, USD Million
Table 113 South Korea BFSI Market, 2022 - 2033, USD Million
Table 114 South Korea Energy & Utilities Market, 2022 - 2033, USD Million
Table 115 South Korea Government & Public Sector Market, 2022 - 2033, USD Million
Table 116 South Korea Healthcare Market, 2022 - 2033, USD Million
Table 117 South Korea IT & Telecom Market, 2022 - 2033, USD Million
Table 118 South Korea Manufacturing Market, 2022 - 2033, USD Million
Table 119 South Korea Other End Uses Market, 2022 - 2033, USD Million
Table 120 South Korea Transportation & logistics Market, 2022 - 2033, USD Million
Table 121 South Korea SoC as a Service Market Market by Enterprise Size, 2022 - 2033, USD Million
Table 122 South Korea Large Enterprises Market, 2022 - 2033, USD Million
Table 123 South Korea Small & Medium Enterprises (SMEs) Market, 2022 - 2033, USD Million
Table 124 South Korea SoC as a Service Market Market by Offering, 2022 - 2033, USD Million
Table 125 South Korea Co-Managed Market, 2022 - 2033, USD Million
Table 126 South Korea Fully Managed Market, 2022 - 2033, USD Million
Table 127 South Korea SoC as a Service Market Market by Service, 2022 - 2033, USD Million
Table 128 South Korea Detection Services Market, 2022 - 2033, USD Million
Table 129 South Korea Incident Response Services Market, 2022 - 2033, USD Million
Table 130 South Korea Prevention Services Market, 2022 - 2033, USD Million
Table 131 Singapore SoC as a Service Market Market, 2022 - 2033, USD Million
Table 132 Singapore SoC as a Service Market Market by Application, 2022 - 2033, USD Million
Table 133 Singapore Application Security Market, 2022 - 2033, USD Million
Table 134 Singapore Cloud Security Market, 2022 - 2033, USD Million
Table 135 Singapore Endpoint Security Market, 2022 - 2033, USD Million
Table 136 Singapore Network Security Market, 2022 - 2033, USD Million
Table 137 Singapore Other Application Market, 2022 - 2033, USD Million
Table 138 Singapore SoC as a Service Market Market by End Use, 2022 - 2033, USD Million
Table 139 Singapore BFSI Market, 2022 - 2033, USD Million
Table 140 Singapore Energy & Utilities Market, 2022 - 2033, USD Million
Table 141 Singapore Government & Public Sector Market, 2022 - 2033, USD Million
Table 142 Singapore Healthcare Market, 2022 - 2033, USD Million
Table 143 Singapore IT & Telecom Market, 2022 - 2033, USD Million
Table 144 Singapore Manufacturing Market, 2022 - 2033, USD Million
Table 145 Singapore Other End Uses Market, 2022 - 2033, USD Million
Table 146 Singapore Transportation & logistics Market, 2022 - 2033, USD Million
Table 147 Singapore SoC as a Service Market Market by Enterprise Size, 2022 - 2033, USD Million
Table 148 Singapore Large Enterprises Market, 2022 - 2033, USD Million
Table 149 Singapore Small & Medium Enterprises (SMEs) Market, 2022 - 2033, USD Million
Table 150 Singapore SoC as a Service Market Market by Offering, 2022 - 2033, USD Million
Table 151 Singapore Co-Managed Market, 2022 - 2033, USD Million
Table 152 Singapore Fully Managed Market, 2022 - 2033, USD Million
Table 153 Singapore SoC as a Service Market Market by Service, 2022 - 2033, USD Million
Table 154 Singapore Detection Services Market, 2022 - 2033, USD Million
Table 155 Singapore Incident Response Services Market, 2022 - 2033, USD Million
Table 156 Singapore Prevention Services Market, 2022 - 2033, USD Million
Table 157 Malaysia SoC as a Service Market Market, 2022 - 2033, USD Million
Table 158 Malaysia SoC as a Service Market Market by Application, 2022 - 2033, USD Million
Table 159 Malaysia Application Security Market, 2022 - 2033, USD Million
Table 160 Malaysia Cloud Security Market, 2022 - 2033, USD Million
Table 161 Malaysia Endpoint Security Market, 2022 - 2033, USD Million
Table 162 Malaysia Network Security Market, 2022 - 2033, USD Million
Table 163 Malaysia Other Application Market, 2022 - 2033, USD Million
Table 164 Malaysia SoC as a Service Market Market by End Use, 2022 - 2033, USD Million
Table 165 Malaysia BFSI Market, 2022 - 2033, USD Million
Table 166 Malaysia Energy & Utilities Market, 2022 - 2033, USD Million
Table 167 Malaysia Government & Public Sector Market, 2022 - 2033, USD Million
Table 168 Malaysia Healthcare Market, 2022 - 2033, USD Million
Table 169 Malaysia IT & Telecom Market, 2022 - 2033, USD Million
Table 170 Malaysia Manufacturing Market, 2022 - 2033, USD Million
Table 171 Malaysia Other End Uses Market, 2022 - 2033, USD Million
Table 172 Malaysia Transportation & logistics Market, 2022 - 2033, USD Million
Table 173 Malaysia SoC as a Service Market Market by Enterprise Size, 2022 - 2033, USD Million
Table 174 Malaysia Large Enterprises Market, 2022 - 2033, USD Million
Table 175 Malaysia Small & Medium Enterprises (SMEs) Market, 2022 - 2033, USD Million
Table 176 Malaysia SoC as a Service Market Market by Offering, 2022 - 2033, USD Million
Table 177 Malaysia Co-Managed Market, 2022 - 2033, USD Million
Table 178 Malaysia Fully Managed Market, 2022 - 2033, USD Million
Table 179 Malaysia SoC as a Service Market Market by Service, 2022 - 2033, USD Million
Table 180 Malaysia Detection Services Market, 2022 - 2033, USD Million
Table 181 Malaysia Incident Response Services Market, 2022 - 2033, USD Million
Table 182 Malaysia Prevention Services Market, 2022 - 2033, USD Million
Table 183 Rest of Asia Pacific SoC as a Service Market Market, 2022 - 2033, USD Million
Table 184 Rest of Asia Pacific SoC as a Service Market Market by Application, 2022 - 2033, USD Million
Table 185 Rest of Asia Pacific Application Security Market, 2022 - 2033, USD Million
Table 186 Rest of Asia Pacific Cloud Security Market, 2022 - 2033, USD Million
Table 187 Rest of Asia Pacific Endpoint Security Market, 2022 - 2033, USD Million
Table 188 Rest of Asia Pacific Network Security Market, 2022 - 2033, USD Million
Table 189 Rest of Asia Pacific Other Application Market, 2022 - 2033, USD Million
Table 190 Rest of Asia Pacific SoC as a Service Market Market by End Use, 2022 - 2033, USD Million
Table 191 Rest of Asia Pacific BFSI Market, 2022 - 2033, USD Million
Table 192 Rest of Asia Pacific Energy & Utilities Market, 2022 - 2033, USD Million
Table 193 Rest of Asia Pacific Government & Public Sector Market, 2022 - 2033, USD Million
Table 194 Rest of Asia Pacific Healthcare Market, 2022 - 2033, USD Million
Table 195 Rest of Asia Pacific IT & Telecom Market, 2022 - 2033, USD Million
Table 196 Rest of Asia Pacific Manufacturing Market, 2022 - 2033, USD Million
Table 197 Rest of Asia Pacific Other End Uses Market, 2022 - 2033, USD Million
Table 198 Rest of Asia Pacific Transportation & logistics Market, 2022 - 2033, USD Million
Table 199 Rest of Asia Pacific SoC as a Service Market Market by Enterprise Size, 2022 - 2033, USD Million
Table 200 Rest of Asia Pacific Large Enterprises Market, 2022 - 2033, USD Million
Table 201 Rest of Asia Pacific Small & Medium Enterprises (SMEs) Market, 2022 - 2033, USD Million
Table 202 Rest of Asia Pacific SoC as a Service Market Market by Offering, 2022 - 2033, USD Million
Table 203 Rest of Asia Pacific Co-Managed Market, 2022 - 2033, USD Million
Table 204 Rest of Asia Pacific Fully Managed Market, 2022 - 2033, USD Million
Table 205 Rest of Asia Pacific SoC as a Service Market Market by Service, 2022 - 2033, USD Million
Table 206 Rest of Asia Pacific Detection Services Market, 2022 - 2033, USD Million
Table 207 Rest of Asia Pacific Incident Response Services Market, 2022 - 2033, USD Million
Table 208 Rest of Asia Pacific Prevention Services Market, 2022 - 2033, USD Million
List of Figures
FIG 1 Key Factors Impacting Market
FIG 2 Market Consolidation
FIG 3 Key Customer Criteria
FIG 4 Product Life Cycle
FIG 5 Asia Pacific SoC as a Service Market Market, 2022 - 2033, USD Million
FIG 6 Asia Pacific SoC as a Service Market Market by Application, 2022 - 2033, USD Million
FIG 7 Asia Pacific Application Security Market, 2022 - 2033, USD Million
FIG 8 Asia Pacific Cloud Security Market, 2022 - 2033, USD Million
FIG 9 Asia Pacific Endpoint Security Market, 2022 - 2033, USD Million
FIG 10 Asia Pacific Network Security Market, 2022 - 2033, USD Million
FIG 11 Asia Pacific Other Application Market, 2022 - 2033, USD Million
FIG 12 Asia Pacific SoC as a Service Market Market by End Use, 2022 - 2033, USD Million
FIG 13 Asia Pacific BFSI Market, 2022 - 2033, USD Million
FIG 14 Asia Pacific Energy & Utilities Market, 2022 - 2033, USD Million
FIG 15 Asia Pacific Government & Public Sector Market, 2022 - 2033, USD Million
FIG 16 Asia Pacific Healthcare Market, 2022 - 2033, USD Million
FIG 17 Asia Pacific IT & Telecom Market, 2022 - 2033, USD Million
FIG 18 Asia Pacific Manufacturing Market, 2022 - 2033, USD Million
FIG 19 Asia Pacific Other End Uses Market, 2022 - 2033, USD Million
FIG 20 Asia Pacific Transportation & logistics Market, 2022 - 2033, USD Million
FIG 21 Asia Pacific SoC as a Service Market Market by Enterprise Size, 2022 - 2033, USD Million
FIG 22 Asia Pacific Large Enterprises Market, 2022 - 2033, USD Million
FIG 23 Asia Pacific Small & Medium Enterprises (SMEs) Market, 2022 - 2033, USD Million
FIG 24 Asia Pacific SoC as a Service Market Market by Offering, 2022 - 2033, USD Million
FIG 25 Asia Pacific Co-Managed Market, 2022 - 2033, USD Million
FIG 26 Asia Pacific Fully Managed Market, 2022 - 2033, USD Million
FIG 27 Asia Pacific SoC as a Service Market Market by Service, 2022 - 2033, USD Million
FIG 28 Asia Pacific Detection Services Market, 2022 - 2033, USD Million
FIG 29 Asia Pacific Incident Response Services Market, 2022 - 2033, USD Million
FIG 30 Asia Pacific Prevention Services Market, 2022 - 2033, USD Million
FIG 31 China SoC as a Service Market Market, 2022 - 2033, USD Million
FIG 32 China SoC as a Service Market Market by Application, 2022 - 2033, USD Million
FIG 33 China Application Security Market, 2022 - 2033, USD Million
FIG 34 China Cloud Security Market, 2022 - 2033, USD Million FIG 35 China Endpoint Security Market, 2022 - 2033, USD Million
FIG 36 China Network Security Market, 2022 - 2033, USD Million
FIG 37 China Other Application Market, 2022 - 2033, USD Million
FIG 38 China SoC as a Service Market Market by End Use, 2022 - 2033, USD Million
FIG 39 China BFSI Market, 2022 - 2033, USD Million
FIG 40 China Energy & Utilities Market, 2022 - 2033, USD Million
FIG 41 China Government & Public Sector Market, 2022 - 2033, USD Million
FIG 42 China Healthcare Market, 2022 - 2033, USD Million
FIG 43 China IT & Telecom Market, 2022 - 2033, USD Million
FIG 44 China Manufacturing Market, 2022 - 2033, USD Million
FIG 45 China Other End Uses Market, 2022 - 2033, USD Million
FIG 46 China Transportation & logistics Market, 2022 - 2033, USD Million
FIG 47 China SoC as a Service Market Market by Enterprise Size, 2022 - 2033, USD Million
FIG 48 China Large Enterprises Market, 2022 - 2033, USD Million
FIG 49 China Small & Medium Enterprises (SMEs) Market, 2022 - 2033, USD Million
FIG 50 China SoC as a Service Market Market by Offering, 2022 - 2033, USD Million
FIG 51 China Co-Managed Market, 2022 - 2033, USD Million
FIG 52 China Fully Managed Market, 2022 - 2033, USD Million
FIG 53 China SoC as a Service Market Market by Service, 2022 - 2033, USD Million
FIG 54 China Detection Services Market, 2022 - 2033, USD Million
FIG 55 China Incident Response Services Market, 2022 - 2033, USD Million
FIG 56 China Prevention Services Market, 2022 - 2033, USD Million
FIG 57 Japan SoC as a Service Market Market, 2022 - 2033, USD Million
FIG 58 Japan SoC as a Service Market Market by Application, 2022 - 2033, USD Million
FIG 59 Japan Application Security Market, 2022 - 2033, USD Million
FIG 60 Japan Cloud Security Market, 2022 - 2033, USD Million
FIG 61 Japan Endpoint Security Market, 2022 - 2033, USD Million
FIG 62 Japan Network Security Market, 2022 - 2033, USD Million
FIG 63 Japan Other Application Market, 2022 - 2033, USD Million
FIG 64 Japan SoC as a Service Market Market by End Use, 2022 - 2033, USD Million
FIG 65 Japan BFSI Market, 2022 - 2033, USD Million
FIG 66 Japan Energy & Utilities Market, 2022 - 2033, USD Million
FIG 67 Japan Government & Public Sector Market, 2022 - 2033, USD Million
FIG 68 Japan Healthcare Market, 2022 - 2033, USD Million
FIG 69 Japan IT & Telecom Market, 2022 - 2033, USD Million
FIG 70 Japan Manufacturing Market, 2022 - 2033, USD Million
FIG 71 Japan Other End Uses Market, 2022 - 2033, USD Million
FIG 72 Japan Transportation & logistics Market, 2022 - 2033, USD Million
FIG 73 Japan SoC as a Service Market Market by Enterprise Size, 2022 - 2033, USD Million
FIG 74 Japan Large Enterprises Market, 2022 - 2033, USD Million
FIG 75 Japan Small & Medium Enterprises (SMEs) Market, 2022 - 2033, USD Million
FIG 76 Japan SoC as a Service Market Market by Offering, 2022 - 2033, USD Million
FIG 77 Japan Co-Managed Market, 2022 - 2033, USD Million
FIG 78 Japan Fully Managed Market, 2022 - 2033, USD Million
FIG 79 Japan SoC as a Service Market Market by Service, 2022 - 2033, USD Million
FIG 80 Japan Detection Services Market, 2022 - 2033, USD Million
FIG 81 Japan Incident Response Services Market, 2022 - 2033, USD Million
FIG 82 Japan Prevention Services Market, 2022 - 2033, USD Million
FIG 83 India SoC as a Service Market Market, 2022 - 2033, USD Million
FIG 84 India SoC as a Service Market Market by Application, 2022 - 2033, USD Million
FIG 85 India Application Security Market, 2022 - 2033, USD Million
FIG 86 India Cloud Security Market, 2022 - 2033, USD Million
FIG 87 India Endpoint Security Market, 2022 - 2033, USD Million
FIG 88 India Network Security Market, 2022 - 2033, USD Million
FIG 89 India Other Application Market, 2022 - 2033, USD Million
FIG 90 India SoC as a Service Market Market by End Use, 2022 - 2033, USD Million
FIG 91 India BFSI Market, 2022 - 2033, USD Million
FIG 92 India Energy & Utilities Market, 2022 - 2033, USD Million
FIG 93 India Government & Public Sector Market, 2022 - 2033, USD Million
FIG 94 India Healthcare Market, 2022 - 2033, USD Million
FIG 95 India IT & Telecom Market, 2022 - 2033, USD Million
FIG 96 India Manufacturing Market, 2022 - 2033, USD Million
FIG 97 India Other End Uses Market, 2022 - 2033, USD Million
FIG 98 India Transportation & logistics Market, 2022 - 2033, USD Million
FIG 99 India SoC as a Service Market Market by Enterprise Size, 2022 - 2033, USD Million
FIG 100 India Large Enterprises Market, 2022 - 2033, USD Million
FIG 101 India Small & Medium Enterprises (SMEs) Market, 2022 - 2033, USD Million
FIG 102 India SoC as a Service Market Market by Offering, 2022 - 2033, USD Million
FIG 103 India Co-Managed Market, 2022 - 2033, USD Million
FIG 104 India Fully Managed Market, 2022 - 2033, USD Million
FIG 105 India SoC as a Service Market Market by Service, 2022 - 2033, USD Million
FIG 106 India Detection Services Market, 2022 - 2033, USD Million
FIG 107 India Incident Response Services Market, 2022 - 2033, USD Million
FIG 108 India Prevention Services Market, 2022 - 2033, USD Million
FIG 109 South Korea SoC as a Service Market Market, 2022 - 2033, USD Million
FIG 110 South Korea SoC as a Service Market Market by Application, 2022 - 2033, USD Million
FIG 111 South Korea Application Security Market, 2022 - 2033, USD Million
FIG 112 South Korea Cloud Security Market, 2022 - 2033, USD Million
FIG 113 South Korea Endpoint Security Market, 2022 - 2033, USD Million
FIG 114 South Korea Network Security Market, 2022 - 2033, USD Million
FIG 115 South Korea Other Application Market, 2022 - 2033, USD Million
FIG 116 South Korea SoC as a Service Market Market by End Use, 2022 - 2033, USD Million
FIG 117 South Korea BFSI Market, 2022 - 2033, USD Million
FIG 118 South Korea Energy & Utilities Market, 2022 - 2033, USD Million
FIG 119 South Korea Government & Public Sector Market, 2022 - 2033, USD Million
FIG 120 South Korea Healthcare Market, 2022 - 2033, USD Million
FIG 121 South Korea IT & Telecom Market, 2022 - 2033, USD Million
FIG 122 South Korea Manufacturing Market, 2022 - 2033, USD Million
FIG 123 South Korea Other End Uses Market, 2022 - 2033, USD Million
FIG 124 South Korea Transportation & logistics Market, 2022 - 2033, USD Million
FIG 125 South Korea SoC as a Service Market Market by Enterprise Size, 2022 - 2033, USD Million
FIG 126 South Korea Large Enterprises Market, 2022 - 2033, USD Million
FIG 127 South Korea Small & Medium Enterprises (SMEs) Market, 2022 - 2033, USD Million
FIG 128 South Korea SoC as a Service Market Market by Offering, 2022 - 2033, USD Million
FIG 129 South Korea Co-Managed Market, 2022 - 2033, USD Million
FIG 130 South Korea Fully Managed Market, 2022 - 2033, USD Million
FIG 131 South Korea SoC as a Service Market Market by Service, 2022 - 2033, USD Million
FIG 132 South Korea Detection Services Market, 2022 - 2033, USD Million
FIG 133 South Korea Incident Response Services Market, 2022 - 2033, USD Million
FIG 134 South Korea Prevention Services Market, 2022 - 2033, USD Million
FIG 135 Singapore SoC as a Service Market Market, 2022 - 2033, USD Million
FIG 136 Singapore SoC as a Service Market Market by Application, 2022 - 2033, USD Million
FIG 137 Singapore Application Security Market, 2022 - 2033, USD Million
FIG 138 Singapore Cloud Security Market, 2022 - 2033, USD Million
FIG 139 Singapore Endpoint Security Market, 2022 - 2033, USD Million
FIG 140 Singapore Network Security Market, 2022 - 2033, USD Million
FIG 141 Singapore Other Application Market, 2022 - 2033, USD Million
FIG 142 Singapore SoC as a Service Market Market by End Use, 2022 - 2033, USD Million
FIG 143 Singapore BFSI Market, 2022 - 2033, USD Million
FIG 144 Singapore Energy & Utilities Market, 2022 - 2033, USD Million
FIG 145 Singapore Government & Public Sector Market, 2022 - 2033, USD Million
FIG 146 Singapore Healthcare Market, 2022 - 2033, USD Million
FIG 147 Singapore IT & Telecom Market, 2022 - 2033, USD Million
FIG 148 Singapore Manufacturing Market, 2022 - 2033, USD Million
FIG 149 Singapore Other End Uses Market, 2022 - 2033, USD Million
FIG 150 Singapore Transportation & logistics Market, 2022 - 2033, USD Million
FIG 151 Singapore SoC as a Service Market Market by Enterprise Size, 2022 - 2033, USD Million
FIG 152 Singapore Large Enterprises Market, 2022 - 2033, USD Million
FIG 153 Singapore Small & Medium Enterprises (SMEs) Market, 2022 - 2033, USD Million
FIG 154 Singapore SoC as a Service Market Market by Offering, 2022 - 2033, USD Million
FIG 155 Singapore Co-Managed Market, 2022 - 2033, USD Million
FIG 156 Singapore Fully Managed Market, 2022 - 2033, USD Million
FIG 157 Singapore SoC as a Service Market Market by Service, 2022 - 2033, USD Million
FIG 158 Singapore Detection Services Market, 2022 - 2033, USD Million
FIG 159 Singapore Incident Response Services Market, 2022 - 2033, USD Million
FIG 160 Singapore Prevention Services Market, 2022 - 2033, USD Million
FIG 161 Malaysia SoC as a Service Market Market, 2022 - 2033, USD Million
FIG 162 Malaysia SoC as a Service Market Market by Application, 2022 - 2033, USD Million
FIG 163 Malaysia Application Security Market, 2022 - 2033, USD Million
FIG 164 Malaysia Cloud Security Market, 2022 - 2033, USD Million
FIG 165 Malaysia Endpoint Security Market, 2022 - 2033, USD Million
FIG 166 Malaysia Network Security Market, 2022 - 2033, USD Million
FIG 167 Malaysia Other Application Market, 2022 - 2033, USD Million
FIG 168 Malaysia SoC as a Service Market Market by End Use, 2022 - 2033, USD Million
FIG 169 Malaysia BFSI Market, 2022 - 2033, USD Million
FIG 170 Malaysia Energy & Utilities Market, 2022 - 2033, USD Million
FIG 171 Malaysia Government & Public Sector Market, 2022 - 2033, USD Million
FIG 172 Malaysia Healthcare Market, 2022 - 2033, USD Million
FIG 173 Malaysia IT & Telecom Market, 2022 - 2033, USD Million
FIG 174 Malaysia Manufacturing Market, 2022 - 2033, USD Million
FIG 175 Malaysia Other End Uses Market, 2022 - 2033, USD Million
FIG 176 Malaysia Transportation & logistics Market, 2022 - 2033, USD Million
FIG 177 Malaysia SoC as a Service Market Market by Enterprise Size, 2022 - 2033, USD Million
FIG 178 Malaysia Large Enterprises Market, 2022 - 2033, USD Million
FIG 179 Malaysia Small & Medium Enterprises (SMEs) Market, 2022 - 2033, USD Million
FIG 180 Malaysia SoC as a Service Market Market by Offering, 2022 - 2033, USD Million
FIG 181 Malaysia Co-Managed Market, 2022 - 2033, USD Million
FIG 182 Malaysia Fully Managed Market, 2022 - 2033, USD Million
FIG 183 Malaysia SoC as a Service Market Market by Service, 2022 - 2033, USD Million
FIG 184 Malaysia Detection Services Market, 2022 - 2033, USD Million
FIG 185 Malaysia Incident Response Services Market, 2022 - 2033, USD Million
FIG 186 Malaysia Prevention Services Market, 2022 - 2033, USD Million
FIG 187 Rest of Asia Pacific SoC as a Service Market Market, 2022 - 2033, USD Million
FIG 188 Rest of Asia Pacific SoC as a Service Market Market by Application, 2022 - 2033, USD Million
FIG 189 Rest of Asia Pacific Application Security Market, 2022 - 2033, USD Million
FIG 190 Rest of Asia Pacific Cloud Security Market, 2022 - 2033, USD Million
FIG 191 Rest of Asia Pacific Endpoint Security Market, 2022 - 2033, USD Million
FIG 192 Rest of Asia Pacific Network Security Market, 2022 - 2033, USD Million
FIG 193 Rest of Asia Pacific Other Application Market, 2022 - 2033, USD Million
FIG 194 Rest of Asia Pacific SoC as a Service Market Market by End Use, 2022 - 2033, USD Million
FIG 195 Rest of Asia Pacific BFSI Market, 2022 - 2033, USD Million
FIG 196 Rest of Asia Pacific Energy & Utilities Market, 2022 - 2033, USD Million
FIG 197 Rest of Asia Pacific Government & Public Sector Market, 2022 - 2033, USD Million
FIG 198 Rest of Asia Pacific Healthcare Market, 2022 - 2033, USD Million
FIG 199 Rest of Asia Pacific IT & Telecom Market, 2022 - 2033, USD Million
FIG 200 Rest of Asia Pacific Manufacturing Market, 2022 - 2033, USD Million
FIG 201 Rest of Asia Pacific Other End Uses Market, 2022 - 2033, USD Million
FIG 202 Rest of Asia Pacific Transportation & logistics Market, 2022 - 2033, USD Million
FIG 203 Rest of Asia Pacific SoC as a Service Market Market by Enterprise Size, 2022 - 2033, USD Million
FIG 204 Rest of Asia Pacific Large Enterprises Market, 2022 - 2033, USD Million
FIG 205 Rest of Asia Pacific Small & Medium Enterprises (SMEs) Market, 2022 - 2033, USD Million
FIG 206 Rest of Asia Pacific SoC as a Service Market Market by Offering, 2022 - 2033, USD Million
FIG 207 Rest of Asia Pacific Co-Managed Market, 2022 - 2033, USD Million
FIG 208 Rest of Asia Pacific Fully Managed Market, 2022 - 2033, USD Million
FIG 209 Rest of Asia Pacific SoC as a Service Market Market by Service, 2022 - 2033, USD Million
FIG 210 Rest of Asia Pacific Detection Services Market, 2022 - 2033, USD Million
FIG 211 Rest of Asia Pacific Incident Response Services Market, 2022 - 2033, USD Million
FIG 212 Rest of Asia Pacific Prevention Services Market, 2022 - 2033, USD Million