Asia Pacific Recreational Vehicle Market Size, Share & Industry Analysis Report By Propulsion Type (Non-motorized and Motorized), By Application (Personal Use and Commercial Use), By Type (Towable, Class A, Class C, and Class B), By Country and Forecast, 2026 - 2033
Published Date : 22-Sep-2026 |
Pages: 460 |
Report Format: PDF + Excel |
COVID-19 Impact on the Asia Pacific Recreational Vehicle Market
The Asia Pacific Recreational Vehicle Market is expected to reach USD 10.7 billion by 2030, growing at a CAGR of 5.4% during (2026 - 2033).
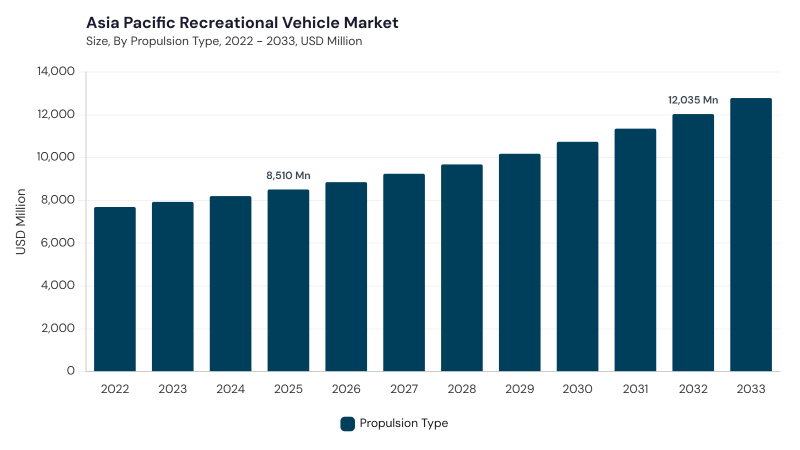
The Asia Pacific Recreational Vehicle Market evolved from limited adoption of imported caravans and motorhomes into a more localized and technologically diversified leisure mobility sector. Early development was constrained by limited RV infrastructure, consumer awareness, and domestic manufacturing capabilities, but rising disposable incomes, domestic tourism, and outdoor recreation gradually expanded demand. Local assembly and manufacturing improved affordability and enabled products to be adapted to regional road, climate, and lifestyle requirements. More recently, lightweight materials, modular interiors, connected vehicle platforms, smart energy systems, and alternative propulsion technologies have strengthened product sophistication and broadened market appeal.
Sustainability, digital connectivity, domestic tourism, and compact vehicle design are shaping current market development across Asia Pacific. Manufacturers are increasingly exploring electric and hybrid drivetrains, solar energy systems, smart vehicle management, IoT-enabled diagnostics, connected infotainment, and advanced navigation to improve efficiency and travel convenience. Rising middle-class spending and experiential tourism are expanding interest in premium and customized RVs, while younger consumers increasingly favor compact and flexible campervan formats. At the same time, high acquisition costs, uneven campground infrastructure, fragmented regulations, service-network limitations, and varying road conditions continue to influence adoption across regional markets.
Propulsion Type Outlook
Based on Propulsion Type, the market is segmented into Non-motorized and Motorized. The Non-motorized market dominated the Asia Pacific Recreational Vehicle Market by Propulsion Type in 2025, and would continue to be a dominant market till 2033; thereby, achieving a market value of USD 7.5 billion by 2030, growing at a CAGR of 5.1 % during the forecast period. The Motorized market is expected to witness a CAGR of 6.1% during (2026 - 2033).
Non-motorized RVs include trailers, caravans, and camper trailers that provide flexibility, lower mechanical complexity, and the ability to use a separate towing vehicle. Lightweight construction, modular layouts, improved aerodynamics, modern interiors, and compatibility with off-road or long-distance travel are strengthening their appeal. Motorized RVs include self-propelled motorhomes and campervans designed for long-distance touring, luxury travel, and integrated accommodation. Demand is supported by convenience, self-contained mobility, smart connectivity, and growing development of electric and hybrid powertrains, although higher upfront costs and uneven charging infrastructure remain important constraints.
Application Outlook
Based on Application, the market is segmented into Personal Use and Commercial Use. The Personal Use market dominated the Asia Pacific Recreational Vehicle Market by Application in 2025, and would continue to be a dominant market till 2033; thereby, achieving a market value of USD 7.7 billion by 2030, growing at a CAGR of 5 % during the forecast period. The Commercial Use market is expected to witness a CAGR of 6.3% during (2026 - 2033).
Personal Use includes privately owned motorhomes, campervans, and travel trailers used for family vacations, road trips, adventure travel, weekend recreation, and extended touring. Consumers increasingly prioritize comfort, compact dimensions, connected technologies, energy-efficient systems, and customizable interiors suited to diverse road conditions. Commercial Use includes rental fleets, tourism companies, campsites, adventure-travel operators, mobile offices, hospitality services, and other business applications. Commercial operators emphasize fleet efficiency, durability, digital tracking, maintenance support, regulatory compliance, and flexible access models that broaden participation without requiring direct ownership.
Type Outlook
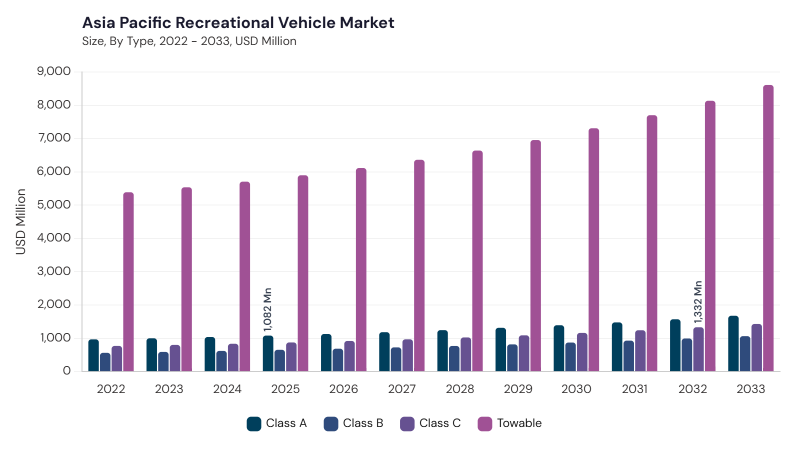
Based on Type, the market is segmented into Towable, Class A, Class C, and Class B. Towable RVs provide flexibility, modularity, and comparatively lower entry costs, supporting first-time users and family travel. Class A motorhomes serve affluent consumers seeking spacious interiors, extensive amenities, and premium long-distance touring capabilities.
Class C motorhomes provide a practical balance of accommodation space, maneuverability, and affordability, making them suitable for family travel and rental fleets. Class B campervans emphasize compact dimensions, urban maneuverability, modular interiors, and easier operation, supporting growing interest among younger travelers, couples, solo users, and consumers adopting flexible campervan lifestyles.
Free Valuable Insights: Recreational Vehicle Market is Predicted to reach USD 70.0 Billion billion by 2033, at a CAGR of 4.2%
Country Outlook
Based on Country, the market is segmented into China, Japan, India, South Korea, Singapore, Malaysia, and Rest of Asia Pacific. The China market dominated the Asia Pacific Recreational Vehicle Market by Country in 2025, and would continue to be a dominant market till 2033; thereby, achieving a market value of USD 3.8 billion by 2030, growing at a CAGR of 3.9 % during the forecast period. The Japan market is expected to witness a CAGR of 4.6% during (2026 - 2033). Additionally, The India market is expected to witness a CAGR of 6.8% during (2026 - 2033).
Across Asia Pacific, RV adoption is being shaped by domestic tourism, electrification, digital connectivity, localization, and compact vehicle design. China emphasizes electric RV development, smart systems, domestic manufacturing, tourism-focused infrastructure, and localized service networks, while Japan focuses on compact vehicles, hybrid and electric powertrains, autonomous technologies, smart connectivity, and premium outdoor leisure. India is advancing connected RVs, solar energy systems, flexible ownership, localized designs, and domestic adventure tourism, whereas South Korea emphasizes smart connectivity, lithium-ion systems, hybrid and electric platforms, and rental-based travel. Singapore focuses on compact modular vehicles, electrification, telematics, V2X connectivity, and urban-compatible designs, while Malaysia emphasizes eco-conscious RVs, IoT-enabled controls, modular interiors, localized assembly, and tourism partnerships. Rest of Asia Pacific continues to develop energy-efficient RVs, connected technologies, compact layouts, local manufacturing, and region-specific recreational mobility solutions.
List of Key Companies Profiled
- THOR Industries
- Forest River
- Trigano
- Winnebago Industries
- Knaus Tabbert
- Rapido Group
- REV Group
- Hobby
- Brinkley RV
- Alliance RV
Asia Pacific Recreational Vehicle Market Report Segmentation
By Propulsion Type
- Non-motorized
- Motorized
By Application
- Personal Use
- Commercial Use
By Type
- Towable
- Class A
- Class C
- Class B
By Country
- China
- Japan
- India
- South Korea
- Singapore
- Malaysia
- Rest of Asia Pacific
1.1 Market Overview
1.2 Key Factors Impacting Market
1.2.1 Market Drivers
1.2.2 Market Restraints
1.2.3 Market Opportunities
1.2.4 Market Challenges
1.2.5 Market Trends
1.2.6 State of Competition
1.2.7 Market Consolidation
1.2.8 Key Customer Criteria
1.3 Product Life Cycle
1.4 Segmentation By Propulsion Type
1.4.1 Motorized
1.4.2 Non-motorized
1.5 Segmentation By Application
1.5.1 Personal Use
1.5.2 Commercial Use
1.6 Segmentation By Type
1.6.1 Towable
1.6.2 Class A
1.6.3 Class C
1.6.4 Class B
1.7 Segmentation By Country
1.7.1 China
1.7.1.1 Segmentation By Propulsion Type
1.7.1.1.1 Motorized
1.7.1.1.2 Non-motorized
1.7.1.2 Segmentation By Application
1.7.1.2.1 Personal Use
1.7.1.2.2 Commercial Use
1.7.1.3 Segmentation By Type
1.7.1.3.1 Towable
1.7.1.3.2 Class A
1.7.1.3.3 Class C
1.7.1.3.4 Class B
1.7.2 Japan
1.7.2.1 Segmentation By Propulsion Type
1.7.2.1.1 Motorized
1.7.2.1.2 Non-motorized
1.7.2.2 Segmentation By Application
1.7.2.2.1 Personal Use
1.7.2.2.2 Commercial Use
1.7.2.3 Segmentation By Type
1.7.2.3.1 Towable
1.7.2.3.2 Class A
1.7.2.3.3 Class C
1.7.2.3.4 Class B
1.7.3 India
1.7.3.1 Segmentation By Propulsion Type
1.7.3.1.1 Motorized
1.7.3.1.2 Non-motorized
1.7.3.2 Segmentation By Application
1.7.3.2.1 Personal Use
1.7.3.2.2 Commercial Use
1.7.3.3 Segmentation By Type
1.7.3.3.1 Towable
1.7.3.3.2 Class A
1.7.3.3.3 Class C
1.7.3.3.4 Class B
1.7.4 South Korea
1.7.4.1 Segmentation By Propulsion Type
1.7.4.1.1 Motorized
1.7.4.1.2 Non-motorized
1.7.4.2 Segmentation By Application
1.7.4.2.1 Personal Use
1.7.4.2.2 Commercial Use
1.7.4.3 Segmentation By Type
1.7.4.3.1 Towable
1.7.4.3.2 Class A
1.7.4.3.3 Class C
1.7.4.3.4 Class B
1.7.5 Singapore
1.7.5.1 Segmentation By Propulsion Type
1.7.5.1.1 Motorized
1.7.5.1.2 Non-motorized
1.7.5.2 Segmentation By Application
1.7.5.2.1 Personal Use
1.7.5.2.2 Commercial Use
1.7.5.3 Segmentation By Type
1.7.5.3.1 Towable
1.7.5.3.2 Class A
1.7.5.3.3 Class C
1.7.5.3.4 Class B
1.7.6 Malaysia
1.7.6.1 Segmentation By Propulsion Type
1.7.6.1.1 Motorized
1.7.6.1.2 Non-motorized
1.7.6.2 Segmentation By Application
1.7.6.2.1 Personal Use
1.7.6.2.2 Commercial Use
1.7.6.3 Segmentation By Type
1.7.6.3.1 Towable
1.7.6.3.2 Class A
1.7.6.3.3 Class C
1.7.6.3.4 Class B
1.7.7 Rest of Asia Pacific
1.7.7.1 Segmentation By Propulsion Type
1.7.7.1.1 Motorized
1.7.7.1.2 Non-motorized
1.7.7.2 Segmentation By Application
1.7.7.2.1 Personal Use
1.7.7.2.2 Commercial Use
1.7.7.3 Segmentation By Type
1.7.7.3.1 Towable
1.7.7.3.2 Class A
1.7.7.3.3 Class C
1.7.7.3.4 Class B
Chapter 2. Company Snapshots
2.1 THOR Industries
2.1.1 Business Overview
2.1.2 Key Information
2.1.3 Company Focus on Recreational Vehicle Market
2.1.4 Strategic Insights
2.1.5 Strategy Deployed
2.1.6 SWOT Analysis
2.1.7 Portfolio Matrix
2.1.8 Key Differentiators
2.1.9 Future Outlook
2.2 Forest River
2.2.1 Business Overview
2.2.2 Key Information
2.2.3 Company Focus on Recreational Vehicle Market
2.2.4 Strategic Insights
2.2.5 Strategy Deployed
2.2.6 SWOT Analysis
2.2.7 Key Differentiators
2.2.8 Future Outlook
2.3 Trigano
2.3.1 Business Overview
2.3.2 Key Information
2.3.3 Company Focus on Recreational Vehicle Market
2.3.4 Strategic Insights
2.3.5 Strategy Deployed
2.3.6 SWOT Analysis
2.3.7 Key Differentiators
2.3.8 Future Outlook
2.4 Winnebago Industries
2.4.1 Business Overview
2.4.2 Key Information
2.4.3 Company Focus on Recreational Vehicle Market
2.4.4 Strategic Insights
2.4.5 Strategy Deployed
2.4.6 SWOT Analysis
2.4.7 Key Differentiators
2.4.8 Future Outlook
2.5 Knaus Tabbert
2.5.1 Business Overview
2.5.2 Key Information
2.5.3 Company Focus on Recreational Vehicle Market
2.5.4 Strategic Insights
2.5.5 Strategy Deployed
2.5.6 SWOT Analysis
2.5.7 Key Differentiators
2.5.8 Future Outlook
2.6 Rapido Group
2.6.1 Business Overview
2.6.2 Key Information
2.6.3 Company Focus on Recreational Vehicle Market
2.6.4 Strategic Insights
2.6.5 Strategy Deployed
2.6.6 SWOT Analysis
2.6.7 Key Differentiators
2.6.8 Future Outlook
2.7 REV Group
2.7.1 Business Overview
2.7.2 Key Information
2.7.3 Company Focus on Recreational Vehicle Market
2.7.4 Strategic Insights
2.7.5 Strategy Deployed
2.7.6 SWOT Analysis
2.7.7 Key Differentiators
2.7.8 Future Outlook
2.8 Hobby
2.8.1 Business Overview
2.8.2 Key Information
2.8.3 Company Focus on Recreational Vehicle Market
2.8.4 Strategic Insights
2.8.5 Strategy Deployed
2.8.6 SWOT Analysis
2.8.7 Key Differentiators
2.8.8 Future Outlook
2.9 Brinkley RV
2.9.1 Business Overview
2.9.2 Key Information
2.9.3 Company Focus on Recreational Vehicle Market
2.9.4 Strategic Insights
2.9.5 Strategy Deployed
2.9.6 SWOT Analysis
2.9.7 Key Differentiators
2.9.8 Future Outlook
2.10 Alliance RV
2.10.1 Business Overview
2.10.2 Key Information
2.10.3 Company Focus on Recreational Vehicle Market
2.10.4 Strategic Insights
2.10.5 Strategy Deployed
2.10.6 SWOT Analysis
2.10.7 Key Differentiators
2.10.8 Future Outlook
Table 1 Asia Pacific Recreational Vehicle Market Market, 2022 - 2033, USD Million
Table 2 Asia Pacific Recreational Vehicle Market Market by Application, 2022 - 2033, USD Million
Table 3 Asia Pacific Commercial Use Market, 2022 - 2033, USD Million
Table 4 Asia Pacific Personal Use Market, 2022 - 2033, USD Million
Table 5 Asia Pacific Recreational Vehicle Market Market by Propulsion Type, 2022 - 2033, USD Million
Table 6 Asia Pacific Motorized Market, 2022 - 2033, USD Million
Table 7 Asia Pacific Non-motorized Market, 2022 - 2033, USD Million
Table 8 Asia Pacific Recreational Vehicle Market Market by Type, 2022 - 2033, USD Million
Table 9 Asia Pacific Class A Market, 2022 - 2033, USD Million
Table 10 Asia Pacific Class B Market, 2022 - 2033, USD Million
Table 11 Asia Pacific Class C Market, 2022 - 2033, USD Million
Table 12 Asia Pacific Towable Market, 2022 - 2033, USD Million
Table 13 China Recreational Vehicle Market Market, 2022 - 2033, USD Million
Table 14 China Recreational Vehicle Market Market by Application, 2022 - 2033, USD Million
Table 15 China Commercial Use Market, 2022 - 2033, USD Million
Table 16 China Personal Use Market, 2022 - 2033, USD Million
Table 17 China Recreational Vehicle Market Market by Propulsion Type, 2022 - 2033, USD Million
Table 18 China Motorized Market, 2022 - 2033, USD Million
Table 19 China Non-motorized Market, 2022 - 2033, USD Million
Table 20 China Recreational Vehicle Market Market by Type, 2022 - 2033, USD Million
Table 21 China Class A Market, 2022 - 2033, USD Million
Table 22 China Class B Market, 2022 - 2033, USD Million
Table 23 China Class C Market, 2022 - 2033, USD Million
Table 24 China Towable Market, 2022 - 2033, USD Million
Table 25 Japan Recreational Vehicle Market Market, 2022 - 2033, USD Million
Table 26 Japan Recreational Vehicle Market Market by Application, 2022 - 2033, USD Million
Table 27 Japan Commercial Use Market, 2022 - 2033, USD Million
Table 28 Japan Personal Use Market, 2022 - 2033, USD Million
Table 29 Japan Recreational Vehicle Market Market by Propulsion Type, 2022 - 2033, USD Million
Table 30 Japan Motorized Market, 2022 - 2033, USD Million
Table 31 Japan Non-motorized Market, 2022 - 2033, USD Million
Table 32 Japan Recreational Vehicle Market Market by Type, 2022 - 2033, USD Million
Table 33 Japan Class A Market, 2022 - 2033, USD Million
Table 34 Japan Class B Market, 2022 - 2033, USD Million
Table 35 Japan Class C Market, 2022 - 2033, USD Million
Table 36 Japan Towable Market, 2022 - 2033, USD Million
Table 37 India Recreational Vehicle Market Market, 2022 - 2033, USD Million
Table 38 India Recreational Vehicle Market Market by Application, 2022 - 2033, USD Million
Table 39 India Commercial Use Market, 2022 - 2033, USD Million
Table 40 India Personal Use Market, 2022 - 2033, USD Million
Table 41 India Recreational Vehicle Market Market by Propulsion Type, 2022 - 2033, USD Million
Table 42 India Motorized Market, 2022 - 2033, USD Million
Table 43 India Non-motorized Market, 2022 - 2033, USD Million
Table 44 India Recreational Vehicle Market Market by Type, 2022 - 2033, USD Million
Table 45 India Class A Market, 2022 - 2033, USD Million
Table 46 India Class B Market, 2022 - 2033, USD Million
Table 47 India Class C Market, 2022 - 2033, USD Million
Table 48 India Towable Market, 2022 - 2033, USD Million
Table 49 South Korea Recreational Vehicle Market Market, 2022 - 2033, USD Million
Table 50 South Korea Recreational Vehicle Market Market by Application, 2022 - 2033, USD Million
Table 51 South Korea Commercial Use Market, 2022 - 2033, USD Million
Table 52 South Korea Personal Use Market, 2022 - 2033, USD Million
Table 53 South Korea Recreational Vehicle Market Market by Propulsion Type, 2022 - 2033, USD Million
Table 54 South Korea Motorized Market, 2022 - 2033, USD Million
Table 55 South Korea Non-motorized Market, 2022 - 2033, USD Million
Table 56 South Korea Recreational Vehicle Market Market by Type, 2022 - 2033, USD Million
Table 57 South Korea Class A Market, 2022 - 2033, USD Million
Table 58 South Korea Class B Market, 2022 - 2033, USD Million
Table 59 South Korea Class C Market, 2022 - 2033, USD Million
Table 60 South Korea Towable Market, 2022 - 2033, USD Million
Table 61 Singapore Recreational Vehicle Market Market, 2022 - 2033, USD Million
Table 62 Singapore Recreational Vehicle Market Market by Application, 2022 - 2033, USD Million
Table 63 Singapore Commercial Use Market, 2022 - 2033, USD Million
Table 64 Singapore Personal Use Market, 2022 - 2033, USD Million
Table 65 Singapore Recreational Vehicle Market Market by Propulsion Type, 2022 - 2033, USD Million
Table 66 Singapore Motorized Market, 2022 - 2033, USD Million
Table 67 Singapore Non-motorized Market, 2022 - 2033, USD Million
Table 68 Singapore Recreational Vehicle Market Market by Type, 2022 - 2033, USD Million
Table 69 Singapore Class A Market, 2022 - 2033, USD Million
Table 70 Singapore Class B Market, 2022 - 2033, USD Million
Table 71 Singapore Class C Market, 2022 - 2033, USD Million
Table 72 Singapore Towable Market, 2022 - 2033, USD Million
Table 73 Malaysia Recreational Vehicle Market Market, 2022 - 2033, USD Million
Table 74 Malaysia Recreational Vehicle Market Market by Application, 2022 - 2033, USD Million
Table 75 Malaysia Commercial Use Market, 2022 - 2033, USD Million
Table 76 Malaysia Personal Use Market, 2022 - 2033, USD Million
Table 77 Malaysia Recreational Vehicle Market Market by Propulsion Type, 2022 - 2033, USD Million
Table 78 Malaysia Motorized Market, 2022 - 2033, USD Million
Table 79 Malaysia Non-motorized Market, 2022 - 2033, USD Million
Table 80 Malaysia Recreational Vehicle Market Market by Type, 2022 - 2033, USD Million
Table 81 Malaysia Class A Market, 2022 - 2033, USD Million
Table 82 Malaysia Class B Market, 2022 - 2033, USD Million
Table 83 Malaysia Class C Market, 2022 - 2033, USD Million
Table 84 Malaysia Towable Market, 2022 - 2033, USD Million
Table 85 Rest of Asia Pacific Recreational Vehicle Market Market, 2022 - 2033, USD Million
Table 86 Rest of Asia Pacific Recreational Vehicle Market Market by Application, 2022 - 2033, USD Million
Table 87 Rest of Asia Pacific Commercial Use Market, 2022 - 2033, USD Million
Table 88 Rest of Asia Pacific Personal Use Market, 2022 - 2033, USD Million
Table 89 Rest of Asia Pacific Recreational Vehicle Market Market by Propulsion Type, 2022 - 2033, USD Million
Table 90 Rest of Asia Pacific Motorized Market, 2022 - 2033, USD Million
Table 91 Rest of Asia Pacific Non-motorized Market, 2022 - 2033, USD Million
Table 92 Rest of Asia Pacific Recreational Vehicle Market Market by Type, 2022 - 2033, USD Million
Table 93 Rest of Asia Pacific Class A Market, 2022 - 2033, USD Million
Table 94 Rest of Asia Pacific Class B Market, 2022 - 2033, USD Million
Table 95 Rest of Asia Pacific Class C Market, 2022 - 2033, USD Million
Table 96 Rest of Asia Pacific Towable Market, 2022 - 2033, USD Million
List of Figures
FIG 1 Key Factors Impacting Market
FIG 2 Market Consolidation
FIG 3 Key Customer Criteria
FIG 4 Product Life Cycle
FIG 5 Asia Pacific Recreational Vehicle Market Market, 2022 - 2033, USD Million
FIG 6 Asia Pacific Recreational Vehicle Market Market by Application, 2022 - 2033, USD Million
FIG 7 Asia Pacific Commercial Use Market, 2022 - 2033, USD Million
FIG 8 Asia Pacific Personal Use Market, 2022 - 2033, USD Million
FIG 9 Asia Pacific Recreational Vehicle Market Market by Propulsion Type, 2022 - 2033, USD Million
FIG 10 Asia Pacific Motorized Market, 2022 - 2033, USD Million
FIG 11 Asia Pacific Non-motorized Market, 2022 - 2033, USD Million
FIG 12 Asia Pacific Recreational Vehicle Market Market by Type, 2022 - 2033, USD Million
FIG 13 Asia Pacific Class A Market, 2022 - 2033, USD Million
FIG 14 Asia Pacific Class B Market, 2022 - 2033, USD Million
FIG 15 Asia Pacific Class C Market, 2022 - 2033, USD Million
FIG 16 Asia Pacific Towable Market, 2022 - 2033, USD Million
FIG 17 China Recreational Vehicle Market Market, 2022 - 2033, USD Million
FIG 18 China Recreational Vehicle Market Market by Application, 2022 - 2033, USD Million
FIG 19 China Commercial Use Market, 2022 - 2033, USD Million
FIG 20 China Personal Use Market, 2022 - 2033, USD Million
FIG 21 China Recreational Vehicle Market Market by Propulsion Type, 2022 - 2033, USD Million
FIG 22 China Motorized Market, 2022 - 2033, USD Million
FIG 23 China Non-motorized Market, 2022 - 2033, USD Million
FIG 24 China Recreational Vehicle Market Market by Type, 2022 - 2033, USD Million
FIG 25 China Class A Market, 2022 - 2033, USD Million
FIG 26 China Class B Market, 2022 - 2033, USD Million
FIG 27 China Class C Market, 2022 - 2033, USD Million
FIG 28 China Towable Market, 2022 - 2033, USD Million
FIG 29 Japan Recreational Vehicle Market Market, 2022 - 2033, USD Million
FIG 30 Japan Recreational Vehicle Market Market by Application, 2022 - 2033, USD Million
FIG 31 Japan Commercial Use Market, 2022 - 2033, USD Million
FIG 32 Japan Personal Use Market, 2022 - 2033, USD Million
FIG 33 Japan Recreational Vehicle Market Market by Propulsion Type, 2022 - 2033, USD Million
FIG 34 Japan Motorized Market, 2022 - 2033, USD Million
FIG 35 Japan Non-motorized Market, 2022 - 2033, USD Million
FIG 36 Japan Recreational Vehicle Market Market by Type, 2022 - 2033, USD Million
FIG 37 Japan Class A Market, 2022 - 2033, USD Million
FIG 38 Japan Class B Market, 2022 - 2033, USD Million
FIG 39 Japan Class C Market, 2022 - 2033, USD Million
FIG 40 Japan Towable Market, 2022 - 2033, USD Million
FIG 41 India Recreational Vehicle Market Market, 2022 - 2033, USD Million
FIG 42 India Recreational Vehicle Market Market by Application, 2022 - 2033, USD Million
FIG 43 India Commercial Use Market, 2022 - 2033, USD Million
FIG 44 India Personal Use Market, 2022 - 2033, USD Million
FIG 45 India Recreational Vehicle Market Market by Propulsion Type, 2022 - 2033, USD Million
FIG 46 India Motorized Market, 2022 - 2033, USD Million
FIG 47 India Non-motorized Market, 2022 - 2033, USD Million
FIG 48 India Recreational Vehicle Market Market by Type, 2022 - 2033, USD Million
FIG 49 India Class A Market, 2022 - 2033, USD Million
FIG 50 India Class B Market, 2022 - 2033, USD Million
FIG 51 India Class C Market, 2022 - 2033, USD Million
FIG 52 India Towable Market, 2022 - 2033, USD Million
FIG 53 South Korea Recreational Vehicle Market Market, 2022 - 2033, USD Million
FIG 54 South Korea Recreational Vehicle Market Market by Application, 2022 - 2033, USD Million
FIG 55 South Korea Commercial Use Market, 2022 - 2033, USD Million
FIG 56 South Korea Personal Use Market, 2022 - 2033, USD Million
FIG 57 South Korea Recreational Vehicle Market Market by Propulsion Type, 2022 - 2033, USD Million
FIG 58 South Korea Motorized Market, 2022 - 2033, USD Million
FIG 59 South Korea Non-motorized Market, 2022 - 2033, USD Million
FIG 60 South Korea Recreational Vehicle Market Market by Type, 2022 - 2033, USD Million
FIG 61 South Korea Class A Market, 2022 - 2033, USD Million
FIG 62 South Korea Class B Market, 2022 - 2033, USD Million
FIG 63 South Korea Class C Market, 2022 - 2033, USD Million
FIG 64 South Korea Towable Market, 2022 - 2033, USD Million
FIG 65 Singapore Recreational Vehicle Market Market, 2022 - 2033, USD Million
FIG 66 Singapore Recreational Vehicle Market Market by Application, 2022 - 2033, USD Million
FIG 67 Singapore Commercial Use Market, 2022 - 2033, USD Million
FIG 68 Singapore Personal Use Market, 2022 - 2033, USD Million
FIG 69 Singapore Recreational Vehicle Market Market by Propulsion Type, 2022 - 2033, USD Million
FIG 70 Singapore Motorized Market, 2022 - 2033, USD Million
FIG 71 Singapore Non-motorized Market, 2022 - 2033, USD Million
FIG 72 Singapore Recreational Vehicle Market Market by Type, 2022 - 2033, USD Million
FIG 73 Singapore Class A Market, 2022 - 2033, USD Million
FIG 74 Singapore Class B Market, 2022 - 2033, USD Million
FIG 75 Singapore Class C Market, 2022 - 2033, USD Million
FIG 76 Singapore Towable Market, 2022 - 2033, USD Million
FIG 77 Malaysia Recreational Vehicle Market Market, 2022 - 2033, USD Million
FIG 78 Malaysia Recreational Vehicle Market Market by Application, 2022 - 2033, USD Million
FIG 79 Malaysia Commercial Use Market, 2022 - 2033, USD Million
FIG 80 Malaysia Personal Use Market, 2022 - 2033, USD Million
FIG 81 Malaysia Recreational Vehicle Market Market by Propulsion Type, 2022 - 2033, USD Million
FIG 82 Malaysia Motorized Market, 2022 - 2033, USD Million
FIG 83 Malaysia Non-motorized Market, 2022 - 2033, USD Million
FIG 84 Malaysia Recreational Vehicle Market Market by Type, 2022 - 2033, USD Million
FIG 85 Malaysia Class A Market, 2022 - 2033, USD Million
FIG 86 Malaysia Class B Market, 2022 - 2033, USD Million
FIG 87 Malaysia Class C Market, 2022 - 2033, USD Million
FIG 88 Malaysia Towable Market, 2022 - 2033, USD Million
FIG 89 Rest of Asia Pacific Recreational Vehicle Market Market, 2022 - 2033, USD Million
FIG 90 Rest of Asia Pacific Recreational Vehicle Market Market by Application, 2022 - 2033, USD Million
FIG 91 Rest of Asia Pacific Commercial Use Market, 2022 - 2033, USD Million
FIG 92 Rest of Asia Pacific Personal Use Market, 2022 - 2033, USD Million
FIG 93 Rest of Asia Pacific Recreational Vehicle Market Market by Propulsion Type, 2022 - 2033, USD Million
FIG 94 Rest of Asia Pacific Motorized Market, 2022 - 2033, USD Million
FIG 95 Rest of Asia Pacific Non-motorized Market, 2022 - 2033, USD Million
FIG 96 Rest of Asia Pacific Recreational Vehicle Market Market by Type, 2022 - 2033, USD Million
FIG 97 Rest of Asia Pacific Class A Market, 2022 - 2033, USD Million
FIG 98 Rest of Asia Pacific Class B Market, 2022 - 2033, USD Million
FIG 99 Rest of Asia Pacific Class C Market, 2022 - 2033, USD Million
FIG 100 Rest of Asia Pacific Towable Market, 2022 - 2033, USD Million