Asia Pacific Gaming Peripheral Market Size, Share & Industry Analysis Report By Device (PC, and Gaming Consoles), By Type (Wired, and Wireless), By Distribution Channel (Offline, and Online), By Product (Headsets, Keyboard, Controller, and Mice), By Country Outlook and Forecast, 2026 - 2033
Published Date : 02-Sep-2026 |
Pages: 280 |
Report Format: PDF + Excel |
COVID-19 Impact on the Asia Pacific Gaming Peripheral Market
The Asia Pacific Gaming Peripheral Market is expected to reach USD 4.0 billion by 2030, growing at a CAGR of 11.6% during (2026 – 2033).
Gaming peripherals across Asia Pacific evolved from basic PC accessories in the early 2000s into specialized hardware designed for higher precision, responsiveness, comfort, and immersive gameplay. Early adoption centered on mechanical keyboards, gaming mice, and headsets, while advances in sensor accuracy, RGB lighting, ergonomic design, and software customization expanded product sophistication. The rapid growth of esports, mobile gaming, and competitive online gaming further broadened demand across multiple platforms.
Wireless connectivity, mobile-first gaming, AI integration, and ergonomic customization are increasingly shaping regional market development. Improvements in wireless chipsets, battery performance, and low-latency protocols are accelerating the shift toward cable-free setups, while mobile and cloud gaming are encouraging compact, portable, and multi-platform accessories. AI-enabled peripherals are introducing adaptive controls, predictive input adjustments, performance analytics, and personalized haptic feedback that strengthen product differentiation.
Device Outlook
Based on Device, the market is segmented into PC and Gaming Consoles. The PC market dominated the Asia Pacific Gaming Peripheral Market by Device in 2025, and would continue to be a dominant market till 2033; thereby, achieving a market value of USD 2.3 billion by 2030, growing at a CAGR of 11.4 % during the forecast period. The Gaming Consoles market is expected to witness a CAGR of 12% during (2026 - 2033).
PC peripherals include gaming keyboards, mice, headsets, controllers, and other specialized accessories that support precision, customization, responsiveness, and competitive gameplay. Demand is reinforced by high polling rates, mechanical switches, programmable controls, advanced optical sensors, RGB lighting, ergonomic designs, and increasingly low-latency wireless technology. Gaming Consoles continue to support demand for controllers, headsets, charging docks, motion-sensor accessories, and other compatible peripherals designed for intuitive and immersive gameplay. Wireless connectivity, haptic feedback, rechargeable designs, and cross-platform compatibility are strengthening console accessory adoption, particularly as multiplayer, cloud, and family-oriented gaming ecosystems expand.
Type Outlook
Based on Type, the market is segmented into Wired and Wireless. The Wired market dominated the Asia Pacific Gaming Peripheral Market by Type in 2025, and would continue to be a dominant market till 2033; thereby, achieving a market value of USD 2.0 billion by 2030, growing at a CAGR of 11.3 % during the forecast period. The Wireless market is expected to witness a CAGR of 12.1% during (2026 - 2033).
Wired peripherals remain important for gaming mice, keyboards, headsets, and controllers where stable performance, minimal input lag, uninterrupted power, and affordability are critical. High-speed USB connectivity, braided cables, durable construction, mechanical switches, and responsive sensors continue to support adoption across competitive gaming environments. Wireless peripherals are expanding rapidly as Bluetooth, proprietary RF protocols, battery efficiency, fast charging, and signal stability improve. Greater mobility, cleaner setups, multi-device compatibility, and lightweight construction are strengthening consumer interest, although price premiums and occasional concerns around connectivity or battery performance can still influence adoption.
Distribution Channel Outlook
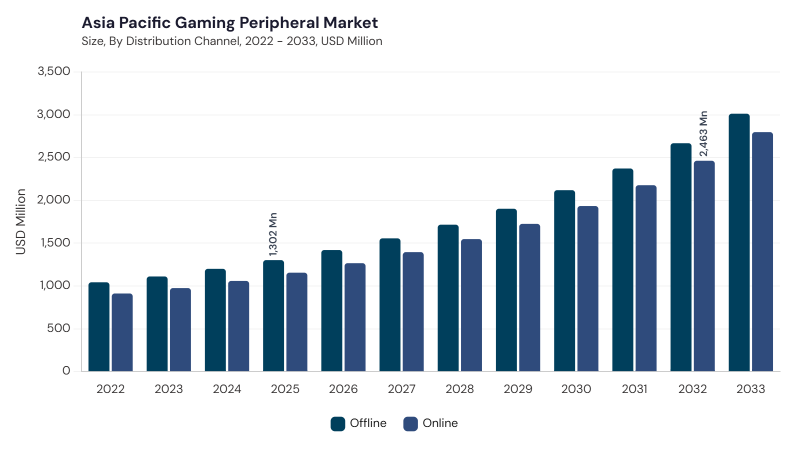
Based on Distribution Channel, the market is segmented into Offline and Online. Offline channels remain important for consumers who prefer hands-on assessment of peripheral ergonomics, responsiveness, switch feel, audio performance, and build quality before purchase. Gaming specialty stores, electronics retailers, and brand outlets also provide demonstrations, expert assistance, warranty support, and localized product availability.
Online distribution is expanding through e-commerce marketplaces, brand websites, live-commerce channels, and specialized gaming platforms offering broad product assortments, competitive pricing, exclusive launches, and promotional discounts. Mobile-first shopping habits, digital payment adoption, influencer marketing, customer reviews, and improved logistics are further strengthening online purchasing across the region.
Product Outlook
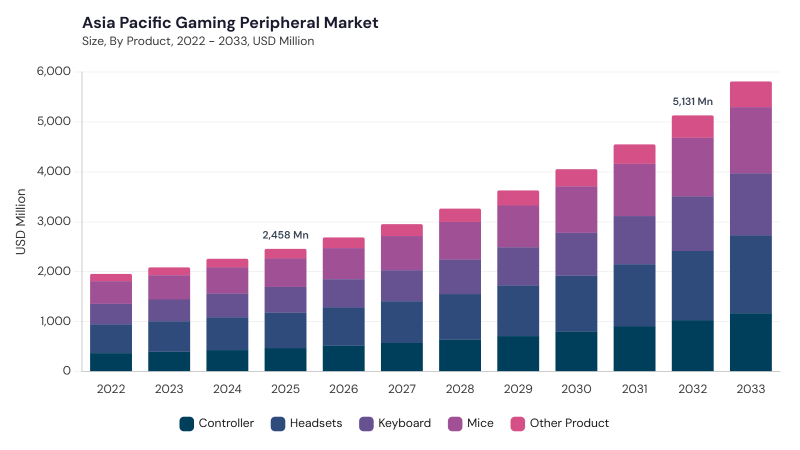
Based on Product, the market is segmented into Headsets, Mice, Keyboard, Controller, and Other Product. Headsets support spatial audio, multiplayer communication, noise management, and cross-device use through both wired and wireless formats, while Mice remain essential for gaming precision through high-DPI sensors, programmable controls, modular designs, and low-latency connectivity.
Keyboard demand is supported by mechanical switches, programmable macros, RGB lighting, durable construction, and increasingly customizable layouts, whereas Controller adoption benefits from console gaming, cloud gaming, mobile esports, haptic feedback, and cross-platform compatibility. Other Product includes gaming mousepads, webcams, racing wheels, flight sticks, capture devices, charging docks, VR accessories, and streaming equipment that improve performance, immersion, content creation, and overall gaming setup functionality.
Free Valuable Insights: Gaming Peripheral Market is Predicted to reach USD 14.7 Billion billion by 2033, at a CAGR of 11.2%
Country Outlook
Based on Country, the market is segmented into China, Japan, India, South Korea, Singapore, Malaysia, and Rest of Asia Pacific. The China market dominated the Asia Pacific Gaming Peripheral Market by Country in 2025, and would continue to be a dominant market till 2033; thereby, achieving a market value of USD 1.3 billion by 2030, growing at a CAGR of 10 % during the forecast period. The Japan market is expected to witness a CAGR of 10.8% during (2026 - 2033). Additionally, The India market is expected to witness a CAGR of 12.5% during (2026 - 2033).
Across Asia Pacific, gaming peripheral adoption is increasingly influenced by esports, mobile gaming, wireless technologies, customization, AI integration, and regional consumer preferences. China is advancing modular peripherals, AI-enabled features, localized hardware, and sustainable product design, while Japan is emphasizing AI-assisted controls, portable multi-platform accessories, premium craftsmanship, and eco-conscious manufacturing. India is expanding mobile-compatible peripherals, low-latency wireless products, localized pricing, and customizable gaming setups, whereas South Korea is strengthening ergonomic design, esports-focused hardware, smart software ecosystems, and sustainable materials. Singapore is progressing through AI-driven customization, cloud gaming compatibility, professional-grade esports products, and advanced haptic technologies, while Malaysia is expanding wireless peripherals, esports-oriented devices, AR/VR accessories, and localized distribution. Rest of Asia Pacific is also moving toward modular designs, low-latency wireless systems, sustainable materials, and AI-supported customization.
List of Key Companies Profiled
- Logitech International S.A.
- Razer Inc.
- Corsair Gaming, Inc.
- GN Store Nord A/S
- HP Inc.
- Turtle Beach Corporation
- ASUSTeK Computer Inc.
- Sony Group Corporation
- Microsoft Corporation
- Guillemot Corporation S.A.
Asia Pacific Gaming Peripheral Market Report Segmentation
By Device
- PC
- Gaming Consoles
By Type
- Wired
- Wireless
By Distribution Channel
- Offline
- Online
By Product
- Headsets
- Mice
- Keyboard
- Controller
- Other Product
By Country
- China
- Japan
- India
- South Korea
- Singapore
- Malaysia
- Rest of Asia Pacific
1.1 Market Overview
1.2 Key Factors Impacting Market
1.2.1 Market Drivers
1.2.2 Market Restraints
1.2.3 Market Opportunities
1.2.4 Market Challenges
1.2.5 Market Trends
1.2.6 State of Competition
1.2.7 Market Consolidation
1.2.8 Key Customer Criteria
1.3 Product Life Cycle
1.4 Segmentation By Application
1.4.1 Professional
1.4.2 Leisure
1.5 Segmentation By Product
1.5.1 -piece
1.5.2 -piece
1.5.3 -piece
1.6 Segmentation By Country
1.6.1 China
1.6.1.1 Segmentation By Application
1.6.1.1.1 Professional
1.6.1.1.2 Leisure
1.6.1.2 Segmentation By Product
1.6.1.2.1 -piece
1.6.1.2.2 -piece
1.6.1.2.3 -piece
1.6.2 Japan
1.6.2.1 Segmentation By Application
1.6.2.1.1 Professional
1.6.2.1.2 Leisure
1.6.2.2 Segmentation By Product
1.6.2.2.1 -piece
1.6.2.2.2 -piece
1.6.2.2.3 -piece
1.6.3 India
1.6.3.1 Segmentation By Application
1.6.3.1.1 Professional
1.6.3.1.2 Leisure
1.6.3.2 Segmentation By Product
1.6.3.2.1 -piece
1.6.3.2.2 -piece
1.6.3.2.3 -piece
1.6.4 South Korea
1.6.4.1 Segmentation By Application
1.6.4.1.1 Professional
1.6.4.1.2 Leisure
1.6.4.2 Segmentation By Product
1.6.4.2.1 -piece
1.6.4.2.2 -piece
1.6.4.2.3 -piece
1.6.5 Singapore
1.6.5.1 Segmentation By Application
1.6.5.1.1 Professional
1.6.5.1.2 Leisure
1.6.5.2 Segmentation By Product
1.6.5.2.1 -piece
1.6.5.2.2 -piece
1.6.5.2.3 -piece
1.6.6 Malaysia
1.6.6.1 Segmentation By Application
1.6.6.1.1 Professional
1.6.6.1.2 Leisure
1.6.6.2 Segmentation By Product
1.6.6.2.1 -piece
1.6.6.2.2 -piece
1.6.6.2.3 -piece
1.6.7 Rest of Asia Pacific
1.6.7.1 Segmentation By Application
1.6.7.1.1 Professional
1.6.7.1.2 Leisure
1.6.7.2 Segmentation By Product
1.6.7.2.1 -piece
1.6.7.2.2 -piece
1.6.7.2.3 -piece
Chapter 2. Company Snapshots
2.1 Acushnet Holdings Corp.
2.1.1 Business Overview
2.1.2 Key Information
2.1.3 Company Focus on Golf Ball Market
2.1.4 Strategic Insights
2.1.5 Strategy Deployed
2.1.6 Product & Service Portfolio
2.1.7 Capability Overview
2.1.8 Technology & Innovation Focus
2.1.9 SWOT Analysis
2.1.10 Customers / End Users
2.1.11 Competitive Positioning
2.1.12 Key Differentiators
2.1.13 Portfolio Matrix
2.1.14 Analyst View
2.1.15 Future Outlook
2.2 Callaway Golf Company
2.2.1 Business Overview
2.2.2 Key Information
2.2.3 Company Focus on Golf Ball Market
2.2.4 Strategic Insights
2.2.5 Strategy Deployed
2.2.6 Product & Service Portfolio
2.2.7 Representative Brands
2.2.8 Capability Overview
2.2.9 Technology & Innovation Focus
2.2.10 SWOT Analysis
2.2.11 Customers / End Users
2.2.12 Competitive Positioning
2.2.13 Key Differentiators
2.2.14 Portfolio Matrix
2.2.15 Analyst View
2.2.16 Future Outlook
2.3 Callaway Golf Company
2.3.1 Business Overview
2.3.2 Company Profile
2.3.3 Company Focus on Golf Ball Market
2.3.4 Strategic Insights
2.3.5 Strategy Deployed
2.3.6 Product & Service Portfolio
2.3.7 Representative Brands
2.3.8 Capability Overview
2.3.9 Technology & Innovation Focus
2.3.10 SWOT Analysis
2.3.11 Customers / End Users
2.3.12 Competitive Positioning
2.3.13 Key Differentiators
2.3.14 Portfolio Matrix
2.3.15 Analyst View
2.3.16 Future Outlook
2.4 TaylorMade Golf Company, Inc.
2.4.1 Business Overview
2.4.2 Key Information
2.4.3 Company Focus on Golf Ball Market
2.4.4 Strategic Insights
2.4.5 Strategy Deployed
2.4.6 Product & Service Portfolio
2.4.7 Representative Brands
2.4.8 Capability Overview
2.4.9 Technology & Innovation Focus
2.4.10 SWOT Analysis
2.4.11 Customers / End Users
2.4.12 Competitive Positioning
2.4.13 Key Differentiators
2.4.14 Portfolio Matrix
2.4.15 Analyst View
2.4.16 Future Outlook
2.5 Sumitomo Rubber Industries, Ltd.
2.5.1 Business Overview
2.5.2 Key Information
2.5.3 Company Focus on Golf Ball Market
2.5.4 Strategic Insights
2.5.5 Strategy Deployed
2.5.6 Product & Service Portfolio
2.5.7 Representative Brands
2.5.8 Capability Overview
2.5.9 Technology & Innovation Focus
2.5.10 SWOT Analysis
2.5.11 Customers / End Users
2.5.12 Competitive Positioning
2.5.13 Key Differentiators
2.5.14 Portfolio Matrix
2.5.15 Analyst View
2.5.16 Future Outlook
2.6 Bridgestone Corporation
2.6.1 Business Overview
2.6.2 Key Information
2.6.3 Company Focus on Golf Ball Market
2.6.4 Strategic Insights
2.6.5 Strategy Deployed for Golf Ball Market
2.6.6 Product & Service Portfolio
2.6.7 Representative Brands
2.6.8 Capability Overview
2.6.9 Technology & Innovation Focus
2.6.10 SWOT Analysis
2.6.11 Customers / End Users
2.6.12 Competitive Positioning
2.6.13 Key Differentiators
2.6.14 Portfolio Matrix
2.6.15 Analyst View
2.6.16 Future Outlook
2.7 Amer Sports, Inc.
2.7.1 Business Overview
2.7.2 Key Information
2.7.3 Company Focus on Golf Ball Market
2.7.4 Strategic Insights
2.7.5 Strategy Deployed
2.7.6 Product & Service Portfolio
2.7.7 Representative Brands
2.7.8 Capability Overview
2.7.9 Technology & Innovation Focus
2.7.10 SWOT Analysis
2.7.11 Customers / End Users
2.7.12 Competitive Positioning
2.7.13 Key Differentiators
2.7.14 Portfolio Matrix
2.7.15 Analyst View
2.7.16 Future Outlook
2.8 Vice Golf
2.8.1 Business Overview
2.8.2 Key Information
2.8.3 Company Focus on Golf Ball Market
2.8.4 Strategic Insights
2.8.5 Strategy Deployed
2.8.6 Product & Service Portfolio
2.8.7 Representative Brands
2.8.8 Capability Overview
2.8.9 Technology & Innovation Focus
2.8.10 SWOT Analysis
2.8.11 Customers / End Users
2.8.12 Competitive Positioning
2.8.13 Key Differentiators
2.8.14 Portfolio Matrix
2.8.15 Analyst View
2.8.16 Future Outlook
2.9 Volvik Inc.
2.9.1 Business Overview
2.9.2 Key Information
2.9.3 Company Focus on Golf Ball Market
2.9.4 Strategic Insights on Golf Ball Market
2.9.5 Strategy Deployed for Golf Ball Market
2.9.6 Product & Service Portfolio
2.9.7 Representative Brands
2.9.8 Capability Overview
2.9.9 Technology & Innovation Focus
2.9.10 SWOT Analysis
2.9.11 Customers / End Users
2.9.12 Competitive Positioning
2.9.13 Key Differentiators
2.9.14 Portfolio Matrix
2.9.15 Analyst View
2.9.16 Future Outlook
2.10 Mizuno Corporation
2.10.1 Business Overview
2.10.2 Key Information
2.10.3 Company Focus on Golf Ball Market
2.10.4 Strategic Insights
2.10.5 Strategy Deployed
2.10.6 Product & Service Portfolio
2.10.7 Representative Brands
2.10.8 Capability Overview
2.10.9 Technology & Innovation Focus
2.10.10 SWOT Analysis
2.10.11 Customers / End Users
2.10.12 Competitive Positioning
2.10.13 Key Differentiators
2.10.14 Portfolio Matrix 2.10.15 Analyst View
2.10.16 Future Outlook
2.11 DICK'S Sporting Goods, Inc.
2.11.1 Business Overview
2.11.2 Key Information
2.11.3 Company Focus on Golf Ball Market
2.11.4 Strategic Insights
2.11.5 Strategy Deployed
2.11.6 Product & Service Portfolio
2.11.7 Representative Golf Brands Carried
2.11.8 Capability Overview
2.11.9 Technology & Innovation Focus
2.11.10 SWOT Analysis
2.11.11 Customers / End Users
2.11.12 Competitive Positioning
2.11.13 Key Differentiators
2.11.14 Portfolio Matrix
2.11.15 Analyst View
2.11.16 Future Outlook
Table 1 Asia Pacific Golf Ball Market Market, 2022 - 2033, USD Million
Table 2 Asia Pacific Golf Ball Market Market by Application, 2022 - 2033, USD Million
Table 3 Asia Pacific Leisure Market, 2022 - 2033, USD Million
Table 4 Asia Pacific Professional Market, 2022 - 2033, USD Million
Table 5 Asia Pacific Golf Ball Market Market by Product, 2022 - 2033, USD Million
Table 6 Asia Pacific 2-piece Market, 2022 - 2033, USD Million
Table 7 Asia Pacific 3-piece Market, 2022 - 2033, USD Million
Table 8 Asia Pacific 4-piece Market, 2022 - 2033, USD Million
Table 9 China Golf Ball Market Market, 2022 - 2033, USD Million
Table 10 China Golf Ball Market Market by Application, 2022 - 2033, USD Million
Table 11 China Leisure Market, 2022 - 2033, USD Million
Table 12 China Professional Market, 2022 - 2033, USD Million
Table 13 China Golf Ball Market Market by Product, 2022 - 2033, USD Million
Table 14 China 2-piece Market, 2022 - 2033, USD Million
Table 15 China 3-piece Market, 2022 - 2033, USD Million
Table 16 China 4-piece Market, 2022 - 2033, USD Million
Table 17 Japan Golf Ball Market Market, 2022 - 2033, USD Million
Table 18 Japan Golf Ball Market Market by Application, 2022 - 2033, USD Million
Table 19 Japan Leisure Market, 2022 - 2033, USD Million
Table 20 Japan Professional Market, 2022 - 2033, USD Million
Table 21 Japan Golf Ball Market Market by Product, 2022 - 2033, USD Million
Table 22 Japan 2-piece Market, 2022 - 2033, USD Million
Table 23 Japan 3-piece Market, 2022 - 2033, USD Million
Table 24 Japan 4-piece Market, 2022 - 2033, USD Million
Table 25 India Golf Ball Market Market, 2022 - 2033, USD Million
Table 26 India Golf Ball Market Market by Application, 2022 - 2033, USD Million
Table 27 India Leisure Market, 2022 - 2033, USD Million
Table 28 India Professional Market, 2022 - 2033, USD Million
Table 29 India Golf Ball Market Market by Product, 2022 - 2033, USD Million
Table 30 India 2-piece Market, 2022 - 2033, USD Million
Table 31 India 3-piece Market, 2022 - 2033, USD Million
Table 32 India 4-piece Market, 2022 - 2033, USD Million
Table 33 South Korea Golf Ball Market Market, 2022 - 2033, USD Million
Table 34 South Korea Golf Ball Market Market by Application, 2022 - 2033, USD Million
Table 35 South Korea Leisure Market, 2022 - 2033, USD Million
Table 36 South Korea Professional Market, 2022 - 2033, USD Million
Table 37 South Korea Golf Ball Market Market by Product, 2022 - 2033, USD Million
Table 38 South Korea 2-piece Market, 2022 - 2033, USD Million
Table 39 South Korea 3-piece Market, 2022 - 2033, USD Million
Table 40 South Korea 4-piece Market, 2022 - 2033, USD Million
Table 41 Singapore Golf Ball Market Market, 2022 - 2033, USD Million
Table 42 Singapore Golf Ball Market Market by Application, 2022 - 2033, USD Million
Table 43 Singapore Leisure Market, 2022 - 2033, USD Million
Table 44 Singapore Professional Market, 2022 - 2033, USD Million
Table 45 Singapore Golf Ball Market Market by Product, 2022 - 2033, USD Million
Table 46 Singapore 2-piece Market, 2022 - 2033, USD Million
Table 47 Singapore 3-piece Market, 2022 - 2033, USD Million
Table 48 Singapore 4-piece Market, 2022 - 2033, USD Million
Table 49 Malaysia Golf Ball Market Market, 2022 - 2033, USD Million
Table 50 Malaysia Golf Ball Market Market by Application, 2022 - 2033, USD Million
Table 51 Malaysia Leisure Market, 2022 - 2033, USD Million
Table 52 Malaysia Professional Market, 2022 - 2033, USD Million
Table 53 Malaysia Golf Ball Market Market by Product, 2022 - 2033, USD Million
Table 54 Malaysia 2-piece Market, 2022 - 2033, USD Million
Table 55 Malaysia 3-piece Market, 2022 - 2033, USD Million
Table 56 Malaysia 4-piece Market, 2022 - 2033, USD Million
Table 57 Rest of Asia Pacific Golf Ball Market Market, 2022 - 2033, USD Million
Table 58 Rest of Asia Pacific Golf Ball Market Market by Application, 2022 - 2033, USD Million
Table 59 Rest of Asia Pacific Leisure Market, 2022 - 2033, USD Million
Table 60 Rest of Asia Pacific Professional Market, 2022 - 2033, USD Million
Table 61 Rest of Asia Pacific Golf Ball Market Market by Product, 2022 - 2033, USD Million
Table 62 Rest of Asia Pacific 2-piece Market, 2022 - 2033, USD Million
Table 63 Rest of Asia Pacific 3-piece Market, 2022 - 2033, USD Million
Table 64 Rest of Asia Pacific 4-piece Market, 2022 - 2033, USD Million
List of Figures
FIG 1 Key Factors Impacting Market
FIG 2 Market Consolidation
FIG 3 Key Customer Criteria
FIG 4 Product Life Cycle
FIG 5 Asia Pacific Golf Ball Market Market, 2022 - 2033, USD Million
FIG 6 Asia Pacific Golf Ball Market Market by Application, 2022 - 2033, USD Million
FIG 7 Asia Pacific Leisure Market, 2022 - 2033, USD Million
FIG 8 Asia Pacific Professional Market, 2022 - 2033, USD Million
FIG 9 Asia Pacific Golf Ball Market Market by Product, 2022 - 2033, USD Million
FIG 10 Asia Pacific 2-piece Market, 2022 - 2033, USD Million
FIG 11 Asia Pacific 3-piece Market, 2022 - 2033, USD Million
FIG 12 Asia Pacific 4-piece Market, 2022 - 2033, USD Million
FIG 13 China Golf Ball Market Market, 2022 - 2033, USD Million
FIG 14 China Golf Ball Market Market by Application, 2022 - 2033, USD Million
FIG 15 China Leisure Market, 2022 - 2033, USD Million
FIG 16 China Professional Market, 2022 - 2033, USD Million
FIG 17 China Golf Ball Market Market by Product, 2022 - 2033, USD Million
FIG 18 China 2-piece Market, 2022 - 2033, USD Million
FIG 19 China 3-piece Market, 2022 - 2033, USD Million
FIG 20 China 4-piece Market, 2022 - 2033, USD Million
FIG 21 Japan Golf Ball Market Market, 2022 - 2033, USD Million
FIG 22 Japan Golf Ball Market Market by Application, 2022 - 2033, USD Million
FIG 23 Japan Leisure Market, 2022 - 2033, USD Million
FIG 24 Japan Professional Market, 2022 - 2033, USD Million
FIG 25 Japan Golf Ball Market Market by Product, 2022 - 2033, USD Million
FIG 26 Japan 2-piece Market, 2022 - 2033, USD Million
FIG 27 Japan 3-piece Market, 2022 - 2033, USD Million
FIG 28 Japan 4-piece Market, 2022 - 2033, USD Million
FIG 29 India Golf Ball Market Market, 2022 - 2033, USD Million
FIG 30 India Golf Ball Market Market by Application, 2022 - 2033, USD Million
FIG 31 India Leisure Market, 2022 - 2033, USD Million
FIG 32 India Professional Market, 2022 - 2033, USD Million
FIG 33 India Golf Ball Market Market by Product, 2022 - 2033, USD Million
FIG 34 India 2-piece Market, 2022 - 2033, USD Million
FIG 35 India 3-piece Market, 2022 - 2033, USD Million
FIG 36 India 4-piece Market, 2022 - 2033, USD Million
FIG 37 South Korea Golf Ball Market Market, 2022 - 2033, USD Million
FIG 38 South Korea Golf Ball Market Market by Application, 2022 - 2033, USD Million
FIG 39 South Korea Leisure Market, 2022 - 2033, USD Million
FIG 40 South Korea Professional Market, 2022 - 2033, USD Million
FIG 41 South Korea Golf Ball Market Market by Product, 2022 - 2033, USD Million
FIG 42 South Korea 2-piece Market, 2022 - 2033, USD Million
FIG 43 South Korea 3-piece Market, 2022 - 2033, USD Million
FIG 44 South Korea 4-piece Market, 2022 - 2033, USD Million
FIG 45 Singapore Golf Ball Market Market, 2022 - 2033, USD Million
FIG 46 Singapore Golf Ball Market Market by Application, 2022 - 2033, USD Million
FIG 47 Singapore Leisure Market, 2022 - 2033, USD Million
FIG 48 Singapore Professional Market, 2022 - 2033, USD Million
FIG 49 Singapore Golf Ball Market Market by Product, 2022 - 2033, USD Million
FIG 50 Singapore 2-piece Market, 2022 - 2033, USD Million
FIG 51 Singapore 3-piece Market, 2022 - 2033, USD Million
FIG 52 Singapore 4-piece Market, 2022 - 2033, USD Million
FIG 53 Malaysia Golf Ball Market Market, 2022 - 2033, USD Million
FIG 54 Malaysia Golf Ball Market Market by Application, 2022 - 2033, USD Million
FIG 55 Malaysia Leisure Market, 2022 - 2033, USD Million
FIG 56 Malaysia Professional Market, 2022 - 2033, USD Million
FIG 57 Malaysia Golf Ball Market Market by Product, 2022 - 2033, USD Million
FIG 58 Malaysia 2-piece Market, 2022 - 2033, USD Million
FIG 59 Malaysia 3-piece Market, 2022 - 2033, USD Million
FIG 60 Malaysia 4-piece Market, 2022 - 2033, USD Million
FIG 61 Rest of Asia Pacific Golf Ball Market Market, 2022 - 2033, USD Million
FIG 62 Rest of Asia Pacific Golf Ball Market Market by Application, 2022 - 2033, USD Million
FIG 63 Rest of Asia Pacific Leisure Market, 2022 - 2033, USD Million
FIG 64 Rest of Asia Pacific Professional Market, 2022 - 2033, USD Million
FIG 65 Rest of Asia Pacific Golf Ball Market Market by Product, 2022 - 2033, USD Million
FIG 66 Rest of Asia Pacific 2-piece Market, 2022 - 2033, USD Million
FIG 67 Rest of Asia Pacific 3-piece Market, 2022 - 2033, USD Million
FIG 68 Rest of Asia Pacific 4-piece Market, 2022 - 2033, USD Million