Asia Pacific Fault-tolerant Servers Market Size, Share & Industry Analysis Report By Deployment (On-Premise, and Cloud-based), By Enterprise Size (Large Enterprises, and SMEs), By Component (Hardware, Services, and Software), By End Use (BFSI, Healthcare, Manufacturing, and IT & Telecom), By Country Outlook and Forecast, 2026 - 2033
Published Date : 02-Sep-2026 |
Pages: 330 |
Report Format: PDF + Excel |
COVID-19 Impact on the Asia Pacific Fault-tolerant Servers Market
The Asia Pacific Fault-tolerant Servers Market is expected to reach USD 3.2 billion by 2030, growing at a CAGR of 5.8% during (2026 – 2033).
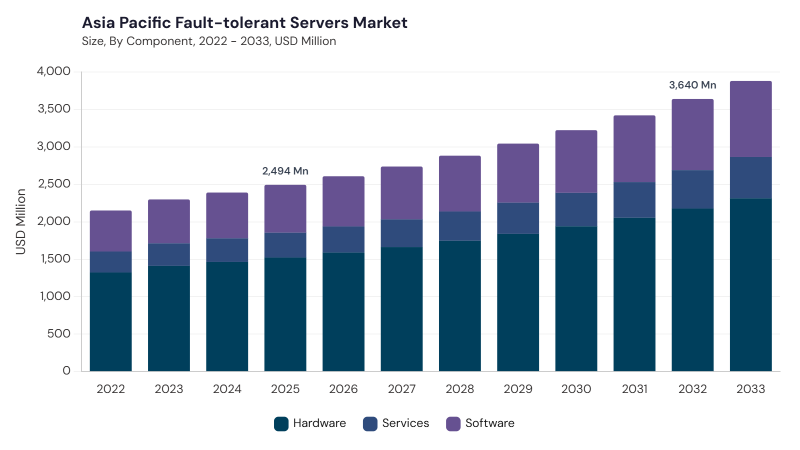
The Asia Pacific Fault-tolerant Servers Market developed from the region’s growing requirement for highly reliable computing systems across telecom, finance, healthcare, government, and cloud-based environments. Early server designs focused on redundant hardware, failover mechanisms, error detection, and backup components to prevent downtime and data loss. Over time, clustering technologies, virtualization, modular server designs, and intelligent monitoring systems expanded the use of fault-tolerant servers beyond limited mission-critical deployments. Rapid digital transformation, data center expansion, and enterprise reliance on uninterrupted computing further accelerated adoption across developed and emerging economies.
The Asia Pacific Fault-tolerant Servers Market is being shaped by expanding digital infrastructure, rising data center investments, cloud computing, big data analytics, AI adoption, and the need for continuous service availability. Organizations are using fault-tolerant servers to support financial transactions, telecom networks, clinical systems, government applications, e-commerce platforms, industrial automation, and mission-critical databases. Demand is supported by Industry 5.0 practices, IoT-based monitoring, machine learning, hybrid cloud strategies, high-performance computing, and regulatory focus on data security. Vendors are focusing on redundant server architectures, predictive fault management, scalable deployment models, energy-efficient components, and localized support.
Deployment Outlook
Based on Deployment, the market is segmented into On-Premise and Cloud-based. The On-Premise market dominated the Asia Pacific Fault-tolerant Servers Market by Deployment in 2025, and would continue to be a dominant market till 2033; thereby, achieving a market value of USD 2.0 billion by 2030, growing at a CAGR of 5.5 % during the forecast period. The Cloud-based market is expected to witness a CAGR of 6.4% during (2026 - 2033).
On-Premise leads due to strong demand from banking, government, telecom, healthcare, and manufacturing organizations that require direct infrastructure control, data protection, and low-latency access to critical workloads. It remains important where sensitive applications must remain within controlled enterprise or national environments. Cloud-based deployments remain significant as enterprises adopt hybrid cloud, disaster recovery, scalable failover, and cloud-native high-availability models. This segment benefits from container orchestration, distributed replication, automated recovery, regional cloud zones, AI-driven monitoring, and flexible infrastructure consumption models.
Enterprise Size Outlook
Based on Enterprise Size, the market is segmented into Large Enterprises and SMEs. The Large Enterprises market dominated the Asia Pacific Fault-tolerant Servers Market by Enterprise Size in 2025, and would continue to be a dominant market till 2033; thereby, achieving a market value of USD 2.3 billion by 2030, growing at a CAGR of 5.5 % during the forecast period. The SMEs market is expected to witness a CAGR of 6.7% during (2026 - 2033).
Large Enterprises lead due to extensive investments in resilient IT infrastructure, high-availability computing, business continuity planning, and large-scale data center operations. These organizations depend on fault-tolerant servers for core banking, telecom platforms, government systems, manufacturing control, healthcare databases, and high-volume digital applications. SMEs remain important as cost-efficient, modular, cloud-integrated, and managed fault-tolerant solutions become more accessible. This segment is supported by digitalization, remote work, e-commerce growth, hybrid infrastructure models, managed IT services, and rising awareness of downtime prevention.
Component Outlook
Based on Component, the market is segmented into Hardware, Software, and Services. The Hardware market dominated the Asia Pacific Fault-tolerant Servers Market by Component in 2025, and would continue to be a dominant market till 2033; thereby, achieving a market value of USD 1.9 billion by 2030, growing at a CAGR of 5.5 % during the forecast period. The Software market is expected to witness a CAGR of 6.1% during (2026 - 2033). The Services market is expected to witness a CAGR of 6.7% during (2026 - 2033).
Hardware leads due to strong demand for redundant CPUs, memory modules, power supplies, storage arrays, multi-path I/O, error-correcting memory, and high-performance server architectures. These components provide the physical foundation for failover, fault isolation, uninterrupted processing, and data integrity in mission-critical environments. Software remains significant through cluster management, replication tools, virtualization, fault monitoring, automated recovery, error-checking algorithms, and self-healing capabilities. Services support adoption through consulting, installation, integration, maintenance, remote monitoring, training, managed support, and lifecycle optimization across complex enterprise IT environments.
End Use Outlook
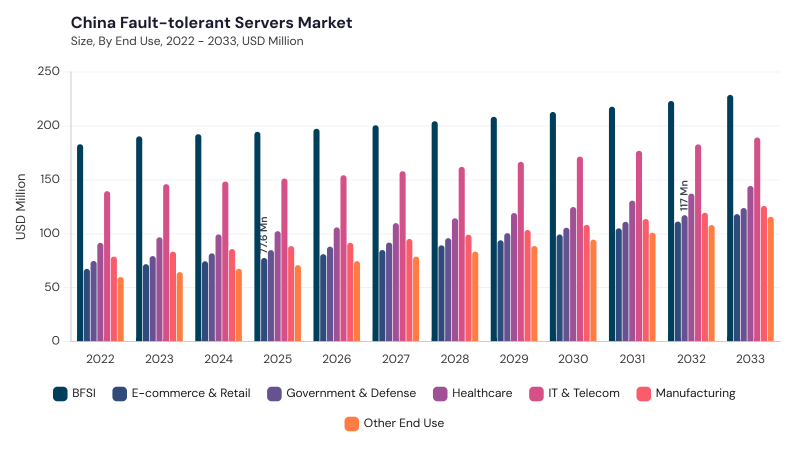
Based on End Use, the market is segmented into BFSI, IT & Telecom, Healthcare, Manufacturing, Government & Defense, E-commerce & Retail, and Other End Use. BFSI leads due to digital banking growth, uninterrupted transaction processing, fraud detection, compliance reporting, audit trails, and secure data management requirements. IT & Telecom uses fault-tolerant servers to support network uptime, cloud platforms, 5G services, data centers, edge computing, and real-time analytics.
Healthcare applies these systems for electronic health records, clinical systems, diagnostic applications, telemedicine, and patient data availability. Manufacturing, Government & Defense, E-commerce & Retail, and Other End Use areas add demand through smart factories, mission-critical public systems, online payments, logistics platforms, smart grids, education platforms, transportation control, and media delivery.
Free Valuable Insights: Fault-tolerant Servers Market is Predicted to reach USD 14.3 Billion billion by 2033, at a CAGR of 5.3%
Country Outlook
Based on Country, the market is segmented into China, Japan, India, South Korea, Singapore, Malaysia, and Rest of Asia Pacific. The China market dominated the Asia Pacific Fault-tolerant Servers Market by Country in 2025, and would continue to be a dominant market till 2033; thereby, achieving a market value of USD 916.9 million by 2030, growing at a CAGR of 4 % during the forecast period. The Japan market is expected to witness a CAGR of 5.1% during (2026 - 2033). Additionally, The India market is expected to witness a CAGR of 6.6% during (2026 - 2033).
China leads due to its large digital economy, AI infrastructure, cloud data centers, domestic server innovation, energy-efficient computing initiatives, and focus on resilient high-performance systems. Japan supports market growth through advanced data centers, AI workloads, quantum research, reliable enterprise infrastructure, and strong demand from finance, manufacturing, and telecom sectors. India is advancing through digital transformation, hybrid cloud adoption, financial technology expansion, government digitization, and AI-based predictive failure analysis. South Korea, Singapore, and Malaysia add momentum through cloud-native services, smart infrastructure, cybersecurity-focused fault tolerance, hybrid deployments, and energy-efficient server innovation, while Rest of Asia Pacific benefits from data center growth, managed services, and localized resilient infrastructure.
List of Key Companies Profiled
- Hewlett Packard Enterprise
- Penguin Solutions (Stratus)
- NEC Corporation
- IBM Corporation
- Fujitsu Limited
- Oracle Corporation
- Dell Technologies
- Lenovo Group
- Super Micro Computer, Inc.
- Cisco Systems, Inc.
Asia Pacific Fault-tolerant Servers Market Report Segmentation
By Deployment
- On-Premise
- Cloud-based
By Enterprise Size
- Large Enterprises
- SMEs
By Component
- Hardware
- Software
- Services
By End Use
- BFSI
- IT & Telecom
- Healthcare
- Manufacturing
- Government & Defense
- E-commerce & Retail
- Other End Use
By Country
- China
- Japan
- India
- South Korea
- Singapore
- Malaysia
- Rest of Asia Pacific
1.1 Market Overview
1.2 Key Factors Impacting Market
1.2.1 Market Drivers
1.2.2 Market Restraints
1.2.3 Market Opportunities
1.2.4 Market Challenges
1.2.5 Market Trends
1.2.6 State of Competition
1.2.7 Market Consolidation
1.2.8 Key Customer Criteria
1.3 Product Life Cycle
1.4 Segmentation By Device
1.4.1 PC
1.4.2 Gaming Console
1.5 Segmentation By Type
1.5.1 Wired
1.5.2 Wireless
1.6 Segmentation By Distribution Channel
1.6.1 Offline
1.6.2 Online
1.7 Segmentation By Product
1.7.1 Headsets
1.7.2 Mice
1.7.3 Keyboards
1.7.4 Controllers
1.7.5 Other Product
1.8 Segmentation By Country
1.8.1 China
1.8.1.1 Segmentation By Device
1.8.1.1.1 PC
1.8.1.1.2 Gaming Consoles
1.8.1.2 Segmentation By Type
1.8.1.2.1 Wired
1.8.1.2.2 Wireless
1.8.1.3 Segmentation By Distribution Channel
1.8.1.3.1 Offline
1.8.1.3.2 Online
1.8.1.4 Segmentation By Product
1.8.1.4.1 Headsets
1.8.1.4.2 Mice
1.8.1.4.3 Keyboard
1.8.1.4.4 Controller
1.8.1.4.5 Other Product
1.8.2 Japan
1.8.2.1 Segmentation By Device
1.8.2.1.1 PC
1.8.2.1.2 Gaming Consoles
1.8.2.2 Segmentation By Type
1.8.2.2.1 Wired
1.8.2.2.2 Wireless
1.8.2.3 Segmentation By Distribution Channel
1.8.2.3.1 Offline
1.8.2.3.2 Online
1.8.2.4 Segmentation By Product
1.8.2.4.1 Headsets
1.8.2.4.2 Mice
1.8.2.4.3 Keyboard
1.8.2.4.4 Controller
1.8.2.4.5 Other Product
1.8.3 India
1.8.3.1 Segmentation By Device
1.8.3.1.1 PC
1.8.3.1.2 Gaming Consoles
1.8.3.2 Segmentation By Type
1.8.3.2.1 Wired
1.8.3.2.2 Wireless
1.8.3.3 Segmentation By Distribution Channel
1.8.3.3.1 Offline
1.8.3.3.2 Online
1.8.3.4 Segmentation By Product
1.8.3.4.1 Headsets
1.8.3.4.2 Mice
1.8.3.4.3 Keyboard
1.8.3.4.4 Controller
1.8.3.4.5 Other Product
1.8.4 South Korea
1.8.4.1 Segmentation By Device
1.8.4.1.1 PC
1.8.4.1.2 Gaming Consoles
1.8.4.2 Segmentation By Type
1.8.4.2.1 Wired
1.8.4.2.2 Wireless
1.8.4.3 Segmentation By Distribution Channel
1.8.4.3.1 Offline
1.8.4.3.2 Online
1.8.4.4 Segmentation By Product
1.8.4.4.1 Headsets
1.8.4.4.2 Mice
1.8.4.4.3 Keyboard
1.8.4.4.4 Controller
1.8.4.4.5 Other Product
1.8.5 Singapore
1.8.5.1 Segmentation By Device
1.8.5.1.1 PC
1.8.5.1.2 Gaming Consoles
1.8.5.2 Segmentation By Type
1.8.5.2.1 Wired
1.8.5.2.2 Wireless
1.8.5.3 Segmentation By Distribution Channel
1.8.5.3.1 Offline
1.8.5.3.2 Online
1.8.5.4 Segmentation By Product
1.8.5.4.1 Headsets
1.8.5.4.2 Mice
1.8.5.4.3 Keyboard
1.8.5.4.4 Controller
1.8.5.4.5 Other Product
1.8.6 Malaysia
1.8.6.1 Segmentation By Device
1.8.6.1.1 PC
1.8.6.1.2 Gaming Consoles
1.8.6.2 Segmentation By Type
1.8.6.2.1 Wired
1.8.6.2.2 Wireless
1.8.6.3 Segmentation By Distribution Channel
1.8.6.3.1 Offline
1.8.6.3.2 Online
1.8.6.4 Segmentation By Product
1.8.6.4.1 Headsets
1.8.6.4.2 Mice
1.8.6.4.3 Keyboard
1.8.6.4.4 Controller
1.8.6.4.5 Other Product
1.8.7 Rest of Asia Pacific
1.8.7.1 Segmentation By Device
1.8.7.1.1 PC
1.8.7.1.2 Gaming Consoles
1.8.7.2 Segmentation By Type
1.8.7.2.1 Wired
1.8.7.2.2 Wireless
1.8.7.3 Segmentation By Distribution Channel
1.8.7.3.1 Offline
1.8.7.3.2 Online
1.8.7.4 Segmentation By Product
1.8.7.4.1 Headsets
1.8.7.4.2 Mice
1.8.7.4.3 Keyboard
1.8.7.4.4 Controller
1.8.7.4.5 Other Product
Chapter 2. Company Snapshots
2.1 Logitech International S.A.
2.1.1 Business Overview
2.1.2 Key Information
2.1.3 Company Focus on Gaming Peripheral Market
2.1.4 Strategic Insights
2.1.5 Strategy Deployed
2.1.6 Product & Service Portfolio
2.1.7 Capability Overview
2.1.8 Technology & Innovation Focus
2.1.9 SWOT Analysis
2.1.10 Customers / End Users
2.1.11 Competitive Positioning
2.1.12 Key Differentiators
2.1.13 Portfolio Matrix
2.1.14 Analyst View
2.1.15 Future Outlook
2.2 Razer Inc.
2.2.1 Business Overview
2.2.2 Key Information
2.2.3 Company Focus on Gaming Peripheral Market
2.2.4 Strategic Insights
2.2.5 Strategy Deployed
2.2.6 Product & Service Portfolio
2.2.7 Capability Overview
2.2.8 Technology & Innovation Focus
2.2.9 SWOT Analysis
2.2.10 Customers / End Users
2.2.11 Competitive Positioning
2.2.12 Key Differentiators
2.2.13 Portfolio Matrix
2.2.14 Analyst View
2.2.15 Future Outlook
2.3 Corsair Gaming, Inc.
2.3.1 Business Overview
2.3.2 Key Information
2.3.3 Company Focus on Gaming Peripheral Market
2.3.4 Strategic Insights
2.3.5 Strategy Deployed
2.3.6 Product & Service Portfolio
2.3.7 Capability Overview
2.3.8 Technology & Innovation Focus
2.3.9 SWOT Analysis
2.3.10 Customers / End Users
2.3.11 Competitive Positioning
2.3.12 Key Differentiators
2.3.13 Portfolio Matrix
2.3.14 Analyst View
2.3.15 Future Outlook
2.4 GN Store Nord A/S
2.4.1 Business Overview
2.4.2 Key Information
2.4.3 Company Focus on Gaming Peripheral Market
2.4.4 Strategic Insights
2.4.5 Strategy Deployed
2.4.6 Product & Service Portfolio
2.4.7 Capability Overview
2.4.8 Technology & Innovation Focus
2.4.9 SWOT Analysis
2.4.10 Customers / End Users
2.4.11 Competitive Positioning
2.4.12 Key Differentiators
2.4.13 Portfolio Matrix
2.4.14 Analyst View
2.4.15 Future Outlook
2.5 HP Inc.
2.5.1 Business Overview
2.5.2 Key Information
2.5.3 Company Focus on Gaming Peripheral Market
2.5.4 Strategic Insights
2.5.5 Strategy Deployed
2.5.6 Product & Service Portfolio
2.5.7 Capability Overview
2.5.8 Technology & Innovation Focus
2.5.9 SWOT Analysis
2.5.10 Customers / End Users
2.5.11 Competitive Positioning
2.5.12 Key Differentiators
2.5.13 Portfolio Matrix
2.5.14 Analyst View
2.5.15 Future Outlook
2.6 Turtle Beach Corporation
2.6.1 Business Overview
2.6.2 Key Information
2.6.3 Company Focus on Gaming Peripheral Market
2.6.4 Strategic Insights
2.6.5 Strategy Deployed
2.6.6 Product & Service Portfolio
2.6.7 Capability Overview
2.6.8 Technology & Innovation Focus
2.6.9 SWOT Analysis
2.6.10 Customers / End Users
2.6.11 Competitive Positioning
2.6.12 Key Differentiators
2.6.13 Portfolio Matrix
2.6.14 Analyst View
2.6.15 Future Outlook
2.7 ASUSTeK Computer Inc.
2.7.1 Business Overview
2.7.2 Key Information
2.7.3 Company Focus on Gaming Peripheral Market
2.7.4 Strategic Insights
2.7.5 Strategy Deployed
2.7.6 Product & Service Portfolio 2.7.7 Capability Overview
2.7.8 Technology & Innovation Focus
2.7.9 SWOT Analysis
2.7.10 Customers / End Users
2.7.11 Competitive Positioning
2.7.12 Key Differentiators
2.7.13 Portfolio Matrix
2.7.14 Analyst View
2.7.15 Future Outlook
2.8 Sony Group Corporation
2.8.1 Business Overview
2.8.2 Key Information
2.8.3 Company Focus on Gaming Peripheral Market
2.8.4 Strategic Insights
2.8.5 Strategy Deployed
2.8.6 Product & Service Portfolio
2.8.7 Capability Overview
2.8.8 Technology & Innovation Focus
2.8.9 SWOT Analysis
2.8.10 Customers / End Users
2.8.11 Competitive Positioning
2.8.12 Key Differentiators
2.8.13 Portfolio Matrix
2.8.14 Analyst View
2.8.15 Future Outlook
2.9 Microsoft Corporation
2.9.1 Business Overview
2.9.2 Key Information
2.9.3 Company Focus on Gaming Peripheral Market
2.9.4 Strategic Insights
2.10 Strategy Deployed
2.10.1 Product & Service Portfolio
2.10.2 Capability Overview
2.10.3 Technology & Innovation Focus
2.10.4 SWOT Analysis
2.10.5 Customers / End Users
2.10.6 Competitive Positioning
2.10.7 Key Differentiators
2.10.8 Portfolio Matrix
2.10.9 Analyst View
2.10.10 Future Outlook
2.11 Guillemot Corporation S.A.
2.11.1 Business Overview
2.11.2 Key Information
2.11.3 Company Focus on Gaming Peripheral Market
2.11.4 Strategic Insights
2.11.5 Strategy Deployed
2.11.6 Product & Service Portfolio
2.11.7 Capability Overview
2.11.8 Technology & Innovation Focus
2.11.9 SWOT Analysis
2.11.10 Customers / End Users
2.11.11 Competitive Positioning
2.11.12 Key Differentiators
2.11.13 Portfolio Matrix
2.11.14 Analyst View
2.11.15 Future Outlook
Table 1 Asia Pacific Gaming Peripheral Market Market, 2022 - 2033, USD Million
Table 2 Asia Pacific Gaming Peripheral Market Market by Device, 2022 - 2033, USD Million
Table 3 Asia Pacific Gaming Consoles Market, 2022 - 2033, USD Million
Table 4 Asia Pacific PC Market, 2022 - 2033, USD Million
Table 5 Asia Pacific Gaming Peripheral Market Market by Distribution Channel, 2022 - 2033, USD Million
Table 6 Asia Pacific Offline Market, 2022 - 2033, USD Million
Table 7 Asia Pacific Online Market, 2022 - 2033, USD Million
Table 8 Asia Pacific Gaming Peripheral Market Market by Product, 2022 - 2033, USD Million
Table 9 Asia Pacific Controller Market, 2022 - 2033, USD Million
Table 10 Asia Pacific Headsets Market, 2022 - 2033, USD Million
Table 11 Asia Pacific Keyboard Market, 2022 - 2033, USD Million
Table 12 Asia Pacific Mice Market, 2022 - 2033, USD Million
Table 13 Asia Pacific Other Product Market, 2022 - 2033, USD Million
Table 14 Asia Pacific Gaming Peripheral Market Market by Type, 2022 - 2033, USD Million
Table 15 Asia Pacific Wired Market, 2022 - 2033, USD Million
Table 16 Asia Pacific Wireless Market, 2022 - 2033, USD Million
Table 17 China Gaming Peripheral Market Market, 2022 - 2033, USD Million
Table 18 China Gaming Peripheral Market Market by Device, 2022 - 2033, USD Million
Table 19 China Gaming Consoles Market, 2022 - 2033, USD Million
Table 20 China PC Market, 2022 - 2033, USD Million
Table 21 China Gaming Peripheral Market Market by Distribution Channel, 2022 - 2033, USD Million
Table 22 China Offline Market, 2022 - 2033, USD Million
Table 23 China Online Market, 2022 - 2033, USD Million
Table 24 China Gaming Peripheral Market Market by Product, 2022 - 2033, USD Million
Table 25 China Controller Market, 2022 - 2033, USD Million
Table 26 China Headsets Market, 2022 - 2033, USD Million
Table 27 China Keyboard Market, 2022 - 2033, USD Million
Table 28 China Mice Market, 2022 - 2033, USD Million
Table 29 China Other Product Market, 2022 - 2033, USD Million
Table 30 China Gaming Peripheral Market Market by Type, 2022 - 2033, USD Million
Table 31 China Wired Market, 2022 - 2033, USD Million
Table 32 China Wireless Market, 2022 - 2033, USD Million
Table 33 Japan Gaming Peripheral Market Market, 2022 - 2033, USD Million
Table 34 Japan Gaming Peripheral Market Market by Device, 2022 - 2033, USD Million
Table 35 Japan Gaming Consoles Market, 2022 - 2033, USD Million
Table 36 Japan PC Market, 2022 - 2033, USD Million
Table 37 Japan Gaming Peripheral Market Market by Distribution Channel, 2022 - 2033, USD Million
Table 38 Japan Offline Market, 2022 - 2033, USD Million
Table 39 Japan Online Market, 2022 - 2033, USD Million
Table 40 Japan Gaming Peripheral Market Market by Product, 2022 - 2033, USD Million
Table 41 Japan Controller Market, 2022 - 2033, USD Million
Table 42 Japan Headsets Market, 2022 - 2033, USD Million
Table 43 Japan Keyboard Market, 2022 - 2033, USD Million
Table 44 Japan Mice Market, 2022 - 2033, USD Million
Table 45 Japan Other Product Market, 2022 - 2033, USD Million
Table 46 Japan Gaming Peripheral Market Market by Type, 2022 - 2033, USD Million
Table 47 Japan Wired Market, 2022 - 2033, USD Million
Table 48 Japan Wireless Market, 2022 - 2033, USD Million
Table 49 India Gaming Peripheral Market Market, 2022 - 2033, USD Million
Table 50 India Gaming Peripheral Market Market by Device, 2022 - 2033, USD Million
Table 51 India Gaming Consoles Market, 2022 - 2033, USD Million
Table 52 India PC Market, 2022 - 2033, USD Million
Table 53 India Gaming Peripheral Market Market by Distribution Channel, 2022 - 2033, USD Million
Table 54 India Offline Market, 2022 - 2033, USD Million
Table 55 India Online Market, 2022 - 2033, USD Million
Table 56 India Gaming Peripheral Market Market by Product, 2022 - 2033, USD Million
Table 57 India Controller Market, 2022 - 2033, USD Million
Table 58 India Headsets Market, 2022 - 2033, USD Million
Table 59 India Keyboard Market, 2022 - 2033, USD Million
Table 60 India Mice Market, 2022 - 2033, USD Million
Table 61 India Other Product Market, 2022 - 2033, USD Million
Table 62 India Gaming Peripheral Market Market by Type, 2022 - 2033, USD Million
Table 63 India Wired Market, 2022 - 2033, USD Million
Table 64 India Wireless Market, 2022 - 2033, USD Million
Table 65 South Korea Gaming Peripheral Market Market, 2022 - 2033, USD Million
Table 66 South Korea Gaming Peripheral Market Market by Device, 2022 - 2033, USD Million
Table 67 South Korea Gaming Consoles Market, 2022 - 2033, USD Million
Table 68 South Korea PC Market, 2022 - 2033, USD Million
Table 69 South Korea Gaming Peripheral Market Market by Distribution Channel, 2022 - 2033, USD Million
Table 70 South Korea Offline Market, 2022 - 2033, USD Million
Table 71 South Korea Online Market, 2022 - 2033, USD Million
Table 72 South Korea Gaming Peripheral Market Market by Product, 2022 - 2033, USD Million
Table 73 South Korea Controller Market, 2022 - 2033, USD Million
Table 74 South Korea Headsets Market, 2022 - 2033, USD Million
Table 75 South Korea Keyboard Market, 2022 - 2033, USD Million
Table 76 South Korea Mice Market, 2022 - 2033, USD Million
Table 77 South Korea Other Product Market, 2022 - 2033, USD Million
Table 78 South Korea Gaming Peripheral Market Market by Type, 2022 - 2033, USD Million
Table 79 South Korea Wired Market, 2022 - 2033, USD Million
Table 80 South Korea Wireless Market, 2022 - 2033, USD Million
Table 81 Singapore Gaming Peripheral Market Market, 2022 - 2033, USD Million
Table 82 Singapore Gaming Peripheral Market Market by Device, 2022 - 2033, USD Million
Table 83 Singapore Gaming Consoles Market, 2022 - 2033, USD Million
Table 84 Singapore PC Market, 2022 - 2033, USD Million
Table 85 Singapore Gaming Peripheral Market Market by Distribution Channel, 2022 - 2033, USD Million
Table 86 Singapore Offline Market, 2022 - 2033, USD Million
Table 87 Singapore Online Market, 2022 - 2033, USD Million
Table 88 Singapore Gaming Peripheral Market Market by Product, 2022 - 2033, USD Million
Table 89 Singapore Controller Market, 2022 - 2033, USD Million
Table 90 Singapore Headsets Market, 2022 - 2033, USD Million
Table 91 Singapore Keyboard Market, 2022 - 2033, USD Million
Table 92 Singapore Mice Market, 2022 - 2033, USD Million
Table 93 Singapore Other Product Market, 2022 - 2033, USD Million
Table 94 Singapore Gaming Peripheral Market Market by Type, 2022 - 2033, USD Million
Table 95 Singapore Wired Market, 2022 - 2033, USD Million
Table 96 Singapore Wireless Market, 2022 - 2033, USD Million
Table 97 Malaysia Gaming Peripheral Market Market, 2022 - 2033, USD Million
Table 98 Malaysia Gaming Peripheral Market Market by Device, 2022 - 2033, USD Million
Table 99 Malaysia Gaming Consoles Market, 2022 - 2033, USD Million
Table 100 Malaysia PC Market, 2022 - 2033, USD Million
Table 101 Malaysia Gaming Peripheral Market Market by Distribution Channel, 2022 - 2033, USD Million
Table 102 Malaysia Offline Market, 2022 - 2033, USD Million
Table 103 Malaysia Online Market, 2022 - 2033, USD Million
Table 104 Malaysia Gaming Peripheral Market Market by Product, 2022 - 2033, USD Million
Table 105 Malaysia Controller Market, 2022 - 2033, USD Million
Table 106 Malaysia Headsets Market, 2022 - 2033, USD Million
Table 107 Malaysia Keyboard Market, 2022 - 2033, USD Million
Table 108 Malaysia Mice Market, 2022 - 2033, USD Million
Table 109 Malaysia Other Product Market, 2022 - 2033, USD Million
Table 110 Malaysia Gaming Peripheral Market Market by Type, 2022 - 2033, USD Million
Table 111 Malaysia Wired Market, 2022 - 2033, USD Million
Table 112 Malaysia Wireless Market, 2022 - 2033, USD Million
Table 113 Rest of Asia Pacific Gaming Peripheral Market Market, 2022 - 2033, USD Million
Table 114 Rest of Asia Pacific Gaming Peripheral Market Market by Device, 2022 - 2033, USD Million
Table 115 Rest of Asia Pacific Gaming Consoles Market, 2022 - 2033, USD Million
Table 116 Rest of Asia Pacific PC Market, 2022 - 2033, USD Million
Table 117 Rest of Asia Pacific Gaming Peripheral Market Market by Distribution Channel, 2022 - 2033, USD Million
Table 118 Rest of Asia Pacific Offline Market, 2022 - 2033, USD Million
Table 119 Rest of Asia Pacific Online Market, 2022 - 2033, USD Million
Table 120 Rest of Asia Pacific Gaming Peripheral Market Market by Product, 2022 - 2033, USD Million
Table 121 Rest of Asia Pacific Controller Market, 2022 - 2033, USD Million
Table 122 Rest of Asia Pacific Headsets Market, 2022 - 2033, USD Million
Table 123 Rest of Asia Pacific Keyboard Market, 2022 - 2033, USD Million
Table 124 Rest of Asia Pacific Mice Market, 2022 - 2033, USD Million
Table 125 Rest of Asia Pacific Other Product Market, 2022 - 2033, USD Million
Table 126 Rest of Asia Pacific Gaming Peripheral Market Market by Type, 2022 - 2033, USD Million
Table 127 Rest of Asia Pacific Wired Market, 2022 - 2033, USD Million
Table 128 Rest of Asia Pacific Wireless Market, 2022 - 2033, USD Million
List of Figures
FIG 1 Key Factors Impacting Market
FIG 2 Market Consolidation
FIG 3 Key Customer Criteria
FIG 4 Product Life Cycle
FIG 5 Asia Pacific Gaming Peripheral Market Market, 2022 - 2033, USD Million
FIG 6 Asia Pacific Gaming Peripheral Market Market by Device, 2022 - 2033, USD Million
FIG 7 Asia Pacific Gaming Consoles Market, 2022 - 2033, USD Million
FIG 8 Asia Pacific PC Market, 2022 - 2033, USD Million
FIG 9 Asia Pacific Gaming Peripheral Market Market by Distribution Channel, 2022 - 2033, USD Million
FIG 10 Asia Pacific Offline Market, 2022 - 2033, USD Million
FIG 11 Asia Pacific Online Market, 2022 - 2033, USD Million
FIG 12 Asia Pacific Gaming Peripheral Market Market by Product, 2022 - 2033, USD Million
FIG 13 Asia Pacific Controller Market, 2022 - 2033, USD Million
FIG 14 Asia Pacific Headsets Market, 2022 - 2033, USD Million
FIG 15 Asia Pacific Keyboard Market, 2022 - 2033, USD Million
FIG 16 Asia Pacific Mice Market, 2022 - 2033, USD Million
FIG 17 Asia Pacific Other Product Market, 2022 - 2033, USD Million
FIG 18 Asia Pacific Gaming Peripheral Market Market by Type, 2022 - 2033, USD Million
FIG 19 Asia Pacific Wired Market, 2022 - 2033, USD Million
FIG 20 Asia Pacific Wireless Market, 2022 - 2033, USD Million
FIG 21 China Gaming Peripheral Market Market, 2022 - 2033, USD Million
FIG 22 China Gaming Peripheral Market Market by Device, 2022 - 2033, USD Million
FIG 23 China Gaming Consoles Market, 2022 - 2033, USD Million
FIG 24 China PC Market, 2022 - 2033, USD Million
FIG 25 China Gaming Peripheral Market Market by Distribution Channel, 2022 - 2033, USD Million
FIG 26 China Offline Market, 2022 - 2033, USD Million
FIG 27 China Online Market, 2022 - 2033, USD Million
FIG 28 China Gaming Peripheral Market Market by Product, 2022 - 2033, USD Million
FIG 29 China Controller Market, 2022 - 2033, USD Million
FIG 30 China Headsets Market, 2022 - 2033, USD Million
FIG 31 China Keyboard Market, 2022 - 2033, USD Million
FIG 32 China Mice Market, 2022 - 2033, USD Million
FIG 33 China Other Product Market, 2022 - 2033, USD Million
FIG 34 China Gaming Peripheral Market Market by Type, 2022 - 2033, USD Million
FIG 35 China Wired Market, 2022 - 2033, USD Million
FIG 36 China Wireless Market, 2022 - 2033, USD Million
FIG 37 Japan Gaming Peripheral Market Market, 2022 - 2033, USD Million
FIG 38 Japan Gaming Peripheral Market Market by Device, 2022 - 2033, USD Million
FIG 39 Japan Gaming Consoles Market, 2022 - 2033, USD Million
FIG 40 Japan PC Market, 2022 - 2033, USD Million
FIG 41 Japan Gaming Peripheral Market Market by Distribution Channel, 2022 - 2033, USD Million
FIG 42 Japan Offline Market, 2022 - 2033, USD Million
FIG 43 Japan Online Market, 2022 - 2033, USD Million
FIG 44 Japan Gaming Peripheral Market Market by Product, 2022 - 2033, USD Million
FIG 45 Japan Controller Market, 2022 - 2033, USD Million
FIG 46 Japan Headsets Market, 2022 - 2033, USD Million
FIG 47 Japan Keyboard Market, 2022 - 2033, USD Million
FIG 48 Japan Mice Market, 2022 - 2033, USD Million
FIG 49 Japan Other Product Market, 2022 - 2033, USD Million
FIG 50 Japan Gaming Peripheral Market Market by Type, 2022 - 2033, USD Million
FIG 51 Japan Wired Market, 2022 - 2033, USD Million
FIG 52 Japan Wireless Market, 2022 - 2033, USD Million
FIG 53 India Gaming Peripheral Market Market, 2022 - 2033, USD Million
FIG 54 India Gaming Peripheral Market Market by Device, 2022 - 2033, USD Million
FIG 55 India Gaming Consoles Market, 2022 - 2033, USD Million
FIG 56 India PC Market, 2022 - 2033, USD Million
FIG 57 India Gaming Peripheral Market Market by Distribution Channel, 2022 - 2033, USD Million
FIG 58 India Offline Market, 2022 - 2033, USD Million
FIG 59 India Online Market, 2022 - 2033, USD Million
FIG 60 India Gaming Peripheral Market Market by Product, 2022 - 2033, USD Million
FIG 61 India Controller Market, 2022 - 2033, USD Million
FIG 62 India Headsets Market, 2022 - 2033, USD Million
FIG 63 India Keyboard Market, 2022 - 2033, USD Million
FIG 64 India Mice Market, 2022 - 2033, USD Million
FIG 65 India Other Product Market, 2022 - 2033, USD Million
FIG 66 India Gaming Peripheral Market Market by Type, 2022 - 2033, USD Million
FIG 67 India Wired Market, 2022 - 2033, USD Million
FIG 68 India Wireless Market, 2022 - 2033, USD Million
FIG 69 South Korea Gaming Peripheral Market Market, 2022 - 2033, USD Million
FIG 70 South Korea Gaming Peripheral Market Market by Device, 2022 - 2033, USD Million
FIG 71 South Korea Gaming Consoles Market, 2022 - 2033, USD Million
FIG 72 South Korea PC Market, 2022 - 2033, USD Million
FIG 73 South Korea Gaming Peripheral Market Market by Distribution Channel, 2022 - 2033, USD Million
FIG 74 South Korea Offline Market, 2022 - 2033, USD Million
FIG 75 South Korea Online Market, 2022 - 2033, USD Million
FIG 76 South Korea Gaming Peripheral Market Market by Product, 2022 - 2033, USD Million
FIG 77 South Korea Controller Market, 2022 - 2033, USD Million
FIG 78 South Korea Headsets Market, 2022 - 2033, USD Million
FIG 79 South Korea Keyboard Market, 2022 - 2033, USD Million
FIG 80 South Korea Mice Market, 2022 - 2033, USD Million
FIG 81 South Korea Other Product Market, 2022 - 2033, USD Million
FIG 82 South Korea Gaming Peripheral Market Market by Type, 2022 - 2033, USD Million
FIG 83 South Korea Wired Market, 2022 - 2033, USD Million
FIG 84 South Korea Wireless Market, 2022 - 2033, USD Million
FIG 85 Singapore Gaming Peripheral Market Market, 2022 - 2033, USD Million
FIG 86 Singapore Gaming Peripheral Market Market by Device, 2022 - 2033, USD Million
FIG 87 Singapore Gaming Consoles Market, 2022 - 2033, USD Million
FIG 88 Singapore PC Market, 2022 - 2033, USD Million
FIG 89 Singapore Gaming Peripheral Market Market by Distribution Channel, 2022 - 2033, USD Million
FIG 90 Singapore Offline Market, 2022 - 2033, USD Million
FIG 91 Singapore Online Market, 2022 - 2033, USD Million
FIG 92 Singapore Gaming Peripheral Market Market by Product, 2022 - 2033, USD Million
FIG 93 Singapore Controller Market, 2022 - 2033, USD Million
FIG 94 Singapore Headsets Market, 2022 - 2033, USD Million
FIG 95 Singapore Keyboard Market, 2022 - 2033, USD Million
FIG 96 Singapore Mice Market, 2022 - 2033, USD Million
FIG 97 Singapore Other Product Market, 2022 - 2033, USD Million
FIG 98 Singapore Gaming Peripheral Market Market by Type, 2022 - 2033, USD Million
FIG 99 Singapore Wired Market, 2022 - 2033, USD Million
FIG 100 Singapore Wireless Market, 2022 - 2033, USD Million
FIG 101 Malaysia Gaming Peripheral Market Market, 2022 - 2033, USD Million
FIG 102 Malaysia Gaming Peripheral Market Market by Device, 2022 - 2033, USD Million
FIG 103 Malaysia Gaming Consoles Market, 2022 - 2033, USD Million
FIG 104 Malaysia PC Market, 2022 - 2033, USD Million
FIG 105 Malaysia Gaming Peripheral Market Market by Distribution Channel, 2022 - 2033, USD Million
FIG 106 Malaysia Offline Market, 2022 - 2033, USD Million
FIG 107 Malaysia Online Market, 2022 - 2033, USD Million
FIG 108 Malaysia Gaming Peripheral Market Market by Product, 2022 - 2033, USD Million
FIG 109 Malaysia Controller Market, 2022 - 2033, USD Million
FIG 110 Malaysia Headsets Market, 2022 - 2033, USD Million
FIG 111 Malaysia Keyboard Market, 2022 - 2033, USD Million
FIG 112 Malaysia Mice Market, 2022 - 2033, USD Million
FIG 113 Malaysia Other Product Market, 2022 - 2033, USD Million
FIG 114 Malaysia Gaming Peripheral Market Market by Type, 2022 - 2033, USD Million FIG 115 Malaysia Wired Market, 2022 - 2033, USD Million
FIG 116 Malaysia Wireless Market, 2022 - 2033, USD Million
FIG 117 Rest of Asia Pacific Gaming Peripheral Market Market, 2022 - 2033, USD Million
FIG 118 Rest of Asia Pacific Gaming Peripheral Market Market by Device, 2022 - 2033, USD Million
FIG 119 Rest of Asia Pacific Gaming Consoles Market, 2022 - 2033, USD Million
FIG 120 Rest of Asia Pacific PC Market, 2022 - 2033, USD Million
FIG 121 Rest of Asia Pacific Gaming Peripheral Market Market by Distribution Channel, 2022 - 2033, USD Million
FIG 122 Rest of Asia Pacific Offline Market, 2022 - 2033, USD Million
FIG 123 Rest of Asia Pacific Online Market, 2022 - 2033, USD Million
FIG 124 Rest of Asia Pacific Gaming Peripheral Market Market by Product, 2022 - 2033, USD Million
FIG 125 Rest of Asia Pacific Controller Market, 2022 - 2033, USD Million
FIG 126 Rest of Asia Pacific Headsets Market, 2022 - 2033, USD Million
FIG 127 Rest of Asia Pacific Keyboard Market, 2022 - 2033, USD Million
FIG 128 Rest of Asia Pacific Mice Market, 2022 - 2033, USD Million
FIG 129 Rest of Asia Pacific Other Product Market, 2022 - 2033, USD Million
FIG 130 Rest of Asia Pacific Gaming Peripheral Market Market by Type, 2022 - 2033, USD Million
FIG 131 Rest of Asia Pacific Wired Market, 2022 - 2033, USD Million
FIG 132 Rest of Asia Pacific Wireless Market, 2022 - 2033, USD Million