Global AI In Chemicals Market Size, Share & Industry Analysis Report By Type (Software, and Services), By End-use (Base Chemicals & Petrochemicals, and Specialty Chemicals), By Application (Production Optimization, and New Material Innovation), By Regional Outlook and Forecast, 2026 - 2033
Published Date : 25-Oct-2026 |
Pages: 575 |
Report Format: PDF + Excel |
COVID-19 Impact on the AI In Chemicals Market
The Global AI In Chemicals Market is expected to reach USD 10.5 billion by 2033, growing at a CAGR of 27.2% during (2026 - 2033).
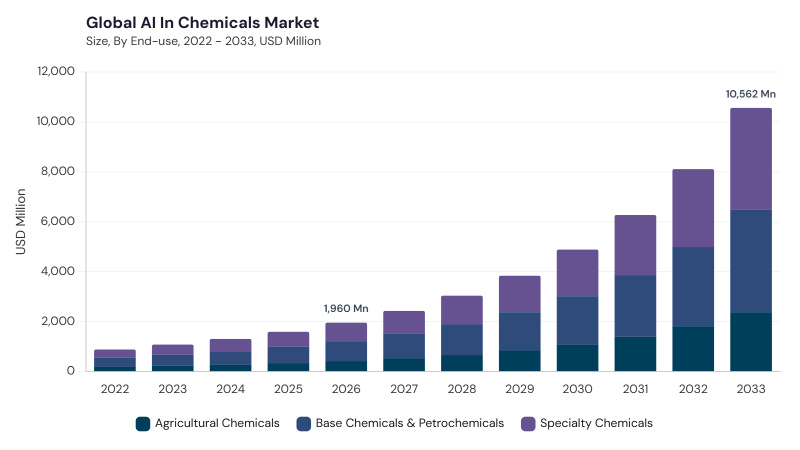
AI is becoming a strategic technology in the chemicals industry as manufacturers seek better process control, faster material innovation, predictive maintenance, and data-led operational decisions. Chemical producers are using AI to improve production efficiency, lower energy use, enhance product consistency, strengthen safety, and shorten R&D timelines across specialty chemicals, petrochemicals, polymers, advanced materials, and broader manufacturing operations. Adoption is expanding through digital twins, machine learning, advanced analytics, automation, and connected plant systems applied to formulation development, process optimization, quality inspection, demand forecasting, and supply chain planning.
Key Market Trends & Insights
- By type, Software dominated with a revenue share of 50.17% in 2025 and is projected to reach USD 5.0 billion by 2033, growing at a CAGR of 26.6% during (2026 - 2033).
- Hardware is projected to register the highest type CAGR of 28.1% during (2026 - 2033), reaching USD 1.9 billion by 2033, while Services are projected to reach USD 3.4 billion.
- By end-use, Base Chemicals & Petrochemicals led with a revenue share of 40.87% in 2025 and are projected to reach USD 4.1 billion by 2033, growing at a CAGR of 26.4% during (2026 - 2033).
- Agricultural Chemicals are projected to register the highest end-use CAGR of 27.9% during (2026 - 2033), reaching USD 2.3 billion by 2033, while Specialty Chemicals are projected to reach USD 4.0 billion.
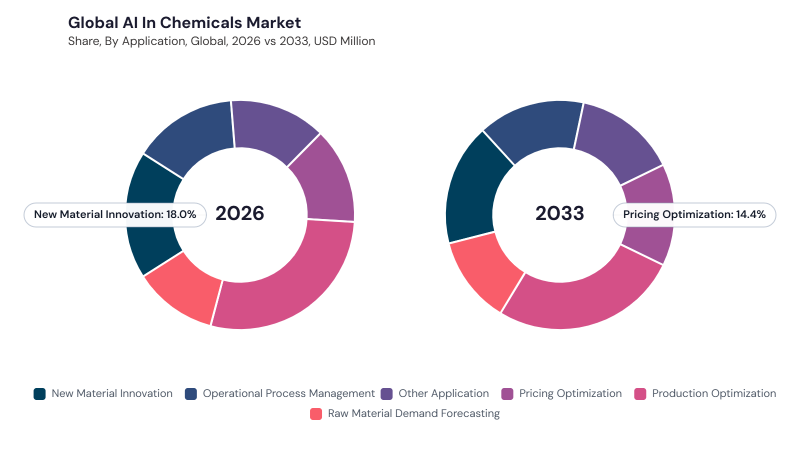
- By application, Production Optimization dominated with a revenue share of 28.42% in 2025 and is projected to reach USD 2.7 billion by 2033, growing at a CAGR of 26.1% during (2026 - 2033).
- New Material Innovation accounted for 18.11% of revenue in 2025 and is projected to reach USD 1.8 billion by 2033, growing at a CAGR of 26.4% during (2026 - 2033).
- Pricing Optimization and Other Application are projected to register the highest application CAGR of 28.3% during (2026 - 2033), reaching USD 1.5 billion and USD 1.5 billion by 2033, respectively.
- Regionally, North America dominated in 2025 and is projected to reach USD 4.0 billion by 2033, growing at a CAGR of 26.4% during (2026 - 2033).
- LAMEA is projected to register the fastest regional CAGR of 29.1% during (2026 - 2033), while Asia Pacific is projected to grow at a CAGR of 28.3%, supported by rapid chemical manufacturing digitalization and AI adoption.
Rising pressure to improve production efficiency, reduce waste, optimize energy consumption, and accelerate innovation is driving AI adoption across chemical operations. Chemical manufacturers are using AI to evaluate complex process data, predict equipment failures, improve reaction outcomes, reduce downtime, and support safer plant operations. In R&D, AI-assisted molecular design, generative modeling, and computational chemistry are shortening experimentation cycles and improving material discovery. Supply-chain volatility and raw-material price movement are also encouraging AI-enabled forecasting, procurement planning, and pricing analytics.
Competition in the AI In Chemicals Market is shaped by the convergence of enterprise AI, hyperscale cloud platforms, industrial automation, process optimization software, digital twins, and consulting services. Large technology providers compete through cloud infrastructure, generative AI, data analytics, and enterprise integration, while industrial specialists differentiate through process engineering, plant automation, asset performance, and manufacturing intelligence. Chemical-industry customers prioritize domain-specific accuracy, integration with legacy systems, data security, regulatory compliance, and measurable operational value. Partnerships between cloud providers, chemical companies, automation vendors, and research organizations are accelerating AI deployment across R&D, production, product stewardship, and sustainability workflows.
Market Share Analysis
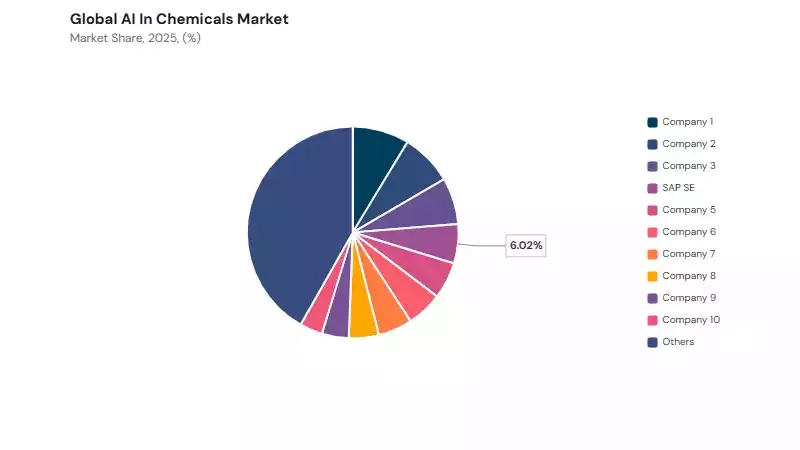
The AI In Chemicals Market is moderately fragmented, with enterprise AI providers, cloud companies, industrial automation specialists, process optimization software vendors, and consulting firms competing across the value chain. IBM Corporation, Microsoft Corporation, Google, SAP SE, Amazon Web Services, AspenTech, Siemens AG, Honeywell, AVEVA, and Accenture represent the key company snapshot group. Competition is increasingly shaped by the ability to integrate AI securely with chemical manufacturing systems, laboratory workflows, enterprise data, and industrial automation platforms. Vendors with strong domain expertise, scalable cloud infrastructure, digital twin capabilities, process optimization tools, and implementation services are better positioned to support chemical companies moving from pilot projects toward enterprise-wide AI deployment.
Type Outlook
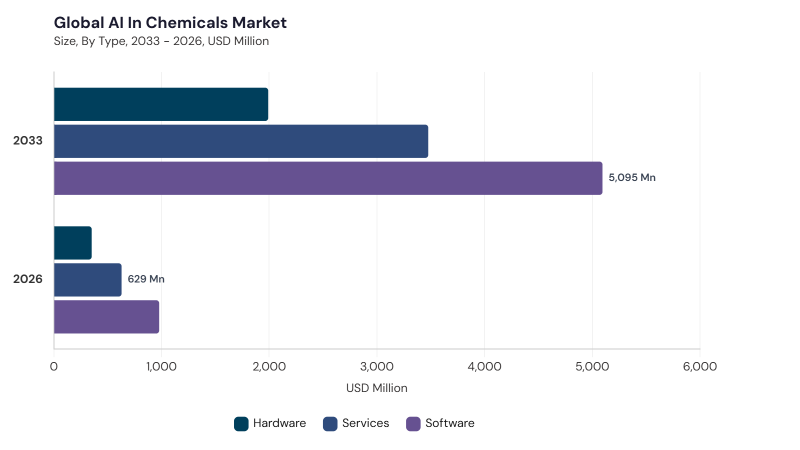
Based on type, the market is segmented into Software, Services, and Hardware. The Software market dominated the Global AI In Chemicals Market by Type in 2025, and would continue to be a dominant market till 2033; thereby, achieving a market value of USD 5.0 billion by 2033, growing at a CAGR of 26.6 % during the forecast period. The Services market is expected to witness a CAGR of 27.7% during (2026 - 2033). Additionally, The Hardware market is expected to witness highest CAGR of 28.1% during (2026 - 2033).
Software forms the core of AI deployment in chemicals as companies use analytics platforms, digital twins, process modeling tools, predictive maintenance systems, generative AI models, and decision-support applications across R&D, production, and supply-chain functions. Services support adoption by helping chemical companies define use cases, prepare data, integrate AI with legacy systems, deploy models, strengthen cybersecurity, and train internal teams. Hardware remains important because AI-enabled chemical operations require sensors, edge devices, industrial computing systems, specialized processors, and high-performance infrastructure to capture, process, and act on plant-level and laboratory data. Together, these type segments support the transition from isolated AI pilots toward scalable, integrated, and production-ready chemical intelligence systems.
End-use Outlook
Based on end-use, the market is segmented into Base Chemicals & Petrochemicals, Specialty Chemicals, and Agricultural Chemicals. The Base Chemicals & Petrochemicals market dominated the Global AI In Chemicals Market by End-use in 2025, and would continue to be a dominant market till 2033; thereby, achieving a market value of USD 4.1 billion by 2033, growing at a CAGR of 26.4 % during the forecast period. The Specialty Chemicals market is expected to witness a CAGR of 27.6% during (2026 - 2033). Additionally, The Agricultural Chemicals market is expected to witness highest CAGR of 27.9% during (2026 - 2033).
Base Chemicals & Petrochemicals use AI to improve high-volume production, continuous process control, predictive maintenance, energy efficiency, feedstock planning, and operational reliability across capital-intensive facilities. Specialty Chemicals rely on AI for formulation development, product customization, quality control, molecular modeling, automated experimentation, and faster innovation cycles for high-value products. Agricultural Chemicals apply AI in formulation research, crop-protection product development, production planning, seasonal demand forecasting, inventory management, and sustainability-focused product optimization. Each end-use area reflects a different AI adoption pattern, with large-scale operators emphasizing process efficiency and specialty producers focusing more strongly on innovation, customization, and regulatory responsiveness.
Application Outlook
Based on application, the market is segmented into Production Optimization, New Material Innovation, Operational Process Management, Pricing Optimization, Raw Material Demand Forecasting, and Other Application. The Production Optimization market dominated the Global AI In Chemicals Market by Application in 2025, and would continue to be a dominant market till 2033; thereby, achieving a market value of USD 2.7 billion by 2033, growing at a CAGR of 26.1 % during the forecast period. The New Material Innovation market is expected to witness a CAGR of 26.4% during (2026 - 2033). Additionally, The Operational Process Management market is expected to witness highest CAGR of 27.7% during (2026 - 2033).
Production Optimization covers AI-enabled yield improvement, energy reduction, process stability, predictive maintenance, and real-time operating-parameter adjustment in chemical plants. New Material Innovation uses machine learning, generative AI, simulation, and high-throughput screening to accelerate molecular discovery, formulation design, and development of advanced materials. Operational Process Management includes intelligent scheduling, workflow automation, asset monitoring, quality management, safety oversight, and coordination between plant systems and enterprise platforms. Pricing Optimization and Raw Material Demand Forecasting help chemical companies manage input-cost volatility, customer demand, procurement planning, inventory exposure, and margin decisions. Other Application includes safety monitoring, emissions management, supply-chain analytics, customer intelligence, compliance documentation, and broader decision-support functions.
Free Valuable Insights: AI In Chemicals Market Size to reach $10.5 Billion by 2033
Regional Outlook
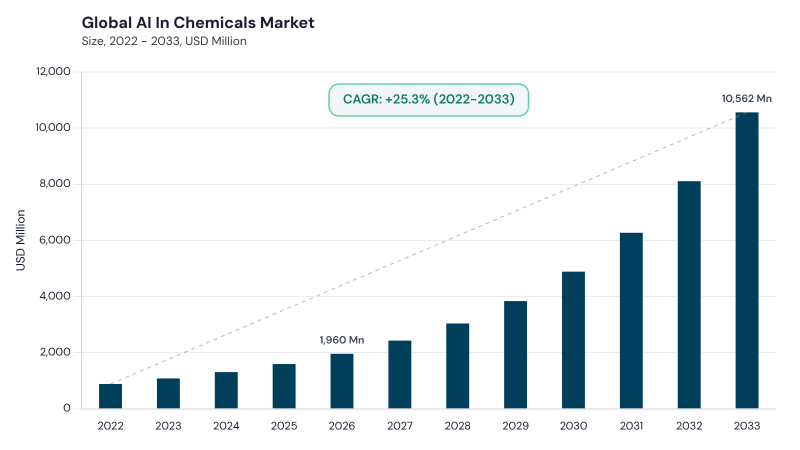
Region-wise, the AI In Chemicals Market is analyzed across North America, Europe, Asia Pacific, and LAMEA. The North America market dominated the Global AI In Chemicals Market by Region in 2025, and would continue to be a dominant market till 2033; thereby, achieving a market value of USD 4.0 billion by 2033, growing at a CAGR of 26.4 % during the forecast period. The Europe market is expected to witness a CAGR of 26.7% during (2026 - 2033). Additionally, The Asia Pacific market is expected to witness a CAGR of 28.3% during (2026 - 2033).
North America reflects mature AI adoption across research, process optimization, quality control, predictive maintenance, and supply-chain management, supported by strong technology infrastructure and chemical-industry modernization. Europe is shaped by regulatory compliance, sustainability goals, digital lab adoption, AI governance, and process optimization aligned with environmental and traceability requirements. Asia Pacific benefits from expanding chemical manufacturing clusters, smart factory development, digital infrastructure growth, and rising use of AI in petrochemicals, specialty chemicals, agricultural chemicals, and materials innovation. LAMEA adoption is supported by petrochemical activity, cloud infrastructure expansion, process-efficiency needs, sustainability initiatives, and localized AI partnerships addressing regional production and regulatory requirements.
| Report Attribute | Details |
|---|---|
| Market size value in 2026 | USD 1.9 billion |
| Market size forecast in 2033 | USD 10.5 billion |
| Base Year | 2025 |
| Historical Period | 2022 to 2024 |
| Forecast Period | 2026 to 2033 |
| Revenue Growth Rate | CAGR of 27.2% from 2026 to 2033 |
| Number of Pages | 575 |
| Tables | 480 |
| Report Coverage | Market Trends, Revenue Estimation and Forecast, Segmentation Analysis, Regional and Country Breakdown, Competitive Landscape, Market Share Analysis, Company Profiling, Companies Strategic Developments, SWOT Analysis, Product Life Cycle Analysis, Value Chain Analysis, Market Consolidation Analysis, Key Customer Criteria, Pandemic Impact Analysis, and Winning Imperatives |
| Segments Covered | Type, End-use, Application, and Geography |
| Country Scope |
|
| Companies Included | IBM Corporation; Microsoft Corporation; Google; SAP SE; Amazon Web Services; AspenTech; Siemens AG; Honeywell; AVEVA; Accenture |
Recent Strategies Deployed in the Market
- 2025-July: AVEVA expanded industrial AI applications for chemical process optimization, highlighting AI use in predictive maintenance, energy management, quality improvement, production efficiency, and chemical manufacturing throughput.
- 2025-May: AspenTech introduced AspenTech V15 with expanded Industrial AI functionality, generative AI capabilities, enhanced visualization, simplified workflows, and sustainability-related sample models.
- SAP expanded its Business AI proposition for the chemical industry, positioning AI assistants and agents across product development, manufacturing, asset management, supply chains, and compliance.
- 2024-December: IBM Research introduced open-source AI foundation models for chemistry and materials discovery to support molecular property prediction, classification, reconstruction, and sustainable materials development.
- 2024-December: AWS worked with Bayer to explore generative AI for chemical reaction-condition prediction, including prototype development using Amazon SageMaker and chatbot-based chemical-reaction information access.
- 2024-October: Honeywell introduced AI-enabled industrial solutions designed to improve operator performance, efficiency, reliability, and movement toward autonomous process operations.
- 2024-October: Honeywell and Chevron collaborated on AI-assisted industrial process solutions, initially focusing on next-generation alarm-management technology for refining operations.
- 2024-August: AWS and Cepsa Química deployed a generative-AI product-stewardship assistant using Amazon Bedrock to improve compliance-related chemical product information retrieval.
- AWS, Accenture, Intel, and Good Chemistry collaborated on AI-enabled PFAS materials research, combining cloud-based high-performance computing, quantum chemistry, AI, and machine learning.
- 2024-April: AVEVA opened a Customer Experience Center in Hyderabad, India, supporting industrial software, AI, digital twins, advanced R&D laboratories, and regional customer demonstrations.
List of Key Companies Profiled
- IBM Corporation
- Microsoft Corporation
- SAP SE
- Amazon Web Services
- AspenTech
- Siemens AG
- Honeywell
- AVEVA
- Accenture
AI In Chemicals Market Report Segmentation
By Type
- Software
- Services
- Hardware
By End-use
- Base Chemicals & Petrochemicals
- Specialty Chemicals
- Agricultural Chemicals
By Application
- Production Optimization
- New Material Innovation
- Operational Process Management
- Pricing Optimization
- Raw Material Demand Forecasting
- Other Application
By Geography
- North America
- US
- Canada
- Mexico
- Rest of North America
- Europe
- Germany
- UK
- France
- Russia
- Spain
- Italy
- Rest of Europe
- Asia Pacific
- China
- Japan
- India
- South Korea
- Singapore
- Malaysia
- Rest of Asia Pacific
- LAMEA
- Brazil
- Argentina
- UAE
- Saudi Arabia
- South Africa
- Nigeria
- Rest of LAMEA
1.1 Market Definition
1.2 Analysis Period & Currency
1.3 Segmentation
1.4 AI In Chemicals Market, by Geography
1.5 Research Methodology
Chapter 2. Market Overview
2.1 COVID-19 Impact
2.2 Market Composition and Scenario
Chapter 3. Key Factors Impacting Market
3.1 Market Drivers
3.2 Market Restraints
3.3 Market Opportunities
3.4 Market Challenges
3.5 Market Trends
3.6 State of Competition
3.7 Market Consolidation
3.8 Key Customer Criteria
Chapter 4. Product Life Cycle
Chapter 5. Value Chain Analysis of AI in Chemicals Market
Chapter 6. Competition Analysis - Global
6.1 Market Share Analysis
6.2 Recent Developments
6.2.1 Product Launch & Product Expansion
6.2.2 Partnership, Collaboration & Agreements
6.2.3 Geographical Expansion
Chapter 7. Segmentation By Type
7.1 Software
7.2 Hardware
7.3 Services
Chapter 8. Segmentation By End-use
8.1 Base Chemicals & Petrochemicals
8.2 Specialty Chemicals
8.3 Agricultural Chemicals
Chapter 9. Segmentation By Application
9.1 Production Optimization
9.2 New Material Innovation
9.3 Operational Process Management
9.4 Pricing Optimization
9.5 Raw Material Demand Forecasting
9.6 Other Application
Chapter 10. North America Market
10.1 Market Overview
10.2 Key Factors Impacting Market
10.2.1 Market Drivers
10.2.2 Market Restraints
10.2.3 Market Opportunities
10.2.4 Market Challenges
10.2.5 Market Trends
10.2.6 State of Competition
10.2.7 Market Consolidation
10.2.8 Key Customer Criteria
10.3 Product Life Cycle
10.4 Segmentation By Type
10.4.1 Software
10.4.2 Hardware
10.4.3 Services
10.5 Segmentation By End-use
10.5.1 Base Chemicals & Petrochemicals
10.5.2 Specialty Chemicals
10.5.3 Agricultural Chemicals
10.6 Segmentation By Application
10.6.1 Production Optimization
10.6.2 New Material Innovation
10.6.3 Operational Process Management
10.6.4 Pricing Optimization
10.6.5 Raw Material Demand Forecasting
10.6.6 Other Application
10.7 Segmentation By Country
10.7.1 US
10.7.1.1 Segmentation By Type
10.7.1.1.1 Software
10.7.1.1.2 Hardware
10.7.1.1.3 Services
10.7.1.2 Segmentation By End-use
10.7.1.2.1 Base Chemicals & Petrochemicals
10.7.1.2.2 Specialty Chemicals
10.7.1.2.3 Agricultural Chemicals
10.7.1.3 Segmentation By Application
10.7.1.3.1 Production Optimization
10.7.1.3.2 New Material Innovation
10.7.1.3.3 Operational Process Management
10.7.1.3.4 Pricing Optimization
10.7.1.3.5 Raw Material Demand Forecasting
10.7.1.3.6 Other Application
10.7.2 Canada
10.7.2.1 Segmentation By Type
10.7.2.1.1 Software
10.7.2.1.2 Hardware
10.7.2.1.3 Services
10.7.2.2 Segmentation By End-use
10.7.2.2.1 Base Chemicals & Petrochemicals
10.7.2.2.2 Specialty Chemicals
10.7.2.2.3 Agricultural Chemicals
10.7.2.3 Segmentation By Application
10.7.2.3.1 Production Optimization
10.7.2.3.2 New Material Innovation
10.7.2.3.3 Operational Process Management
10.7.2.3.4 Pricing Optimization
10.7.2.3.5 Raw Material Demand Forecasting
10.7.2.3.6 Other Application
10.7.3 Mexico
10.7.3.1 Segmentation By Type
10.7.3.1.1 Software
10.7.3.1.2 Hardware
10.7.3.1.3 Services
10.7.3.2 Segmentation By End-use
10.7.3.2.1 Base Chemicals & Petrochemicals
10.7.3.2.2 Specialty Chemicals
10.7.3.2.3 Agricultural Chemicals
10.7.3.3 Segmentation By Application
10.7.3.3.1 Production Optimization
10.7.3.3.2 New Material Innovation
10.7.3.3.3 Operational Process Management
10.7.3.3.4 Pricing Optimization
10.7.3.3.5 Raw Material Demand Forecasting
10.7.3.3.6 Other Application
10.7.4 Rest of North America
10.7.4.1 Segmentation By Type
10.7.4.1.1 Software
10.7.4.1.2 Hardware
10.7.4.1.3 Services
10.7.4.2 Segmentation By End-use
10.7.4.2.1 Base Chemicals & Petrochemicals
10.7.4.2.2 Specialty Chemicals
10.7.4.2.3 Agricultural Chemicals
10.7.4.3 Segmentation By Application
10.7.4.3.1 Production Optimization
10.7.4.3.2 New Material Innovation
10.7.4.3.3 Operational Process Management
10.7.4.3.4 Pricing Optimization
10.7.4.3.5 Raw Material Demand Forecasting
10.7.4.3.6 Other Application
Chapter 11. Europe Market
11.1 Market Overview
11.2 Key Factors Impacting Market
11.2.1 Market Drivers
11.2.2 Market Restraints
11.2.3 Market Opportunities
11.2.4 Market Challenges
11.2.5 Market Trends
11.2.6 State of Competition
11.2.7 Market Consolidation
11.2.8 Key Customer Criteria
11.3 Product Life Cycle
11.4 Segmentation By Type
11.4.1 Software
11.4.2 Hardware
11.4.3 Services
11.5 Segmentation By End-use
11.5.1 Base Chemicals & Petrochemicals
11.5.2 Specialty Chemicals
11.5.3 Agricultural Chemicals
11.6 Segmentation By Application
11.6.1 Production Optimization
11.6.2 New Material Innovation
11.6.3 Operational Process Management
11.6.4 Pricing Optimization
11.6.5 Raw Material Demand Forecasting
11.6.6 Other Applications
11.7 Segmentation By Country
11.7.1 Germany
11.7.1.1 Segmentation By Type
11.7.1.1.1 Software
11.7.1.1.2 Hardware
11.7.1.1.3 Services
11.7.1.2 Segmentation By End-use
11.7.1.2.1 Base Chemicals & Petrochemicals
11.7.1.2.2 Specialty Chemicals
11.7.1.2.3 Agricultural Chemicals
11.7.1.3 Segmentation By Application
11.7.1.3.1 Production Optimization
11.7.1.3.2 New Material Innovation
11.7.1.3.3 Operational Process Management
11.7.1.3.4 Pricing Optimization
11.7.1.3.5 Raw Material Demand Forecasting
11.7.1.3.6 Other Application
11.7.2 UK
11.7.2.1 Segmentation By Type
11.7.2.1.1 Software
11.7.2.1.2 Hardware
11.7.2.1.3 Services
11.7.2.2 Segmentation By End-use
11.7.2.2.1 Base Chemicals & Petrochemicals
11.7.2.2.2 Specialty Chemicals
11.7.2.2.3 Agricultural Chemicals
11.7.2.3 Segmentation By Application
11.7.2.3.1 Production Optimization
11.7.2.3.2 New Material Innovation
11.7.2.3.3 Operational Process Management
11.7.2.3.4 Pricing Optimization
11.7.2.3.5 Raw Material Demand Forecasting
11.7.2.3.6 Other Application
11.7.3 France
11.7.3.1 Segmentation By Type
11.7.3.1.1 Software
11.7.3.1.2 Hardware
11.7.3.1.3 Services
11.7.3.2 Segmentation By End-use
11.7.3.2.1 Base Chemicals & Petrochemicals
11.7.3.2.2 Specialty Chemicals
11.7.3.2.3 Agricultural Chemicals
11.7.3.3 Segmentation By Application
11.7.3.3.1 Production Optimization
11.7.3.3.2 New Material Innovation
11.7.3.3.3 Operational Process Management
11.7.3.3.4 Pricing Optimization
11.7.3.3.5 Raw Material Demand Forecasting
11.7.3.3.6 Other Application
11.7.4 Russia
11.7.4.1 Segmentation By Type
11.7.4.1.1 Software
11.7.4.1.2 Hardware
11.7.4.1.3 Services
11.7.4.2 Segmentation By End-use
11.7.4.2.1 Base Chemicals & Petrochemicals
11.7.4.2.2 Specialty Chemicals
11.7.4.2.3 Agricultural Chemicals
11.7.4.3 Segmentation By Application
11.7.4.3.1 Production Optimization
11.7.4.3.2 New Material Innovation
11.7.4.3.3 Operational Process Management
11.7.4.3.4 Pricing Optimization
11.7.4.3.5 Raw Material Demand Forecasting
11.7.4.3.6 Other Application
11.7.5 Spain
11.7.5.1 Segmentation By Type
11.7.5.1.1 Software
11.7.5.1.2 Hardware
11.7.5.1.3 Services
11.7.5.2 Segmentation By End-use
11.7.5.2.1 Base Chemicals & Petrochemicals
11.7.5.2.2 Specialty Chemicals
11.7.5.2.3 Agricultural Chemicals
11.7.5.3 Segmentation By Application 11.7.5.3.1 Production Optimization
11.7.5.3.2 New Material Innovation
11.7.5.3.3 Operational Process Management
11.7.5.3.4 Pricing Optimization
11.7.5.3.5 Raw Material Demand Forecasting
11.7.5.3.6 Other Application
11.7.6 Italy
11.7.6.1 Segmentation By Type
11.7.6.1.1 Software
11.7.6.1.2 Hardware
11.7.6.1.3 Services
11.7.6.2 Segmentation By End-use
11.7.6.2.1 Base Chemicals & Petrochemicals
11.7.6.2.2 Specialty Chemicals
11.7.6.2.3 Agricultural Chemicals
11.7.6.3 Segmentation By Application
11.7.6.3.1 Production Optimization
11.7.6.3.2 New Material Innovation
11.7.6.3.3 Operational Process Management
11.7.6.3.4 Pricing Optimization
11.7.6.3.5 Raw Material Demand Forecasting
11.7.6.3.6 Other Application
11.7.7 Rest of Europe
11.7.7.1 Segmentation By Type
11.7.7.1.1 Software
11.7.7.1.2 Hardware
11.7.7.1.3 Services
11.7.7.2 Segmentation By End-use
11.7.7.2.1 Base Chemicals & Petrochemicals
11.7.7.2.2 Specialty Chemicals
11.7.7.2.3 Agricultural Chemicals
11.7.7.3 Segmentation By Application
11.7.7.3.1 Production Optimization
11.7.7.3.2 New Material Innovation
11.7.7.3.3 Operational Process Management
11.7.7.3.4 Pricing Optimization
11.7.7.3.5 Raw Material Demand Forecasting
11.7.7.3.6 Other Application
Chapter 12. Asia Pacific Market
12.1 Market Overview
12.2 Key Factors Impacting Market
12.2.1 Market Drivers
12.2.2 Market Restraints
12.2.3 Market Opportunities
12.2.4 Market Challenges
12.2.5 Market Trends
12.2.6 State of Competition
12.2.7 Market Consolidation
12.2.8 Key Customer Criteria
12.3 Product Life Cycle
12.4 Segmentation By Type
12.4.1 Software
12.4.2 Hardware
12.4.3 Services
12.5 Segmentation By End-use
12.5.1 Base Chemicals & Petrochemicals
12.5.2 Specialty Chemicals
12.5.3 Agricultural Chemicals
12.6 Segmentation By Application
12.6.1 Production Optimization
12.6.2 New Material Innovation
12.6.3 Operational Process Management
12.6.4 Pricing Optimization
12.6.5 Raw Material Demand Forecasting
12.6.6 Other Application
12.7 Segmentation By Country
12.7.1 China
12.7.1.1 Segmentation By Type
12.7.1.1.1 Software
12.7.1.1.2 Hardware
12.7.1.1.3 Services
12.7.1.2 Segmentation By End-use
12.7.1.2.1 Base Chemicals & Petrochemicals
12.7.1.2.2 Specialty Chemicals
12.7.1.2.3 Agricultural Chemicals
12.7.1.3 Segmentation By Application
12.7.1.3.1 Production Optimization
12.7.1.3.2 New Material Innovation
12.7.1.3.3 Operational Process Management
12.7.1.3.4 Pricing Optimization
12.7.1.3.5 Raw Material Demand Forecasting
12.7.1.3.6 Other Application
12.7.2 Japan
12.7.2.1 Segmentation By Type
12.7.2.1.1 Software
12.7.2.1.2 Hardware
12.7.2.1.3 Services
12.7.2.2 Segmentation By End-use
12.7.2.2.1 Base Chemicals & Petrochemicals
12.7.2.2.2 Specialty Chemicals
12.7.2.2.3 Agricultural Chemicals
12.7.2.3 Segmentation By Application
12.7.2.3.1 Production Optimization
12.7.2.3.2 New Material Innovation
12.7.2.3.3 Operational Process Management
12.7.2.3.4 Pricing Optimization
12.7.2.3.5 Raw Material Demand Forecasting
12.7.2.3.6 Other Application
12.7.3 India
12.7.3.1 Segmentation By Type
12.7.3.1.1 Software
12.7.3.1.2 Hardware
12.7.3.1.3 Services
12.7.3.2 Segmentation By End-use
12.7.3.2.1 Base Chemicals & Petrochemicals
12.7.3.2.2 Specialty Chemicals
12.7.3.2.3 Agricultural Chemicals
12.7.3.3 Segmentation By Application
12.7.3.3.1 Production Optimization
12.7.3.3.2 New Material Innovation
12.7.3.3.3 Operational Process Management
12.7.3.3.4 Pricing Optimization
12.7.3.3.5 Raw Material Demand Forecasting
12.7.3.3.6 Other Application
12.7.4 South Korea
12.7.4.1 Segmentation By Type
12.7.4.1.1 Software
12.7.4.1.2 Hardware
12.7.4.1.3 Services
12.7.4.2 Segmentation By End-use
12.7.4.2.1 Base Chemicals & Petrochemicals
12.7.4.2.2 Specialty Chemicals
12.7.4.2.3 Agricultural Chemicals
12.7.4.3 Segmentation By Application
12.7.4.3.1 Production Optimization
12.7.4.3.2 New Material Innovation
12.7.4.3.3 Operational Process Management
12.7.4.3.4 Pricing Optimization
12.7.4.3.5 Raw Material Demand Forecasting
12.7.4.3.6 Other Application
12.7.5 Singapore
12.7.5.1 Segmentation By Type
12.7.5.1.1 Software
12.7.5.1.2 Hardware
12.7.5.1.3 Services
12.7.5.2 Segmentation By End-use
12.7.5.2.1 Base Chemicals & Petrochemicals
12.7.5.2.2 Specialty Chemicals
12.7.5.2.3 Agricultural Chemicals
12.7.5.3 Segmentation By Application
12.7.5.3.1 Production Optimization
12.7.5.3.2 New Material Innovation
12.7.5.3.3 Operational Process Management
12.7.5.3.4 Pricing Optimization
12.7.5.3.5 Raw Material Demand Forecasting
12.7.5.3.6 Other Application
12.7.6 Malaysia
12.7.6.1 Segmentation By Type
12.7.6.1.1 Software
12.7.6.1.2 Hardware
12.7.6.1.3 Services
12.7.6.2 Segmentation By End-use
12.7.6.2.1 Base Chemicals & Petrochemicals
12.7.6.2.2 Specialty Chemicals
12.7.6.2.3 Agricultural Chemicals
12.7.6.3 Segmentation By Application
12.7.6.3.1 Production Optimization
12.7.6.3.2 New Material Innovation
12.7.6.3.3 Operational Process Management
12.7.6.3.4 Pricing Optimization
12.7.6.3.5 Raw Material Demand Forecasting
12.7.6.3.6 Other Application
12.7.7 Rest of Asia Pacific
12.7.7.1 Segmentation By Type
12.7.7.1.1 Software
12.7.7.1.2 Hardware
12.7.7.1.3 Services
12.7.7.2 Segmentation By End-use
12.7.7.2.1 Base Chemicals & Petrochemicals
12.7.7.2.2 Specialty Chemicals
12.7.7.2.3 Agricultural Chemicals
12.7.7.3 Segmentation By Application
12.7.7.3.1 Production Optimization
12.7.7.3.2 New Material Innovation
12.7.7.3.3 Operational Process Management
12.7.7.3.4 Pricing Optimization
12.7.7.3.5 Raw Material Demand Forecasting
12.7.7.3.6 Other Application
Chapter 13. LAMEA Market
13.1 Market Overview
13.2 Key Factors Impacting Market
13.2.1 Market Drivers
13.2.2 Market Restraints
13.2.3 Market Opportunities
13.2.4 Market Challenges
13.2.5 Market Trends
13.2.6 State of Competition
13.2.7 Market Consolidation
13.2.8 Key Customer Criteria
13.3 Product Life Cycle
13.4 Segmentation By Type
13.4.1 Software
13.4.2 Hardware
13.4.3 Services
13.5 Segmentation By End-use
13.5.1 Base Chemicals & Petrochemicals
13.5.2 Specialty Chemicals
13.5.3 Agricultural Chemicals
13.6 Segmentation By Application
13.6.1 Production Optimization
13.6.2 New Material Innovation
13.6.3 Operational Process Management
13.6.4 Pricing Optimization
13.6.5 Raw Material Demand Forecasting
13.6.6 Other Application
13.7 Segmentation By Country
13.7.1 Brazil
13.7.1.1 Segmentation By Type
13.7.1.1.1 Software
13.7.1.1.2 Hardware
13.7.1.1.3 Services
13.7.1.2 Segmentation By End-use
13.7.1.2.1 Base Chemicals & Petrochemicals
13.7.1.2.2 Specialty Chemicals
13.7.1.2.3 Agricultural Chemicals
13.7.1.3 Segmentation By Application
13.7.1.3.1 Production Optimization
13.7.1.3.2 New Material Innovation
13.7.1.3.3 Operational Process Management
13.7.1.3.4 Pricing Optimization
13.7.1.3.5 Raw Material Demand Forecasting
13.7.1.3.6 Other Application
13.7.2 Argentina
13.7.2.1 Segmentation By Type
13.7.2.1.1 Software
13.7.2.1.2 Hardware
13.7.2.1.3 Services
13.7.2.2 Segmentation By End-use
13.7.2.2.1 Base Chemicals & Petrochemicals
13.7.2.2.2 Specialty Chemicals
13.7.2.2.3 Agricultural Chemicals
13.7.2.3 Segmentation By Application
13.7.2.3.1 Production Optimization
13.7.2.3.2 New Material Innovation
13.7.2.3.3 Operational Process Management
13.7.2.3.4 Pricing Optimization
13.7.2.3.5 Raw Material Demand Forecasting
13.7.2.3.6 Other Application
13.7.3 UAE
13.7.3.1 Segmentation By Type
13.7.3.1.1 Software
13.7.3.1.2 Hardware
13.7.3.1.3 Services 13.7.3.2 Segmentation By End-use
13.7.3.2.1 Base Chemicals & Petrochemicals
13.7.3.2.2 Specialty Chemicals
13.7.3.2.3 Agricultural Chemicals
13.7.3.3 Segmentation By Application
13.7.3.3.1 Production Optimization
13.7.3.3.2 New Material Innovation
13.7.3.3.3 Operational Process Management
13.7.3.3.4 Pricing Optimization
13.7.3.3.5 Raw Material Demand Forecasting
13.7.3.3.6 Other Application
13.7.4 Saudi Arabia
13.7.4.1 Segmentation By Type
13.7.4.1.1 Software
13.7.4.1.2 Hardware
13.7.4.1.3 Services
13.7.4.2 Segmentation By End-use
13.7.4.2.1 Base Chemicals & Petrochemicals
13.7.4.2.2 Specialty Chemicals
13.7.4.2.3 Agricultural Chemicals
13.7.4.3 Segmentation By Application
13.7.4.3.1 Production Optimization
13.7.4.3.2 New Material Innovation
13.7.4.3.3 Operational Process Management
13.7.4.3.4 Pricing Optimization
13.7.4.3.5 Raw Material Demand Forecasting
13.7.4.3.6 Other Application
13.7.5 South Africa
13.7.5.1 Segmentation By Type
13.7.5.1.1 Software
13.7.5.1.2 Hardware
13.7.5.1.3 Services
13.7.5.2 Segmentation By End-use
13.7.5.2.1 Base Chemicals & Petrochemicals
13.7.5.2.2 Specialty Chemicals
13.7.5.2.3 Agricultural Chemicals
13.7.5.3 Segmentation By Application
13.7.5.3.1 Production Optimization
13.7.5.3.2 New Material Innovation
13.7.5.3.3 Operational Process Management
13.7.5.3.4 Pricing Optimization
13.7.5.3.5 Raw Material Demand Forecasting
13.7.5.3.6 Other Application
13.7.6 Nigeria
13.7.6.1 Segmentation By Type
13.7.6.1.1 Software
13.7.6.1.2 Hardware
13.7.6.1.3 Services
13.7.6.2 Segmentation By End-use
13.7.6.2.1 Base Chemicals & Petrochemicals
13.7.6.2.2 Specialty Chemicals
13.7.6.2.3 Agricultural Chemicals
13.7.6.3 Segmentation By Application
13.7.6.3.1 Production Optimization
13.7.6.3.2 New Material Innovation
13.7.6.3.3 Operational Process Management
13.7.6.3.4 Pricing Optimization
13.7.6.3.5 Raw Material Demand Forecasting
13.7.6.3.6 Other Application
13.7.7 Rest of LAMEA
13.7.7.1 Segmentation By Type
13.7.7.1.1 Software
13.7.7.1.2 Hardware
13.7.7.1.3 Services
13.7.7.2 Segmentation By End-use
13.7.7.2.1 Base Chemicals & Petrochemicals
13.7.7.2.2 Specialty Chemicals
13.7.7.2.3 Agricultural Chemicals
13.7.7.3 Segmentation By Application
13.7.7.3.1 Production Optimization
13.7.7.3.2 New Material Innovation
13.7.7.3.3 Operational Process Management
13.7.7.3.4 Pricing Optimization
13.7.7.3.5 Raw Material Demand Forecasting
13.7.7.3.6 Other Application
Chapter 14. Company Snapshots
14.1 IBM Corporation
14.1.1 Business Overview
14.1.2 Key Information
14.1.3 Company Focus on AI in Chemicals Market
14.1.4 Strategic Insights
14.1.5 Strategy Deployed
14.1.6 Product & Service Portfolio
14.1.7 Technology & Innovation Focus
14.1.8 SWOT Analysis
14.1.9 Customers / End Users
14.1.10 Competitive Positioning
14.1.11 Key Differentiators
14.1.12 Portfolio Matrix
14.1.13 Analyst View
14.1.14 Future Outlook
14.2 Microsoft Corporation
14.2.1 Business Overview
14.2.2 Key Information
14.2.3 Company Focus on AI in Chemicals Market
14.2.4 Strategic Insights
14.2.5 Strategy Deployed
14.2.6 Product & Service Portfolio
14.2.7 Technology & Innovation Focus
14.2.8 SWOT Analysis
14.2.9 Customers / End Users
14.2.10 Competitive Positioning
14.2.11 Key Differentiators
14.2.12 Portfolio Matrix
14.2.13 Analyst View
14.2.14 Future Outlook
14.3 Google
14.3.1 Business Overview
14.3.2 Key Information
14.3.3 Company Focus on AI in Chemicals Market
14.3.4 Strategic Insights
14.3.5 Strategy Deployed
14.3.6 Product & Service Portfolio
14.3.7 Technology & Innovation Focus
14.3.8 SWOT Analysis
14.3.9 Customers / End Users
14.3.10 Competitive Positioning
14.3.11 Key Differentiators
14.3.12 Portfolio Matrix
14.3.13 Analyst View
14.3.14 Future Outlook
14.4 SAP SE
14.4.1 Business Overview
14.4.2 Key Information
14.4.3 Company Focus on AI in Chemicals Market
14.4.4 Strategic Insights
14.4.5 Strategy Deployed
14.4.6 Product & Service Portfolio
14.4.7 Technology & Innovation Focus
14.4.8 SWOT Analysis
14.4.9 Customers / End Users
14.4.10 Competitive Positioning
14.4.11 Key Differentiators
14.4.12 Portfolio Matrix
14.4.13 Analyst View
14.4.14 Future Outlook
14.5 Amazon Web Services
14.5.1 Business Overview
14.5.2 Key Information
14.5.3 Company Focus on AI in Chemicals Market
14.5.4 Strategic Insights
14.5.5 Strategy Deployed
14.5.6 Product & Service Portfolio
14.5.7 Technology & Innovation Focus
14.5.8 SWOT Analysis
14.5.9 Customers / End Users
14.5.10 Competitive Positioning
14.5.11 Key Differentiators
14.5.12 Portfolio Matrix
14.5.13 Analyst View
14.5.14 Future Outlook
14.6 AspenTech
14.6.1 Business Overview
14.6.2 Key Information
14.6.3 Company Focus on AI in Chemicals Market
14.6.4 Strategic Insights
14.6.5 Strategy Deployed
14.6.6 Product & Service Portfolio
14.6.7 Technology & Innovation Focus
14.6.8 SWOT Analysis
14.6.9 Customers / End Users
14.6.10 Competitive Positioning
14.6.11 Key Differentiators
14.6.12 Portfolio Matrix
14.6.13 Analyst View
14.6.14 Future Outlook
14.7 Siemens AG
14.7.1 Business Overview
14.7.2 Key Information
14.7.3 Company Focus on AI in Chemicals Market
14.7.4 Strategic Insights
14.7.5 Strategy Deployed
14.7.6 Product & Service Portfolio
14.7.7 Technology & Innovation Focus
14.7.8 SWOT Analysis
14.7.9 Customers / End Users
14.7.10 Competitive Positioning
14.7.11 Key Differentiators
14.7.12 Portfolio Matrix
14.7.13 Analyst View
14.7.14 Future Outlook
14.8 Honeywell
14.8.1 Business Overview
14.8.2 Key Information
14.8.3 Company Focus on AI in Chemicals Market
14.8.4 Strategic Insights
14.8.5 Strategy Deployed
14.8.6 Product & Service Portfolio
14.8.7 Technology & Innovation Focus
14.8.8 SWOT Analysis
14.8.9 Customers / End Users
14.8.10 Competitive Positioning
14.8.11 Key Differentiators
14.8.12 Portfolio Matrix
14.8.13 Analyst View
14.8.14 Future Outlook
14.9 AVEVA
14.9.1 Business Overview
14.9.2 Key Information
14.9.3 Company Focus on AI in Chemicals Market
14.9.4 Strategic Insights
14.9.5 Strategy Deployed
14.9.6 Product & Service Portfolio
14.9.7 Technology & Innovation Focus
14.9.8 SWOT Analysis
14.9.9 Customers / End Users
14.9.10 Competitive Positioning
14.9.11 Key Differentiators
14.9.12 Portfolio Matrix
14.9.13 Analyst View
14.9.14 Future Outlook
14.10 Accenture
14.10.1 Business Overview
14.10.2 Key Information
14.10.3 Company Focus on AI in Chemicals Market
14.10.4 Strategic Insights
14.10.5 Strategy Deployed
14.10.6 Product & Service Portfolio
14.10.7 Technology & Innovation Focus
14.10.8 SWOT Analysis
14.10.9 Customers / End Users
14.10.10 Competitive Positioning
14.10.11 Key Differentiators
14.10.12 Portfolio Matrix
14.10.13 Analyst View
14.10.14 Future Outlook
Chapter 15. Winning Imperatives of AI in Chemicals Market
Table 1 Global AI In Chemicals Market Market, 2022 - 2033, USD Million
Table 2 Global AI In Chemicals Market Market by Application, 2022 - 2033, USD Million
Table 3 Global New Material Innovation Market, 2022 - 2033, USD Million
Table 4 Global Operational Process Management Market, 2022 - 2033, USD Million
Table 5 Global Other Application Market, 2022 - 2033, USD Million
Table 6 Global Pricing Optimization Market, 2022 - 2033, USD Million
Table 7 Global Production Optimization Market, 2022 - 2033, USD Million
Table 8 Global Raw Material Demand Forecasting Market, 2022 - 2033, USD Million
Table 9 Global AI In Chemicals Market Market by End-use, 2022 - 2033, USD Million
Table 10 Global Agricultural Chemicals Market, 2022 - 2033, USD Million
Table 11 Global Base Chemicals & Petrochemicals Market, 2022 - 2033, USD Million
Table 12 Global Specialty Chemicals Market, 2022 - 2033, USD Million
Table 13 Global AI In Chemicals Market Market by Type, 2022 - 2033, USD Million
Table 14 Global Hardware Market, 2022 - 2033, USD Million
Table 15 Global Services Market, 2022 - 2033, USD Million
Table 16 Global Software Market, 2022 - 2033, USD Million
Table 17 North America AI In Chemicals Market Market, 2022 - 2033, USD Million
Table 18 North America AI In Chemicals Market Market by Application, 2022 - 2033, USD Million
Table 19 North America New Material Innovation Market, 2022 - 2033, USD Million
Table 20 North America Operational Process Management Market, 2022 - 2033, USD Million
Table 21 North America Other Application Market, 2022 - 2033, USD Million
Table 22 North America Pricing Optimization Market, 2022 - 2033, USD Million
Table 23 North America Production Optimization Market, 2022 - 2033, USD Million
Table 24 North America Raw Material Demand Forecasting Market, 2022 - 2033, USD Million
Table 25 North America AI In Chemicals Market Market by End-use, 2022 - 2033, USD Million
Table 26 North America Agricultural Chemicals Market, 2022 - 2033, USD Million
Table 27 North America Base Chemicals & Petrochemicals Market, 2022 - 2033, USD Million
Table 28 North America Specialty Chemicals Market, 2022 - 2033, USD Million
Table 29 North America AI In Chemicals Market Market by Type, 2022 - 2033, USD Million
Table 30 North America Hardware Market, 2022 - 2033, USD Million
Table 31 North America Services Market, 2022 - 2033, USD Million
Table 32 North America Software Market, 2022 - 2033, USD Million
Table 33 United States AI In Chemicals Market Market, 2022 - 2033, USD Million
Table 34 United States AI In Chemicals Market Market by Application, 2022 - 2033, USD Million
Table 35 United States New Material Innovation Market, 2022 - 2033, USD Million
Table 36 United States Operational Process Management Market, 2022 - 2033, USD Million
Table 37 United States Other Application Market, 2022 - 2033, USD Million
Table 38 United States Pricing Optimization Market, 2022 - 2033, USD Million
Table 39 United States Production Optimization Market, 2022 - 2033, USD Million
Table 40 United States Raw Material Demand Forecasting Market, 2022 - 2033, USD Million
Table 41 United States AI In Chemicals Market Market by End-use, 2022 - 2033, USD Million
Table 42 United States Agricultural Chemicals Market, 2022 - 2033, USD Million
Table 43 United States Base Chemicals & Petrochemicals Market, 2022 - 2033, USD Million
Table 44 United States Specialty Chemicals Market, 2022 - 2033, USD Million
Table 45 United States AI In Chemicals Market Market by Type, 2022 - 2033, USD Million
Table 46 United States Hardware Market, 2022 - 2033, USD Million
Table 47 United States Services Market, 2022 - 2033, USD Million
Table 48 United States Software Market, 2022 - 2033, USD Million
Table 49 Canada AI In Chemicals Market Market, 2022 - 2033, USD Million
Table 50 Canada AI In Chemicals Market Market by Application, 2022 - 2033, USD Million
Table 51 Canada New Material Innovation Market, 2022 - 2033, USD Million
Table 52 Canada Operational Process Management Market, 2022 - 2033, USD Million
Table 53 Canada Other Application Market, 2022 - 2033, USD Million
Table 54 Canada Pricing Optimization Market, 2022 - 2033, USD Million
Table 55 Canada Production Optimization Market, 2022 - 2033, USD Million
Table 56 Canada Raw Material Demand Forecasting Market, 2022 - 2033, USD Million
Table 57 Canada AI In Chemicals Market Market by End-use, 2022 - 2033, USD Million
Table 58 Canada Agricultural Chemicals Market, 2022 - 2033, USD Million
Table 59 Canada Base Chemicals & Petrochemicals Market, 2022 - 2033, USD Million
Table 60 Canada Specialty Chemicals Market, 2022 - 2033, USD Million
Table 61 Canada AI In Chemicals Market Market by Type, 2022 - 2033, USD Million
Table 62 Canada Hardware Market, 2022 - 2033, USD Million
Table 63 Canada Services Market, 2022 - 2033, USD Million
Table 64 Canada Software Market, 2022 - 2033, USD Million
Table 65 Mexico AI In Chemicals Market Market, 2022 - 2033, USD Million
Table 66 Mexico AI In Chemicals Market Market by Application, 2022 - 2033, USD Million
Table 67 Mexico New Material Innovation Market, 2022 - 2033, USD Million
Table 68 Mexico Operational Process Management Market, 2022 - 2033, USD Million
Table 69 Mexico Other Application Market, 2022 - 2033, USD Million
Table 70 Mexico Pricing Optimization Market, 2022 - 2033, USD Million
Table 71 Mexico Production Optimization Market, 2022 - 2033, USD Million
Table 72 Mexico Raw Material Demand Forecasting Market, 2022 - 2033, USD Million
Table 73 Mexico AI In Chemicals Market Market by End-use, 2022 - 2033, USD Million
Table 74 Mexico Agricultural Chemicals Market, 2022 - 2033, USD Million
Table 75 Mexico Base Chemicals & Petrochemicals Market, 2022 - 2033, USD Million
Table 76 Mexico Specialty Chemicals Market, 2022 - 2033, USD Million
Table 77 Mexico AI In Chemicals Market Market by Type, 2022 - 2033, USD Million
Table 78 Mexico Hardware Market, 2022 - 2033, USD Million
Table 79 Mexico Services Market, 2022 - 2033, USD Million
Table 80 Mexico Software Market, 2022 - 2033, USD Million
Table 81 Rest of North America AI In Chemicals Market Market, 2022 - 2033, USD Million
Table 82 Rest of North America AI In Chemicals Market Market by Application, 2022 - 2033, USD Million
Table 83 Rest of North America New Material Innovation Market, 2022 - 2033, USD Million
Table 84 Rest of North America Operational Process Management Market, 2022 - 2033, USD Million
Table 85 Rest of North America Other Application Market, 2022 - 2033, USD Million
Table 86 Rest of North America Pricing Optimization Market, 2022 - 2033, USD Million
Table 87 Rest of North America Production Optimization Market, 2022 - 2033, USD Million
Table 88 Rest of North America Raw Material Demand Forecasting Market, 2022 - 2033, USD Million
Table 89 Rest of North America AI In Chemicals Market Market by End-use, 2022 - 2033, USD Million
Table 90 Rest of North America Agricultural Chemicals Market, 2022 - 2033, USD Million
Table 91 Rest of North America Base Chemicals & Petrochemicals Market, 2022 - 2033, USD Million
Table 92 Rest of North America Specialty Chemicals Market, 2022 - 2033, USD Million
Table 93 Rest of North America AI In Chemicals Market Market by Type, 2022 - 2033, USD Million
Table 94 Rest of North America Hardware Market, 2022 - 2033, USD Million
Table 95 Rest of North America Services Market, 2022 - 2033, USD Million
Table 96 Rest of North America Software Market, 2022 - 2033, USD Million
Table 97 Europe AI In Chemicals Market Market, 2022 - 2033, USD Million
Table 98 Europe AI In Chemicals Market Market by Application, 2022 - 2033, USD Million
Table 99 Europe New Material Innovation Market, 2022 - 2033, USD Million
Table 100 Europe Operational Process Management Market, 2022 - 2033, USD Million
Table 101 Europe Other Application Market, 2022 - 2033, USD Million
Table 102 Europe Pricing Optimization Market, 2022 - 2033, USD Million
Table 103 Europe Production Optimization Market, 2022 - 2033, USD Million
Table 104 Europe Raw Material Demand Forecasting Market, 2022 - 2033, USD Million
Table 105 Europe AI In Chemicals Market Market by End-use, 2022 - 2033, USD Million
Table 106 Europe Agricultural Chemicals Market, 2022 - 2033, USD Million
Table 107 Europe Base Chemicals & Petrochemicals Market, 2022 - 2033, USD Million
Table 108 Europe Specialty Chemicals Market, 2022 - 2033, USD Million
Table 109 Europe AI In Chemicals Market Market by Type, 2022 - 2033, USD Million
Table 110 Europe Hardware Market, 2022 - 2033, USD Million
Table 111 Europe Services Market, 2022 - 2033, USD Million
Table 112 Europe Software Market, 2022 - 2033, USD Million
Table 113 Germany AI In Chemicals Market Market, 2022 - 2033, USD Million
Table 114 Germany AI In Chemicals Market Market by Application, 2022 - 2033, USD Million
Table 115 Germany New Material Innovation Market, 2022 - 2033, USD Million
Table 116 Germany Operational Process Management Market, 2022 - 2033, USD Million
Table 117 Germany Other Application Market, 2022 - 2033, USD Million
Table 118 Germany Pricing Optimization Market, 2022 - 2033, USD Million
Table 119 Germany Production Optimization Market, 2022 - 2033, USD Million
Table 120 Germany Raw Material Demand Forecasting Market, 2022 - 2033, USD Million
Table 121 Germany AI In Chemicals Market Market by End-use, 2022 - 2033, USD Million
Table 122 Germany Agricultural Chemicals Market, 2022 - 2033, USD Million
Table 123 Germany Base Chemicals & Petrochemicals Market, 2022 - 2033, USD Million
Table 124 Germany Specialty Chemicals Market, 2022 - 2033, USD Million
Table 125 Germany AI In Chemicals Market Market by Type, 2022 - 2033, USD Million
Table 126 Germany Hardware Market, 2022 - 2033, USD Million
Table 127 Germany Services Market, 2022 - 2033, USD Million
Table 128 Germany Software Market, 2022 - 2033, USD Million
Table 129 United Kingdom AI In Chemicals Market Market, 2022 - 2033, USD Million
Table 130 United Kingdom AI In Chemicals Market Market by Application, 2022 - 2033, USD Million
Table 131 United Kingdom New Material Innovation Market, 2022 - 2033, USD Million
Table 132 United Kingdom Operational Process Management Market, 2022 - 2033, USD Million
Table 133 United Kingdom Other Application Market, 2022 - 2033, USD Million
Table 134 United Kingdom Pricing Optimization Market, 2022 - 2033, USD Million
Table 135 United Kingdom Production Optimization Market, 2022 - 2033, USD Million
Table 136 United Kingdom Raw Material Demand Forecasting Market, 2022 - 2033, USD Million
Table 137 United Kingdom AI In Chemicals Market Market by End-use, 2022 - 2033, USD Million
Table 138 United Kingdom Agricultural Chemicals Market, 2022 - 2033, USD Million
Table 139 United Kingdom Base Chemicals & Petrochemicals Market, 2022 - 2033, USD Million
Table 140 United Kingdom Specialty Chemicals Market, 2022 - 2033, USD Million
Table 141 United Kingdom AI In Chemicals Market Market by Type, 2022 - 2033, USD Million
Table 142 United Kingdom Hardware Market, 2022 - 2033, USD Million
Table 143 United Kingdom Services Market, 2022 - 2033, USD Million
Table 144 United Kingdom Software Market, 2022 - 2033, USD Million
Table 145 France AI In Chemicals Market Market, 2022 - 2033, USD Million
Table 146 France AI In Chemicals Market Market by Application, 2022 - 2033, USD Million
Table 147 France New Material Innovation Market, 2022 - 2033, USD Million
Table 148 France Operational Process Management Market, 2022 - 2033, USD Million
Table 149 France Other Application Market, 2022 - 2033, USD Million
Table 150 France Pricing Optimization Market, 2022 - 2033, USD Million
Table 151 France Production Optimization Market, 2022 - 2033, USD Million
Table 152 France Raw Material Demand Forecasting Market, 2022 - 2033, USD Million
Table 153 France AI In Chemicals Market Market by End-use, 2022 - 2033, USD Million
Table 154 France Agricultural Chemicals Market, 2022 - 2033, USD Million
Table 155 France Base Chemicals & Petrochemicals Market, 2022 - 2033, USD Million
Table 156 France Specialty Chemicals Market, 2022 - 2033, USD Million
Table 157 France AI In Chemicals Market Market by Type, 2022 - 2033, USD Million
Table 158 France Hardware Market, 2022 - 2033, USD Million
Table 159 France Services Market, 2022 - 2033, USD Million
Table 160 France Software Market, 2022 - 2033, USD Million
Table 161 Russia AI In Chemicals Market Market, 2022 - 2033, USD Million
Table 162 Russia AI In Chemicals Market Market by Application, 2022 - 2033, USD Million
Table 163 Russia New Material Innovation Market, 2022 - 2033, USD Million
Table 164 Russia Operational Process Management Market, 2022 - 2033, USD Million
Table 165 Russia Other Application Market, 2022 - 2033, USD Million
Table 166 Russia Pricing Optimization Market, 2022 - 2033, USD Million
Table 167 Russia Production Optimization Market, 2022 - 2033, USD Million
Table 168 Russia Raw Material Demand Forecasting Market, 2022 - 2033, USD Million
Table 169 Russia AI In Chemicals Market Market by End-use, 2022 - 2033, USD Million
Table 170 Russia Agricultural Chemicals Market, 2022 - 2033, USD Million
Table 171 Russia Base Chemicals & Petrochemicals Market, 2022 - 2033, USD Million
Table 172 Russia Specialty Chemicals Market, 2022 - 2033, USD Million
Table 173 Russia AI In Chemicals Market Market by Type, 2022 - 2033, USD Million
Table 174 Russia Hardware Market, 2022 - 2033, USD Million
Table 175 Russia Services Market, 2022 - 2033, USD Million
Table 176 Russia Software Market, 2022 - 2033, USD Million
Table 177 Spain AI In Chemicals Market Market, 2022 - 2033, USD Million
Table 178 Spain AI In Chemicals Market Market by Application, 2022 - 2033, USD Million
Table 179 Spain New Material Innovation Market, 2022 - 2033, USD Million
Table 180 Spain Operational Process Management Market, 2022 - 2033, USD Million
Table 181 Spain Other Application Market, 2022 - 2033, USD Million
Table 182 Spain Pricing Optimization Market, 2022 - 2033, USD Million
Table 183 Spain Production Optimization Market, 2022 - 2033, USD Million
Table 184 Spain Raw Material Demand Forecasting Market, 2022 - 2033, USD Million
Table 185 Spain AI In Chemicals Market Market by End-use, 2022 - 2033, USD Million
Table 186 Spain Agricultural Chemicals Market, 2022 - 2033, USD Million
Table 187 Spain Base Chemicals & Petrochemicals Market, 2022 - 2033, USD Million
Table 188 Spain Specialty Chemicals Market, 2022 - 2033, USD Million
Table 189 Spain AI In Chemicals Market Market by Type, 2022 - 2033, USD Million
Table 190 Spain Hardware Market, 2022 - 2033, USD Million
Table 191 Spain Services Market, 2022 - 2033, USD Million
Table 192 Spain Software Market, 2022 - 2033, USD Million
Table 193 Italy AI In Chemicals Market Market, 2022 - 2033, USD Million
Table 194 Italy AI In Chemicals Market Market by Application, 2022 - 2033, USD Million
Table 195 Italy New Material Innovation Market, 2022 - 2033, USD Million
Table 196 Italy Operational Process Management Market, 2022 - 2033, USD Million
Table 197 Italy Other Application Market, 2022 - 2033, USD Million
Table 198 Italy Pricing Optimization Market, 2022 - 2033, USD Million
Table 199 Italy Production Optimization Market, 2022 - 2033, USD Million
Table 200 Italy Raw Material Demand Forecasting Market, 2022 - 2033, USD Million
Table 201 Italy AI In Chemicals Market Market by End-use, 2022 - 2033, USD Million
Table 202 Italy Agricultural Chemicals Market, 2022 - 2033, USD Million
Table 203 Italy Base Chemicals & Petrochemicals Market, 2022 - 2033, USD Million
Table 204 Italy Specialty Chemicals Market, 2022 - 2033, USD Million
Table 205 Italy AI In Chemicals Market Market by Type, 2022 - 2033, USD Million
Table 206 Italy Hardware Market, 2022 - 2033, USD Million
Table 207 Italy Services Market, 2022 - 2033, USD Million
Table 208 Italy Software Market, 2022 - 2033, USD Million
Table 209 Rest of Europe AI In Chemicals Market Market, 2022 - 2033, USD Million
Table 210 Rest of Europe AI In Chemicals Market Market by Application, 2022 - 2033, USD Million
Table 211 Rest of Europe New Material Innovation Market, 2022 - 2033, USD Million
Table 212 Rest of Europe Operational Process Management Market, 2022 - 2033, USD Million
Table 213 Rest of Europe Other Application Market, 2022 - 2033, USD Million
Table 214 Rest of Europe Pricing Optimization Market, 2022 - 2033, USD Million
Table 215 Rest of Europe Production Optimization Market, 2022 - 2033, USD Million
Table 216 Rest of Europe Raw Material Demand Forecasting Market, 2022 - 2033, USD Million
Table 217 Rest of Europe AI In Chemicals Market Market by End-use, 2022 - 2033, USD Million
Table 218 Rest of Europe Agricultural Chemicals Market, 2022 - 2033, USD Million
Table 219 Rest of Europe Base Chemicals & Petrochemicals Market, 2022 - 2033, USD Million
Table 220 Rest of Europe Specialty Chemicals Market, 2022 - 2033, USD Million
Table 221 Rest of Europe AI In Chemicals Market Market by Type, 2022 - 2033, USD Million
Table 222 Rest of Europe Hardware Market, 2022 - 2033, USD Million
Table 223 Rest of Europe Services Market, 2022 - 2033, USD Million
Table 224 Rest of Europe Software Market, 2022 - 2033, USD Million
Table 225 Asia Pacific AI In Chemicals Market Market, 2022 - 2033, USD Million
Table 226 Asia Pacific AI In Chemicals Market Market by Application, 2022 - 2033, USD Million
Table 227 Asia Pacific New Material Innovation Market, 2022 - 2033, USD Million
Table 228 Asia Pacific Operational Process Management Market, 2022 - 2033, USD Million
Table 229 Asia Pacific Other Application Market, 2022 - 2033, USD Million
Table 230 Asia Pacific Pricing Optimization Market, 2022 - 2033, USD Million
Table 231 Asia Pacific Production Optimization Market, 2022 - 2033, USD Million
Table 232 Asia Pacific Raw Material Demand Forecasting Market, 2022 - 2033, USD Million
Table 233 Asia Pacific AI In Chemicals Market Market by End-use, 2022 - 2033, USD Million
Table 234 Asia Pacific Agricultural Chemicals Market, 2022 - 2033, USD Million
Table 235 Asia Pacific Base Chemicals & Petrochemicals Market, 2022 - 2033, USD Million
Table 236 Asia Pacific Specialty Chemicals Market, 2022 - 2033, USD Million
Table 237 Asia Pacific AI In Chemicals Market Market by Type, 2022 - 2033, USD Million
Table 238 Asia Pacific Hardware Market, 2022 - 2033, USD Million
Table 239 Asia Pacific Services Market, 2022 - 2033, USD Million
Table 240 Asia Pacific Software Market, 2022 - 2033, USD Million
Table 241 China AI In Chemicals Market Market, 2022 - 2033, USD Million
Table 242 China AI In Chemicals Market Market by Application, 2022 - 2033, USD Million
Table 243 China New Material Innovation Market, 2022 - 2033, USD Million
Table 244 China Operational Process Management Market, 2022 - 2033, USD Million Table 245 China Other Application Market, 2022 - 2033, USD Million
Table 246 China Pricing Optimization Market, 2022 - 2033, USD Million
Table 247 China Production Optimization Market, 2022 - 2033, USD Million
Table 248 China Raw Material Demand Forecasting Market, 2022 - 2033, USD Million
Table 249 China AI In Chemicals Market Market by End-use, 2022 - 2033, USD Million
Table 250 China Agricultural Chemicals Market, 2022 - 2033, USD Million
Table 251 China Base Chemicals & Petrochemicals Market, 2022 - 2033, USD Million
Table 252 China Specialty Chemicals Market, 2022 - 2033, USD Million
Table 253 China AI In Chemicals Market Market by Type, 2022 - 2033, USD Million
Table 254 China Hardware Market, 2022 - 2033, USD Million
Table 255 China Services Market, 2022 - 2033, USD Million
Table 256 China Software Market, 2022 - 2033, USD Million
Table 257 Japan AI In Chemicals Market Market, 2022 - 2033, USD Million
Table 258 Japan AI In Chemicals Market Market by Application, 2022 - 2033, USD Million
Table 259 Japan New Material Innovation Market, 2022 - 2033, USD Million
Table 260 Japan Operational Process Management Market, 2022 - 2033, USD Million
Table 261 Japan Other Application Market, 2022 - 2033, USD Million
Table 262 Japan Pricing Optimization Market, 2022 - 2033, USD Million
Table 263 Japan Production Optimization Market, 2022 - 2033, USD Million
Table 264 Japan Raw Material Demand Forecasting Market, 2022 - 2033, USD Million
Table 265 Japan AI In Chemicals Market Market by End-use, 2022 - 2033, USD Million
Table 266 Japan Agricultural Chemicals Market, 2022 - 2033, USD Million
Table 267 Japan Base Chemicals & Petrochemicals Market, 2022 - 2033, USD Million
Table 268 Japan Specialty Chemicals Market, 2022 - 2033, USD Million
Table 269 Japan AI In Chemicals Market Market by Type, 2022 - 2033, USD Million
Table 270 Japan Hardware Market, 2022 - 2033, USD Million
Table 271 Japan Services Market, 2022 - 2033, USD Million
Table 272 Japan Software Market, 2022 - 2033, USD Million
Table 273 India AI In Chemicals Market Market, 2022 - 2033, USD Million
Table 274 India AI In Chemicals Market Market by Application, 2022 - 2033, USD Million
Table 275 India New Material Innovation Market, 2022 - 2033, USD Million
Table 276 India Operational Process Management Market, 2022 - 2033, USD Million
Table 277 India Other Application Market, 2022 - 2033, USD Million
Table 278 India Pricing Optimization Market, 2022 - 2033, USD Million
Table 279 India Production Optimization Market, 2022 - 2033, USD Million
Table 280 India Raw Material Demand Forecasting Market, 2022 - 2033, USD Million
Table 281 India AI In Chemicals Market Market by End-use, 2022 - 2033, USD Million
Table 282 India Agricultural Chemicals Market, 2022 - 2033, USD Million
Table 283 India Base Chemicals & Petrochemicals Market, 2022 - 2033, USD Million
Table 284 India Specialty Chemicals Market, 2022 - 2033, USD Million
Table 285 India AI In Chemicals Market Market by Type, 2022 - 2033, USD Million
Table 286 India Hardware Market, 2022 - 2033, USD Million
Table 287 India Services Market, 2022 - 2033, USD Million
Table 288 India Software Market, 2022 - 2033, USD Million
Table 289 South Korea AI In Chemicals Market Market, 2022 - 2033, USD Million
Table 290 South Korea AI In Chemicals Market Market by Application, 2022 - 2033, USD Million
Table 291 South Korea New Material Innovation Market, 2022 - 2033, USD Million
Table 292 South Korea Operational Process Management Market, 2022 - 2033, USD Million
Table 293 South Korea Other Application Market, 2022 - 2033, USD Million
Table 294 South Korea Pricing Optimization Market, 2022 - 2033, USD Million
Table 295 South Korea Production Optimization Market, 2022 - 2033, USD Million
Table 296 South Korea Raw Material Demand Forecasting Market, 2022 - 2033, USD Million
Table 297 South Korea AI In Chemicals Market Market by End-use, 2022 - 2033, USD Million
Table 298 South Korea Agricultural Chemicals Market, 2022 - 2033, USD Million
Table 299 South Korea Base Chemicals & Petrochemicals Market, 2022 - 2033, USD Million
Table 300 South Korea Specialty Chemicals Market, 2022 - 2033, USD Million
Table 301 South Korea AI In Chemicals Market Market by Type, 2022 - 2033, USD Million
Table 302 South Korea Hardware Market, 2022 - 2033, USD Million
Table 303 South Korea Services Market, 2022 - 2033, USD Million
Table 304 South Korea Software Market, 2022 - 2033, USD Million
Table 305 Singapore AI In Chemicals Market Market, 2022 - 2033, USD Million
Table 306 Singapore AI In Chemicals Market Market by Application, 2022 - 2033, USD Million
Table 307 Singapore New Material Innovation Market, 2022 - 2033, USD Million
Table 308 Singapore Operational Process Management Market, 2022 - 2033, USD Million
Table 309 Singapore Other Application Market, 2022 - 2033, USD Million
Table 310 Singapore Pricing Optimization Market, 2022 - 2033, USD Million
Table 311 Singapore Production Optimization Market, 2022 - 2033, USD Million
Table 312 Singapore Raw Material Demand Forecasting Market, 2022 - 2033, USD Million
Table 313 Singapore AI In Chemicals Market Market by End-use, 2022 - 2033, USD Million
Table 314 Singapore Agricultural Chemicals Market, 2022 - 2033, USD Million
Table 315 Singapore Base Chemicals & Petrochemicals Market, 2022 - 2033, USD Million
Table 316 Singapore Specialty Chemicals Market, 2022 - 2033, USD Million
Table 317 Singapore AI In Chemicals Market Market by Type, 2022 - 2033, USD Million
Table 318 Singapore Hardware Market, 2022 - 2033, USD Million
Table 319 Singapore Services Market, 2022 - 2033, USD Million
Table 320 Singapore Software Market, 2022 - 2033, USD Million
Table 321 Malaysia AI In Chemicals Market Market, 2022 - 2033, USD Million
Table 322 Malaysia AI In Chemicals Market Market by Application, 2022 - 2033, USD Million
Table 323 Malaysia New Material Innovation Market, 2022 - 2033, USD Million
Table 324 Malaysia Operational Process Management Market, 2022 - 2033, USD Million
Table 325 Malaysia Other Application Market, 2022 - 2033, USD Million
Table 326 Malaysia Pricing Optimization Market, 2022 - 2033, USD Million
Table 327 Malaysia Production Optimization Market, 2022 - 2033, USD Million
Table 328 Malaysia Raw Material Demand Forecasting Market, 2022 - 2033, USD Million
Table 329 Malaysia AI In Chemicals Market Market by End-use, 2022 - 2033, USD Million
Table 330 Malaysia Agricultural Chemicals Market, 2022 - 2033, USD Million
Table 331 Malaysia Base Chemicals & Petrochemicals Market, 2022 - 2033, USD Million
Table 332 Malaysia Specialty Chemicals Market, 2022 - 2033, USD Million
Table 333 Malaysia AI In Chemicals Market Market by Type, 2022 - 2033, USD Million
Table 334 Malaysia Hardware Market, 2022 - 2033, USD Million
Table 335 Malaysia Services Market, 2022 - 2033, USD Million
Table 336 Malaysia Software Market, 2022 - 2033, USD Million
Table 337 Rest of Asia Pacific AI In Chemicals Market Market, 2022 - 2033, USD Million
Table 338 Rest of Asia Pacific AI In Chemicals Market Market by Application, 2022 - 2033, USD Million
Table 339 Rest of Asia Pacific New Material Innovation Market, 2022 - 2033, USD Million
Table 340 Rest of Asia Pacific Operational Process Management Market, 2022 - 2033, USD Million
Table 341 Rest of Asia Pacific Other Application Market, 2022 - 2033, USD Million
Table 342 Rest of Asia Pacific Pricing Optimization Market, 2022 - 2033, USD Million
Table 343 Rest of Asia Pacific Production Optimization Market, 2022 - 2033, USD Million
Table 344 Rest of Asia Pacific Raw Material Demand Forecasting Market, 2022 - 2033, USD Million
Table 345 Rest of Asia Pacific AI In Chemicals Market Market by End-use, 2022 - 2033, USD Million
Table 346 Rest of Asia Pacific Agricultural Chemicals Market, 2022 - 2033, USD Million
Table 347 Rest of Asia Pacific Base Chemicals & Petrochemicals Market, 2022 - 2033, USD Million
Table 348 Rest of Asia Pacific Specialty Chemicals Market, 2022 - 2033, USD Million
Table 349 Rest of Asia Pacific AI In Chemicals Market Market by Type, 2022 - 2033, USD Million
Table 350 Rest of Asia Pacific Hardware Market, 2022 - 2033, USD Million
Table 351 Rest of Asia Pacific Services Market, 2022 - 2033, USD Million
Table 352 Rest of Asia Pacific Software Market, 2022 - 2033, USD Million
Table 353 LAMEA AI In Chemicals Market Market, 2022 - 2033, USD Million
Table 354 LAMEA AI In Chemicals Market Market by Application, 2022 - 2033, USD Million
Table 355 LAMEA New Material Innovation Market, 2022 - 2033, USD Million
Table 356 LAMEA Operational Process Management Market, 2022 - 2033, USD Million
Table 357 LAMEA Other Application Market, 2022 - 2033, USD Million
Table 358 LAMEA Pricing Optimization Market, 2022 - 2033, USD Million
Table 359 LAMEA Production Optimization Market, 2022 - 2033, USD Million
Table 360 LAMEA Raw Material Demand Forecasting Market, 2022 - 2033, USD Million
Table 361 LAMEA AI In Chemicals Market Market by End-use, 2022 - 2033, USD Million
Table 362 LAMEA Agricultural Chemicals Market, 2022 - 2033, USD Million
Table 363 LAMEA Base Chemicals & Petrochemicals Market, 2022 - 2033, USD Million
Table 364 LAMEA Specialty Chemicals Market, 2022 - 2033, USD Million
Table 365 LAMEA AI In Chemicals Market Market by Type, 2022 - 2033, USD Million
Table 366 LAMEA Hardware Market, 2022 - 2033, USD Million
Table 367 LAMEA Services Market, 2022 - 2033, USD Million
Table 368 LAMEA Software Market, 2022 - 2033, USD Million
Table 369 Brazil AI In Chemicals Market Market, 2022 - 2033, USD Million
Table 370 Brazil AI In Chemicals Market Market by Application, 2022 - 2033, USD Million
Table 371 Brazil New Material Innovation Market, 2022 - 2033, USD Million
Table 372 Brazil Operational Process Management Market, 2022 - 2033, USD Million
Table 373 Brazil Other Application Market, 2022 - 2033, USD Million
Table 374 Brazil Pricing Optimization Market, 2022 - 2033, USD Million
Table 375 Brazil Production Optimization Market, 2022 - 2033, USD Million
Table 376 Brazil Raw Material Demand Forecasting Market, 2022 - 2033, USD Million
Table 377 Brazil AI In Chemicals Market Market by End-use, 2022 - 2033, USD Million
Table 378 Brazil Agricultural Chemicals Market, 2022 - 2033, USD Million
Table 379 Brazil Base Chemicals & Petrochemicals Market, 2022 - 2033, USD Million
Table 380 Brazil Specialty Chemicals Market, 2022 - 2033, USD Million
Table 381 Brazil AI In Chemicals Market Market by Type, 2022 - 2033, USD Million
Table 382 Brazil Hardware Market, 2022 - 2033, USD Million
Table 383 Brazil Services Market, 2022 - 2033, USD Million
Table 384 Brazil Software Market, 2022 - 2033, USD Million
Table 385 Argentina AI In Chemicals Market Market, 2022 - 2033, USD Million
Table 386 Argentina AI In Chemicals Market Market by Application, 2022 - 2033, USD Million
Table 387 Argentina New Material Innovation Market, 2022 - 2033, USD Million
Table 388 Argentina Operational Process Management Market, 2022 - 2033, USD Million
Table 389 Argentina Other Application Market, 2022 - 2033, USD Million
Table 390 Argentina Pricing Optimization Market, 2022 - 2033, USD Million
Table 391 Argentina Production Optimization Market, 2022 - 2033, USD Million
Table 392 Argentina Raw Material Demand Forecasting Market, 2022 - 2033, USD Million
Table 393 Argentina AI In Chemicals Market Market by End-use, 2022 - 2033, USD Million
Table 394 Argentina Agricultural Chemicals Market, 2022 - 2033, USD Million
Table 395 Argentina Base Chemicals & Petrochemicals Market, 2022 - 2033, USD Million
Table 396 Argentina Specialty Chemicals Market, 2022 - 2033, USD Million
Table 397 Argentina AI In Chemicals Market Market by Type, 2022 - 2033, USD Million
Table 398 Argentina Hardware Market, 2022 - 2033, USD Million
Table 399 Argentina Services Market, 2022 - 2033, USD Million
Table 400 Argentina Software Market, 2022 - 2033, USD Million
Table 401 United Arab Emirates AI In Chemicals Market Market, 2022 - 2033, USD Million
Table 402 United Arab Emirates AI In Chemicals Market Market by Application, 2022 - 2033, USD Million
Table 403 United Arab Emirates New Material Innovation Market, 2022 - 2033, USD Million
Table 404 United Arab Emirates Operational Process Management Market, 2022 - 2033, USD Million
Table 405 United Arab Emirates Other Application Market, 2022 - 2033, USD Million
Table 406 United Arab Emirates Pricing Optimization Market, 2022 - 2033, USD Million
Table 407 United Arab Emirates Production Optimization Market, 2022 - 2033, USD Million
Table 408 United Arab Emirates Raw Material Demand Forecasting Market, 2022 - 2033, USD Million
Table 409 United Arab Emirates AI In Chemicals Market Market by End-use, 2022 - 2033, USD Million
Table 410 United Arab Emirates Agricultural Chemicals Market, 2022 - 2033, USD Million
Table 411 United Arab Emirates Base Chemicals & Petrochemicals Market, 2022 - 2033, USD Million
Table 412 United Arab Emirates Specialty Chemicals Market, 2022 - 2033, USD Million
Table 413 United Arab Emirates AI In Chemicals Market Market by Type, 2022 - 2033, USD Million
Table 414 United Arab Emirates Hardware Market, 2022 - 2033, USD Million
Table 415 United Arab Emirates Services Market, 2022 - 2033, USD Million
Table 416 United Arab Emirates Software Market, 2022 - 2033, USD Million
Table 417 Saudi Arabia AI In Chemicals Market Market, 2022 - 2033, USD Million
Table 418 Saudi Arabia AI In Chemicals Market Market by Application, 2022 - 2033, USD Million
Table 419 Saudi Arabia New Material Innovation Market, 2022 - 2033, USD Million
Table 420 Saudi Arabia Operational Process Management Market, 2022 - 2033, USD Million
Table 421 Saudi Arabia Other Application Market, 2022 - 2033, USD Million
Table 422 Saudi Arabia Pricing Optimization Market, 2022 - 2033, USD Million
Table 423 Saudi Arabia Production Optimization Market, 2022 - 2033, USD Million
Table 424 Saudi Arabia Raw Material Demand Forecasting Market, 2022 - 2033, USD Million
Table 425 Saudi Arabia AI In Chemicals Market Market by End-use, 2022 - 2033, USD Million
Table 426 Saudi Arabia Agricultural Chemicals Market, 2022 - 2033, USD Million
Table 427 Saudi Arabia Base Chemicals & Petrochemicals Market, 2022 - 2033, USD Million
Table 428 Saudi Arabia Specialty Chemicals Market, 2022 - 2033, USD Million
Table 429 Saudi Arabia AI In Chemicals Market Market by Type, 2022 - 2033, USD Million
Table 430 Saudi Arabia Hardware Market, 2022 - 2033, USD Million
Table 431 Saudi Arabia Services Market, 2022 - 2033, USD Million
Table 432 Saudi Arabia Software Market, 2022 - 2033, USD Million
Table 433 South Africa AI In Chemicals Market Market, 2022 - 2033, USD Million
Table 434 South Africa AI In Chemicals Market Market by Application, 2022 - 2033, USD Million
Table 435 South Africa New Material Innovation Market, 2022 - 2033, USD Million
Table 436 South Africa Operational Process Management Market, 2022 - 2033, USD Million
Table 437 South Africa Other Application Market, 2022 - 2033, USD Million
Table 438 South Africa Pricing Optimization Market, 2022 - 2033, USD Million
Table 439 South Africa Production Optimization Market, 2022 - 2033, USD Million
Table 440 South Africa Raw Material Demand Forecasting Market, 2022 - 2033, USD Million
Table 441 South Africa AI In Chemicals Market Market by End-use, 2022 - 2033, USD Million
Table 442 South Africa Agricultural Chemicals Market, 2022 - 2033, USD Million
Table 443 South Africa Base Chemicals & Petrochemicals Market, 2022 - 2033, USD Million
Table 444 South Africa Specialty Chemicals Market, 2022 - 2033, USD Million
Table 445 South Africa AI In Chemicals Market Market by Type, 2022 - 2033, USD Million
Table 446 South Africa Hardware Market, 2022 - 2033, USD Million
Table 447 South Africa Services Market, 2022 - 2033, USD Million
Table 448 South Africa Software Market, 2022 - 2033, USD Million
Table 449 Nigeria AI In Chemicals Market Market, 2022 - 2033, USD Million
Table 450 Nigeria AI In Chemicals Market Market by Application, 2022 - 2033, USD Million
Table 451 Nigeria New Material Innovation Market, 2022 - 2033, USD Million
Table 452 Nigeria Operational Process Management Market, 2022 - 2033, USD Million
Table 453 Nigeria Other Application Market, 2022 - 2033, USD Million
Table 454 Nigeria Pricing Optimization Market, 2022 - 2033, USD Million
Table 455 Nigeria Production Optimization Market, 2022 - 2033, USD Million
Table 456 Nigeria Raw Material Demand Forecasting Market, 2022 - 2033, USD Million
Table 457 Nigeria AI In Chemicals Market Market by End-use, 2022 - 2033, USD Million
Table 458 Nigeria Agricultural Chemicals Market, 2022 - 2033, USD Million
Table 459 Nigeria Base Chemicals & Petrochemicals Market, 2022 - 2033, USD Million
Table 460 Nigeria Specialty Chemicals Market, 2022 - 2033, USD Million
Table 461 Nigeria AI In Chemicals Market Market by Type, 2022 - 2033, USD Million
Table 462 Nigeria Hardware Market, 2022 - 2033, USD Million
Table 463 Nigeria Services Market, 2022 - 2033, USD Million
Table 464 Nigeria Software Market, 2022 - 2033, USD Million
Table 465 Rest of LAMEA AI In Chemicals Market Market, 2022 - 2033, USD Million
Table 466 Rest of LAMEA AI In Chemicals Market Market by Application, 2022 - 2033, USD Million
Table 467 Rest of LAMEA New Material Innovation Market, 2022 - 2033, USD Million
Table 468 Rest of LAMEA Operational Process Management Market, 2022 - 2033, USD Million
Table 469 Rest of LAMEA Other Application Market, 2022 - 2033, USD Million
Table 470 Rest of LAMEA Pricing Optimization Market, 2022 - 2033, USD Million
Table 471 Rest of LAMEA Production Optimization Market, 2022 - 2033, USD Million
Table 472 Rest of LAMEA Raw Material Demand Forecasting Market, 2022 - 2033, USD Million
Table 473 Rest of LAMEA AI In Chemicals Market Market by End-use, 2022 - 2033, USD Million
Table 474 Rest of LAMEA Agricultural Chemicals Market, 2022 - 2033, USD Million
Table 475 Rest of LAMEA Base Chemicals & Petrochemicals Market, 2022 - 2033, USD Million
Table 476 Rest of LAMEA Specialty Chemicals Market, 2022 - 2033, USD Million
Table 477 Rest of LAMEA AI In Chemicals Market Market by Type, 2022 - 2033, USD Million
Table 478 Rest of LAMEA Hardware Market, 2022 - 2033, USD Million
Table 479 Rest of LAMEA Services Market, 2022 - 2033, USD Million
Table 480 Rest of LAMEA Software Market, 2022 - 2033, USD Million
List of Figures
FIG 1 Methodology for the research
FIG 2 Key Factors Impacting Market
FIG 3 Market Consolidation
FIG 4 Key Customer Criteria
FIG 5 Product Life Cycle
FIG 6 Value Chain Analysis
FIG 7 Market Share Analysis FIG 8 Global AI In Chemicals Market Market, 2022 - 2033, USD Million
FIG 9 Global AI In Chemicals Market Market by Application, 2022 - 2033, USD Million
FIG 10 Global New Material Innovation Market, 2022 - 2033, USD Million
FIG 11 Global Operational Process Management Market, 2022 - 2033, USD Million
FIG 12 Global Other Application Market, 2022 - 2033, USD Million
FIG 13 Global Pricing Optimization Market, 2022 - 2033, USD Million
FIG 14 Global Production Optimization Market, 2022 - 2033, USD Million
FIG 15 Global Raw Material Demand Forecasting Market, 2022 - 2033, USD Million
FIG 16 Global AI In Chemicals Market Market by End-use, 2022 - 2033, USD Million
FIG 17 Global Agricultural Chemicals Market, 2022 - 2033, USD Million
FIG 18 Global Base Chemicals & Petrochemicals Market, 2022 - 2033, USD Million
FIG 19 Global Specialty Chemicals Market, 2022 - 2033, USD Million
FIG 20 Global AI In Chemicals Market Market by Type, 2022 - 2033, USD Million
FIG 21 Global Hardware Market, 2022 - 2033, USD Million
FIG 22 Global Services Market, 2022 - 2033, USD Million
FIG 23 Global Software Market, 2022 - 2033, USD Million
FIG 24 North America AI In Chemicals Market Market, 2022 - 2033, USD Million
FIG 25 North America AI In Chemicals Market Market by Application, 2022 - 2033, USD Million
FIG 26 North America New Material Innovation Market, 2022 - 2033, USD Million
FIG 27 North America Operational Process Management Market, 2022 - 2033, USD Million
FIG 28 North America Other Application Market, 2022 - 2033, USD Million
FIG 29 North America Pricing Optimization Market, 2022 - 2033, USD Million
FIG 30 North America Production Optimization Market, 2022 - 2033, USD Million
FIG 31 North America Raw Material Demand Forecasting Market, 2022 - 2033, USD Million
FIG 32 North America AI In Chemicals Market Market by End-use, 2022 - 2033, USD Million
FIG 33 North America Agricultural Chemicals Market, 2022 - 2033, USD Million
FIG 34 North America Base Chemicals & Petrochemicals Market, 2022 - 2033, USD Million
FIG 35 North America Specialty Chemicals Market, 2022 - 2033, USD Million
FIG 36 North America AI In Chemicals Market Market by Type, 2022 - 2033, USD Million
FIG 37 North America Hardware Market, 2022 - 2033, USD Million
FIG 38 North America Services Market, 2022 - 2033, USD Million
FIG 39 North America Software Market, 2022 - 2033, USD Million
FIG 40 Europe AI In Chemicals Market Market, 2022 - 2033, USD Million
FIG 41 Europe AI In Chemicals Market Market by Application, 2022 - 2033, USD Million
FIG 42 Europe New Material Innovation Market, 2022 - 2033, USD Million
FIG 43 Europe Operational Process Management Market, 2022 - 2033, USD Million
FIG 44 Europe Other Application Market, 2022 - 2033, USD Million
FIG 45 Europe Pricing Optimization Market, 2022 - 2033, USD Million
FIG 46 Europe Production Optimization Market, 2022 - 2033, USD Million
FIG 47 Europe Raw Material Demand Forecasting Market, 2022 - 2033, USD Million
FIG 48 Europe AI In Chemicals Market Market by End-use, 2022 - 2033, USD Million
FIG 49 Europe Agricultural Chemicals Market, 2022 - 2033, USD Million
FIG 50 Europe Base Chemicals & Petrochemicals Market, 2022 - 2033, USD Million
FIG 51 Europe Specialty Chemicals Market, 2022 - 2033, USD Million
FIG 52 Europe AI In Chemicals Market Market by Type, 2022 - 2033, USD Million
FIG 53 Europe Hardware Market, 2022 - 2033, USD Million
FIG 54 Europe Services Market, 2022 - 2033, USD Million
FIG 55 Europe Software Market, 2022 - 2033, USD Million
FIG 56 Asia Pacific AI In Chemicals Market Market, 2022 - 2033, USD Million
FIG 57 Asia Pacific AI In Chemicals Market Market by Application, 2022 - 2033, USD Million
FIG 58 Asia Pacific New Material Innovation Market, 2022 - 2033, USD Million
FIG 59 Asia Pacific Operational Process Management Market, 2022 - 2033, USD Million
FIG 60 Asia Pacific Other Application Market, 2022 - 2033, USD Million
FIG 61 Asia Pacific Pricing Optimization Market, 2022 - 2033, USD Million
FIG 62 Asia Pacific Production Optimization Market, 2022 - 2033, USD Million
FIG 63 Asia Pacific Raw Material Demand Forecasting Market, 2022 - 2033, USD Million
FIG 64 Asia Pacific AI In Chemicals Market Market by End-use, 2022 - 2033, USD Million
FIG 65 Asia Pacific Agricultural Chemicals Market, 2022 - 2033, USD Million
FIG 66 Asia Pacific Base Chemicals & Petrochemicals Market, 2022 - 2033, USD Million
FIG 67 Asia Pacific Specialty Chemicals Market, 2022 - 2033, USD Million
FIG 68 Asia Pacific AI In Chemicals Market Market by Type, 2022 - 2033, USD Million
FIG 69 Asia Pacific Hardware Market, 2022 - 2033, USD Million
FIG 70 Asia Pacific Services Market, 2022 - 2033, USD Million
FIG 71 Asia Pacific Software Market, 2022 - 2033, USD Million
FIG 72 LAMEA AI In Chemicals Market Market, 2022 - 2033, USD Million
FIG 73 LAMEA AI In Chemicals Market Market by Application, 2022 - 2033, USD Million
FIG 74 LAMEA New Material Innovation Market, 2022 - 2033, USD Million
FIG 75 LAMEA Operational Process Management Market, 2022 - 2033, USD Million
FIG 76 LAMEA Other Application Market, 2022 - 2033, USD Million
FIG 77 LAMEA Pricing Optimization Market, 2022 - 2033, USD Million
FIG 78 LAMEA Production Optimization Market, 2022 - 2033, USD Million
FIG 79 LAMEA Raw Material Demand Forecasting Market, 2022 - 2033, USD Million
FIG 80 LAMEA AI In Chemicals Market Market by End-use, 2022 - 2033, USD Million
FIG 81 LAMEA Agricultural Chemicals Market, 2022 - 2033, USD Million
FIG 82 LAMEA Base Chemicals & Petrochemicals Market, 2022 - 2033, USD Million
FIG 83 LAMEA Specialty Chemicals Market, 2022 - 2033, USD Million
FIG 84 LAMEA AI In Chemicals Market Market by Type, 2022 - 2033, USD Million
FIG 85 LAMEA Hardware Market, 2022 - 2033, USD Million
FIG 86 LAMEA Services Market, 2022 - 2033, USD Million
FIG 87 LAMEA Software Market, 2022 - 2033, USD Million