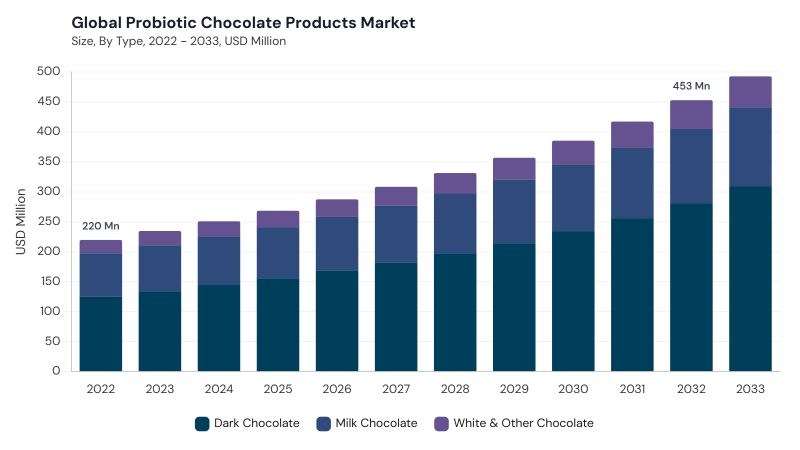
“Global Probiotic Chocolate Products Market to reach a market value of USD 492.72 Million by 2033 growing at a CAGR of 8.0%”
The Global Probiotic Chocolate Products Market is expected to reach USD 492.7 million by 2033, growing at a CAGR of 8.0% during 2026–2033. This report examines probiotic chocolate market size, growth trends, and opportunities by chocolate type, product form, probiotic type, distribution channel, and geography.
Probiotic chocolate products are finished chocolates formulated with intentionally added live microorganisms and marketed around a probiotic proposition. Formats include probiotic chocolate bars, bites, balls, and qualifying filled chocolates. The category brings a functional-food proposition to familiar confectionery, with commercial success depending on taste, portioning, and a clearly specified formulation. Probiotic dark chocolate is one relevant format. Ordinary dark chocolate is not automatically probiotic: strain identity, viable count, serving size, product stability, and evidence supporting the intended benefit all matter. Probiotic drinks, gummies, capsules, and chocolate-flavored granola are separate product categories.
Probiotic chocolate gives manufacturers a familiar confectionery format through which to explain a defined functional proposition. Buyers can compare it with other probiotic foods while considering taste, ingredients, portion size, and price. The commercial opportunity depends on an enjoyable product and a formulation that customers can understand. Information about the culture, serving, and storage can help distinguish a probiotic chocolate bar from conventional chocolate. Cocoa content alone does not establish a probiotic benefit, and a product’s positioning should reflect the evidence relevant to its formulation.
Bars, wrapped pieces, and balls allow brands to organize probiotic chocolate around identifiable portions. The relationship between a piece, a serving, and a stated culture count needs to be clear when several portions share one pack. Bouchard’s published range illustrates individually wrapped probiotic dark chocolate. For manufacturers, repeat purchase depends on consistent flavor and texture as well as clear product information. Portion control also gives buyers a practical basis for comparing product cost and nutrition without assuming that all pieces or bars deliver equivalent formulations.
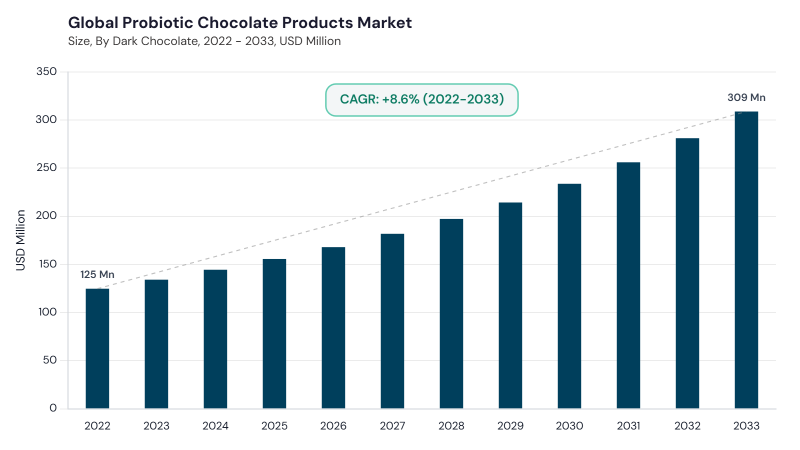
Based on Type, the market is segmented into Dark Chocolate, Milk Chocolate, White & Other Chocolate. Dark Chocolate dominated in 2025 and is projected to reach USD 308.9 million by 2033, growing at a CAGR of 9.1%. Dark Chocolate is expected to record the highest CAGR of 9.1% during the forecast period.
Probiotic dark chocolate combines a cocoa-led flavor profile with an added-culture proposition, as illustrated by Bouchard’s range. Milk chocolate and white and other chocolate formulations provide different sensory options within the supplied segmentation. Buyers may compare sweetness, cocoa character, ingredients, and serving size alongside the probiotic information. Each formulation requires its own assessment of culture compatibility and shelf-life performance; results established for one chocolate matrix should not be assumed for another. A peer-reviewed study of white, milk, and dark chocolate demonstrates why strain, storage, and formulation conditions need to be evaluated together.
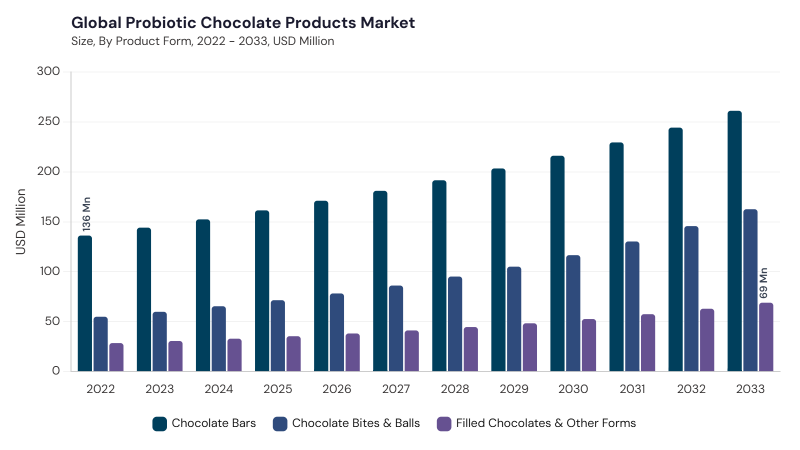
Based on Product Form, the market is segmented into Chocolate Bars, Chocolate Bites & Balls, Filled Chocolates & Other Forms. Chocolate Bars dominated in 2025 and is projected to reach USD 261.1 million by 2033, growing at a CAGR of 6.2%. Chocolate Bites & Balls is expected to record the highest CAGR of 11.0% during the forecast period.
Probiotic chocolate bars provide a familiar format for single or divided servings. Chocolate bites and balls offer smaller units that can be sold individually or in multipiece packs. Filled chocolates add formulation complexity because the culture may be incorporated into the shell, filling, or another component. Across forms, the amount consumed needs to correspond with the label’s serving information. Clear portion definitions and consistent manufacture help buyers compare products and support quality control as suppliers expand their assortments.
Based on Probiotic Type, the market is segmented into Lactobacillus-Based, Bifidobacterium-Based, Bacillus-Based, Mixed & Other Probiotics. Lactobacillus-Based dominated in 2025 and is projected to reach USD 157.7 million by 2033, growing at a CAGR of 6.1%. Mixed & Other Probiotics is expected to record the highest CAGR of 10.6% during the forecast period.
The supplied segmentation distinguishes Lactobacillus-Based, Bifidobacterium-Based, Bacillus-Based, and Mixed & Other Probiotics. These broad categories describe the formulation mix, but genus names alone do not establish a specific product benefit. Strain identification and the amount delivered are relevant when evaluating probiotic evidence. Bouchard’s identification of a Bifidobacterium strain illustrates more detailed culture disclosure. Mixed formulations require attention to the identity and quantity of the included organisms rather than treating the number of cultures as a sufficient measure of quality.
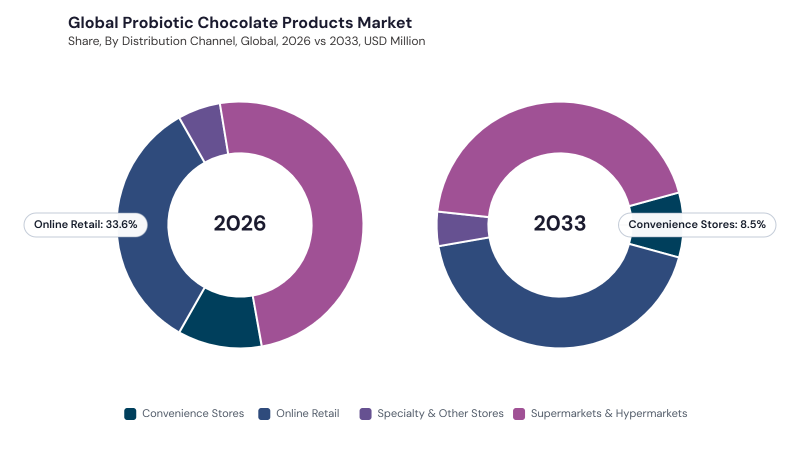
Based on Distribution Channel, the market is segmented into Supermarkets & Hypermarkets, Online Retail, Convenience Stores, Specialty & Other Stores. Supermarkets & Hypermarkets dominated in 2025 and is projected to reach USD 216.8 million by 2033, growing at a CAGR of 6.1%. Online Retail is expected to record the highest CAGR of 11.9% during the forecast period.
Supermarkets and hypermarkets place probiotic chocolate alongside familiar confectionery and related food choices. Online retail gives suppliers space to explain ingredients, probiotic cultures, serving sizes, and storage instructions before purchase. Convenience stores emphasize accessible formats, while specialty and other stores can address more specific product preferences. Bouchard’s online range illustrates direct product discovery for probiotic dark chocolate. Across channels, clear pack information and consistent handling requirements help connect the consumer proposition with the product delivered.
Free Valuable Insights: Probiotic Chocolate Products Market Size to reach $492.7 Million by 2033
Region-wise, the Probiotic Chocolate Products Market is analyzed across North America, Europe, Asia Pacific, LAMEA. North America led in 2025 and is projected to reach USD 162.6 million by 2033, growing at a CAGR of 6.1%. Europe is projected to grow at a CAGR of 6.6%. Asia Pacific is projected to grow at a CAGR of 11.7%. LAMEA is projected to grow at a CAGR of 10.9%.
Regional opportunities depend on chocolate purchasing habits, acceptance of functional-food propositions, price expectations, and distribution reach. Suppliers need to adapt pack formats and product explanations to local buyers while maintaining consistent formulation information. North America, Europe, Asia Pacific, and LAMEA differ in retail structures and purchasing conditions, making local distribution partnerships and suitable pack pricing relevant to expansion. Long-term demand depends on repeat purchasing and consistent product delivery as well as initial interest in probiotic foods.
By Type
By Product Form
By Probiotic Type
By Distribution Channel
By Geography
| Report Attribute | Details |
|---|---|
| Market size value in 2026 | USD 287.5 million |
| Market size forecast in 2033 | USD 492.7 million |
| Base Year | 2025 |
| Historical Period | 2022 to 2024 |
| Forecast Period | 2026 to 2033 |
| Revenue Growth Rate | CAGR of 8.0% from 2026 to 2033 |
| Number of Tables | 570 |
| Number of Figures | 95 |
| Report Coverage | Market Trends, Revenue Estimation and Forecast, Segmentation Analysis, Regional and Country Breakdown, Competitive Landscape |
| Segments Covered | Type, Product Form, Probiotic Type, Distribution Channel and Geography |
| Country Scope |
|
By Geography
Expected to reach USD 492.7 million by 2033, growing at 8.0% CAGR during the forecast period (2026-2033).
Dark Chocolate leads, achieving a market value of USD 308.9 million by 2033.
Top companies include Cisco, IBM, Microsoft, and Google.
Chocolate Bars lead, reaching a market value of USD 261.1 million by 2033.
Interest in Functional Chocolate Formats and Convenience of Portions drive market growth.
Lactobacillus-Based products lead with a market value of USD 157.7 million by 2033.
Our team of dedicated experts can provide you with attractive expansion opportunities for your business.