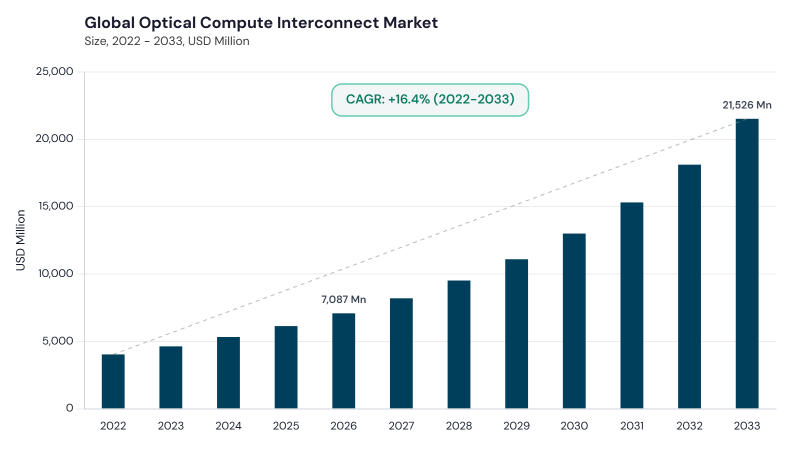
“Global Optical Compute Interconnect Market to reach a market value of USD 21525.62 Million by 2033 growing at a CAGR of 17.2%”
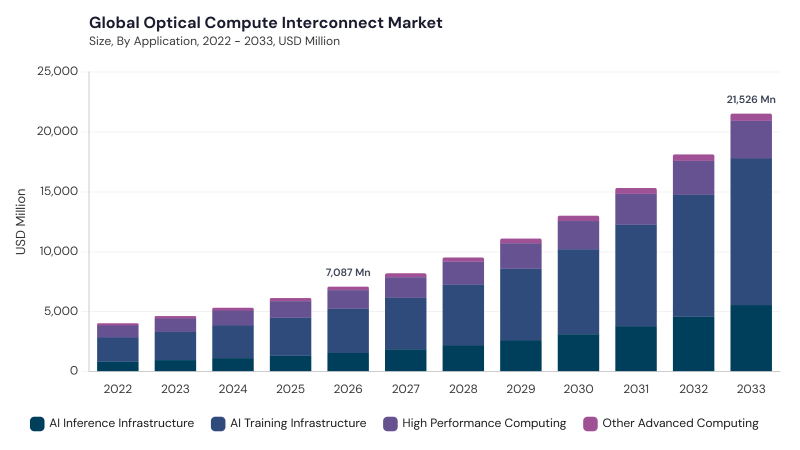
The Global Optical Compute Interconnect Market is expected to reach USD 21.5 billion by 2033, growing at a CAGR of 17.2% during (2026 - 2033).
Optical compute interconnects use light to move data among computing devices, boards, and racks. The market includes optical engines and transceivers, photonic integrated circuits, connectivity components, and supporting interface electronics used in advanced computing systems. It covers the transport of information rather than computation performed optically. General telecommunications equipment, complete servers, and electrical-only networking require separate attribution unless their eligible optical-interconnect contribution is explicitly included. Product boundaries matter because a photonic circuit can be sold independently or embedded within a higher-value module.
AI systems distribute computation across accelerators and other resources, creating requirements for communication among devices and network nodes. The usefulness of additional compute capacity depends partly on whether data can move efficiently through the chosen topology. NVIDIA’s 2025 photonics-switch announcement connects its optical networking development with AI infrastructure, illustrating the system-level focus on communication. The market driver is the need to support useful workload performance as systems expand. Optical links can address particular bandwidth and reach constraints, but customers must establish where those constraints occur. More nominal optical capacity does not independently guarantee better application performance.
As signaling requirements increase, electrical paths between a host chip and an optical interface can demand more careful signal conditioning and consume additional power. Moving optical conversion closer to the host is one way to change that design balance. Broadcom’s Bailly platform integrates optical engines with an Ethernet switch chip, demonstrating a co-packaged architecture. This supports demand for alternatives to long board-level electrical connections. The commercial case depends on the complete link, including optical conversion, lasers, interface electronics, cooling, and packaging. Suppliers need to demonstrate system benefits under realistic conditions rather than infer them solely from shorter electrical trace length.
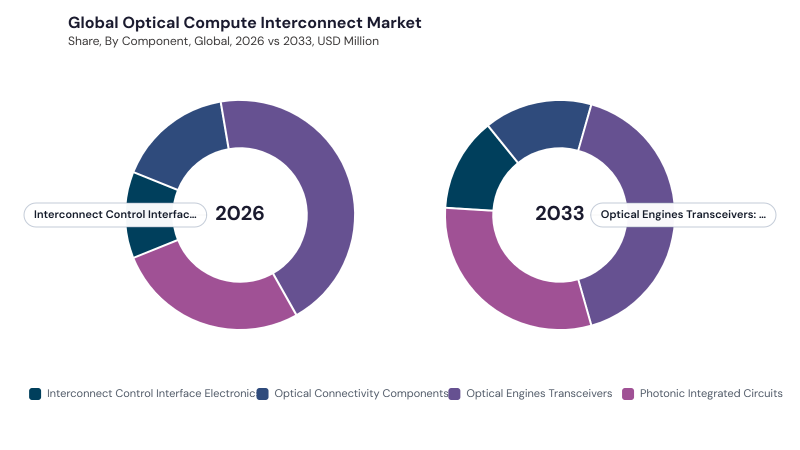
Based on Component, the market is segmented into Optical Engines & Transceivers, Photonic Integrated Circuits, Optical Connectivity Components, Interconnect Control & Interface Electronics. Optical Engines & Transceivers dominated in 2025 and is projected to reach USD 8.9 billion by 2033, growing at a CAGR of 15.9%. Photonic Integrated Circuits is expected to record the highest CAGR of 19.2% during the forecast period.
Based on Integration Technology, the market is segmented into Pluggable Optics, Near-Packaged Optics, Co-Packaged Optics, On-Package & Chiplet-Level Optical I/O. Pluggable Optics dominated in 2025 and is projected to reach USD 9.9 billion by 2033, growing at a CAGR of 15.0%. On-Package & Chiplet-Level Optical I/O is expected to record the highest CAGR of 21.3% during the forecast period.
Based on Interconnect Level, the market is segmented into Chip-to-Chip, Board-to-Board, Rack-to-Rack. Rack-to-Rack dominated in 2025 and is projected to reach USD 9.2 billion by 2033, growing at a CAGR of 15.7%. Chip-to-Chip is expected to record the highest CAGR of 19.7% during the forecast period.
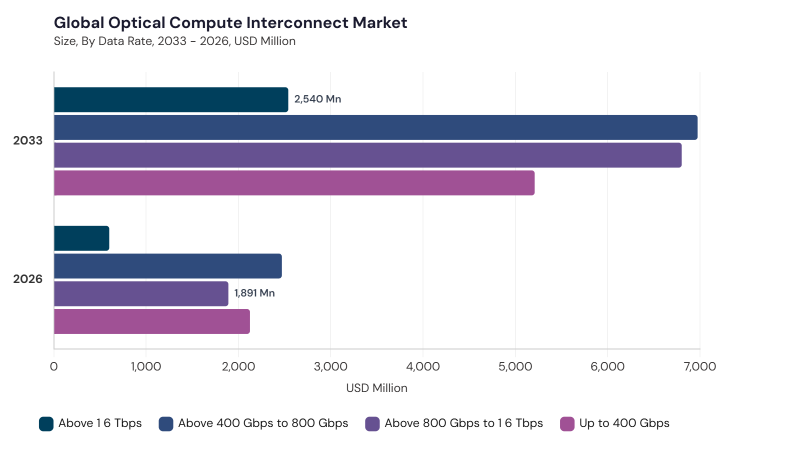
Based on Data Rate, the market is segmented into Up to 400 Gbps, Above 400 Gbps to 800 Gbps, Above 800 Gbps to 1.6 Tbps, Above 1.6 Tbps. Above 400 Gbps to 800 Gbps dominated in 2025 and is projected to reach USD 7.0 billion by 2033, growing at a CAGR of 16.0%. Above 1.6 Tbps is expected to record the highest CAGR of 22.9% during the forecast period.
Based on Application, the market is segmented into AI Training Infrastructure, AI Inference Infrastructure, High-Performance Computing, Other Advanced Computing. AI Training Infrastructure dominated in 2025 and is projected to reach USD 12.2 billion by 2033, growing at a CAGR of 18.7%. AI Inference Infrastructure is expected to record the highest CAGR of 20.0% during the forecast period.
Based on End User, the market is segmented into Hyperscale Cloud Providers, AI Infrastructure Providers, Enterprises & Research Institutions, Government & Defense. Hyperscale Cloud Providers dominated in 2025 and is projected to reach USD 11.1 billion by 2033, growing at a CAGR of 18.4%. AI Infrastructure Providers is expected to record the highest CAGR of 19.2% during the forecast period.
Free Valuable Insights: Optical Compute Interconnect Market Size to reach $21.5 Billion by 2033
Region-wise, the Optical Compute Interconnect Market is analyzed across North America, Europe, Asia Pacific, LAMEA. Asia Pacific led in 2025 and is projected to reach USD 11.1 billion by 2033, growing at a CAGR of 18.6%. North America is projected to grow at a CAGR of 15.9%. Europe is projected to grow at a CAGR of 15.0%. LAMEA is projected to grow at a CAGR of 18.4%.
Global Optical Compute Interconnect Market Report Segmentation
By Component
By Integration Technology
By Interconnect Level
By Data Rate
By Application
By End User
By Geography
| Report Attribute | Details |
|---|---|
| Market size value in 2026 | USD 7.1 billion |
| Market size forecast in 2033 | USD 21.5 billion |
| Base Year | 2025 |
| Historical Period | 2022 to 2024 |
| Forecast Period | 2026 to 2033 |
| Revenue Growth Rate | CAGR of 17.2% from 2026 to 2033 |
| Number of Tables | 900 |
| Number of Figures | 150 |
| Report Coverage | Market Trends, Revenue Estimation and Forecast, Segmentation Analysis, Regional and Country Breakdown, Competitive Landscape |
| Segments Covered | Component, Integration Technology, Interconnect Level, Data Rate, Application, End User and Geography |
| Country Scope |
|
By Geography
The market is valued at USD 7.1 billion in 2026, with a growth to USD 21.5 billion by 2033.
Optical Engines & Transceivers lead, projected to reach USD 8.9 billion by 2033.
Top companies include Cisco, IBM, Microsoft, and Google.
Asia Pacific leads with a market value of USD 11.1 billion by 2033.
Key drivers include communication needs of AI systems and demand for higher bandwidth in limited spaces.
The Above 400 Gbps to 800 Gbps segment leads, reaching USD 7.0 billion by 2033.
Our team of dedicated experts can provide you with attractive expansion opportunities for your business.