North America Patch Management Market Size, Share & Industry Analysis Report By Solution (Software, and Services), By Deployment (Cloud, and On-Premises), By Enterprise Size (Large Enterprise, and SMEs), By Vertical (BFSI, and IT & Telecommunication), By Country Outlook and Forecast, 2026 - 2033
Published Date : 25-Oct-2026 |
Pages: 210 |
Report Format: PDF + Excel |
COVID-19 Impact on the North America Patch Management Market
The North America Patch Management Market is expected to reach USD 852.9 million by 2032, growing at a CAGR of 10.9% during (2026 - 2033).
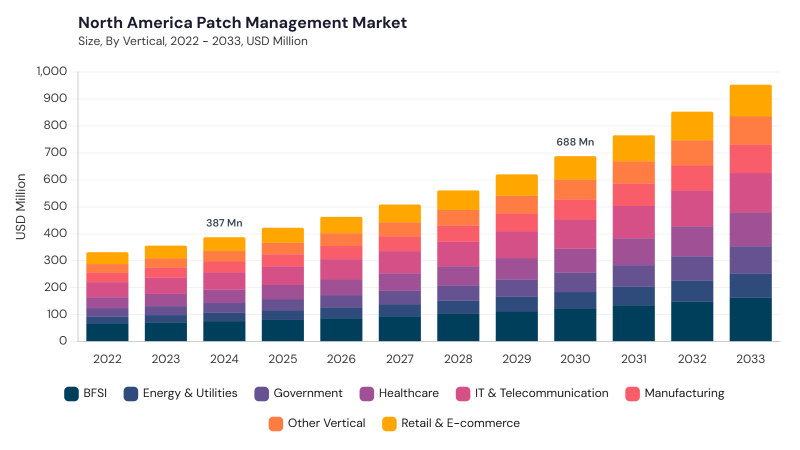
The North America Patch Management Market evolved from manual, fragmented software-update practices toward centralized and automated vulnerability-remediation platforms capable of managing increasingly complex enterprise IT environments. Growing cybersecurity threats, regulatory requirements, cloud adoption, and expansion of mobile and distributed endpoints accelerated the shift from script-based patching to risk-aware orchestration supported by analytics and automation. Integration with vulnerability management, endpoint security, threat intelligence, and IT service-management platforms further expanded the strategic role of patching. The market now reflects mature demand for continuous monitoring, automated deployment, compliance reporting, and scalable patch management across on-premises, cloud, hybrid, IoT, and edge environments.
AI-driven prioritization, Zero Trust adoption, cloud migration, and increasingly complex endpoint environments are shaping current market development. Organizations are adopting machine learning, automated vulnerability assessment, real-time risk scoring, predictive analytics, and policy-driven remediation to reduce exposure windows and administrative effort. Growing use of hybrid IT, remote endpoints, IoT devices, and edge computing is increasing demand for centralized platforms capable of managing heterogeneous environments at scale. Regulatory compliance, cybersecurity insurance expectations, and enterprise governance requirements are also strengthening auditability and reporting needs. However, high deployment costs, fragmented infrastructures, legacy systems, patch compatibility risks, integration complexity, and resource constraints continue to influence adoption.
Solution Outlook
Based on Solution, the market is segmented into Software and Services. The Software market dominated the North America Patch Management Market by Solution in 2025, and would continue to be a dominant market till 2033; thereby, achieving a market value of USD 532.8 million by 2032, growing at a CAGR of 10.4 % during the forecast period. The Services market is expected to witness a CAGR of 11.6% during (2026 - 2033).
Software supports vulnerability assessment, patch prioritization, automated deployment, compliance tracking, rollback, reporting, and integration with endpoint, asset, and security-management platforms. AI and machine learning increasingly enhance risk-based prioritization and reduce manual intervention across complex infrastructures. Services include vulnerability assessment, implementation, managed patching, consulting, deployment oversight, monitoring, and compliance support for organizations with limited internal cybersecurity resources. Skills shortages, growing infrastructure complexity, managed security adoption, and hybrid environments are strengthening demand for external expertise, particularly among SMEs and regulated industries.
Deployment Outlook
Based on Deployment, the market is segmented into Cloud and On-Premises. The Cloud market dominated the North America Patch Management Market by Deployment in 2025, and would continue to be a dominant market till 2033; thereby, achieving a market value of USD 500.7 million by 2032, growing at a CAGR of 11 % during the forecast period. Additionally, The On-Premises market is expected to witness highest CAGR of 10.7% during (2026 - 2033).
Cloud deployment supports scalable endpoint management, remote patching, automated updates, centralized visibility, subscription-based delivery, and integration with distributed IT environments. It is particularly suited to organizations managing geographically dispersed assets and dynamic workloads across hybrid and multi-cloud architectures. On-Premises deployment remains important for organizations prioritizing direct infrastructure control, data residency, internal security governance, and highly customized patching policies. Government agencies, financial institutions, defense-related environments, and other sensitive operations continue to use locally managed solutions where external connectivity, third-party dependencies, or cloud adoption may be restricted.
Enterprise Size Outlook
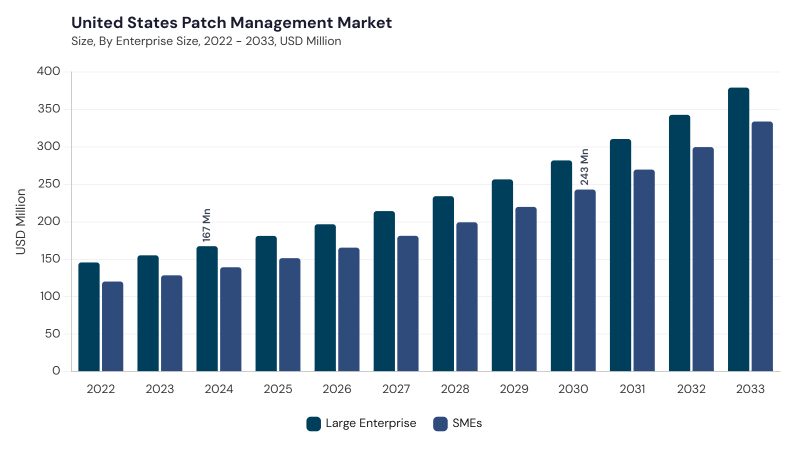
Based on Enterprise Size, the market is segmented into Large Enterprise and SMEs. Large Enterprise commanded the dominant position in the North America Patch Management Market by Enterprise Size in 2025, underpinned by extensive endpoint populations, heterogeneous IT environments, stringent compliance requirements, and sophisticated cybersecurity programs.
Large Enterprise environments require scalable automation, vulnerability prioritization, SIEM and endpoint-security integration, hybrid-cloud support, comprehensive reporting, and coordinated patching across multiple business units and geographies. These organizations increasingly integrate patch management with broader asset, threat, and vulnerability-management ecosystems. SMEs prioritize affordability, ease of deployment, simplified administration, automated scheduling, and cloud-based delivery due to smaller IT teams and constrained security budgets. Growing cyberattacks against smaller organizations, SaaS adoption, and increased awareness of software vulnerabilities are supporting greater uptake of centralized and managed patching solutions among SMEs.
Vertical Outlook
Based on Vertical, the market is segmented into BFSI, IT & Telecommunication, Retail & E-commerce, Healthcare, Manufacturing, Government, Energy & Utilities, and Other Vertical. BFSI emphasizes rapid remediation, regulatory auditability, risk-based prioritization, and protection of banking and transaction systems, while IT & Telecommunication requires frequent patching across servers, networks, cloud infrastructure, telecom platforms, and edge environments. Retail & E-commerce focuses on POS systems, digital storefronts, payment infrastructure, and customer data protection, whereas Healthcare prioritizes EHR platforms, medical devices, clinical networks, and regulatory compliance.
Manufacturing increasingly addresses IT-OT convergence, SCADA, robotics, and industrial control vulnerabilities, while Government emphasizes secure patching across legacy systems, cloud infrastructure, and public-sector networks. Energy & Utilities requires controlled remediation across critical infrastructure and operational systems, while Other Vertical includes education, media, transportation, professional services, and other digitally dependent sectors adopting centralized vulnerability-management practices.
Free Valuable Insights: The Global Patch Management Market will hit USD 2710.5 Million billion by 2033, at a CAGR of 11.6%
Country Outlook
Based on Country, the market is segmented into US, Canada, Mexico, and Rest of North America. The US market dominated the North America Patch Management Market by Country in 2025, and would continue to be a dominant market till 2033; thereby, achieving a market value of USD 642.6 million by 2032, growing at a CAGR of 10.2 % during the forecast period. The Canada market is expected to witness a CAGR of 13.2% during (2026 - 2033). Additionally, The Mexico market is expected to witness a CAGR of 12.6% during (2026 - 2033).
Across North America, patch management adoption reflects differences in cybersecurity maturity, regulatory requirements, cloud penetration, digital transformation, and organizational IT complexity. The US emphasizes AI-driven prioritization, automated remediation, EDR integration, compliance reporting, cloud-native architectures, and broader cybersecurity orchestration, while Canada focuses on AI-enabled automation, managed security services, SaaS delivery, regulatory alignment, and cloud-based patch management for distributed organizations. Mexico increasingly prioritizes automated patching, cloud and agentless management, remote endpoint security, localized compliance capabilities, and scalable solutions for SMEs and hybrid environments. Rest of North America continues to emphasize risk-based patch prioritization, cybersecurity insurance alignment, centralized cloud-based management, compliance reporting, AI-assisted remediation, and secure orchestration across legacy and modern infrastructure.
List of Key Companies Profiled
- Microsoft Corporation
- Zoho Corporation
- Ivanti, Inc.
- Tanium Inc.
- HCLSoftware
- Qualys, Inc.
- NinjaOne LLC
- Automox Inc.
- Patch My PC LLC
- Kaseya Ltd.
North America Patch Management Market Report Segmentation
By Solution
- Software
- Services
By Deployment
- Cloud
- On-Premises
By Enterprise Size
- Large Enterprise
- SMEs
By Vertical
- BFSI
- IT & Telecommunication
- Retail & E-commerce
- Healthcare
- Manufacturing
- Government
- Energy & Utilities
- Other Vertical
By Country
- US
- Canada
- Mexico
- Rest of North America
1.1 Market Overview
1.2 Key Factors Impacting Market
1.2.1 Market Drivers
1.2.2 Market Restraints
1.2.3 Market Opportunities
1.2.4 Market Challenges
1.2.5 Market Trends
1.2.6 State of Competition
1.2.7 Market Consolidation
1.2.8 Key Customer Criteria
1.3 Product Life Cycle
1.4 Segmentation By Solution
1.4.1 Software
1.4.2 Services
1.5 Segmentation By Deployment
1.5.1 Cloud
1.5.2 On-Premises
1.6 Segmentation By Enterprise Size
1.6.1 Large Enterprise
1.6.2 SMEs
1.7 Segmentation By Verticals
1.7.1 BFSI
1.7.2 IT & Telecommunication
1.7.3 Retail & E-commerce
1.7.4 Healthcare
1.7.5 Manufacturing
1.7.6 Government
1.7.7 Energy & Utilities
1.7.8 Other Vertical
1.8 Segmentation By Country
1.8.1 US
1.8.1.1 Segmentation By Solution
1.8.1.1.1 Software
1.8.1.1.2 Services
1.8.1.2 Segmentation By Deployment
1.8.1.2.1 Cloud
1.8.1.2.2 On-Premises
1.8.1.3 Segmentation By Enterprise Size
1.8.1.3.1 Large Enterprise
1.8.1.3.2 SMEs
1.8.1.4 Segmentation By Vertical
1.8.1.4.1 BFSI
1.8.1.4.2 IT & Telecommunication
1.8.1.4.3 Retail & E-commerce
1.8.1.4.4 Healthcare
1.8.1.4.5 Manufacturing
1.8.1.4.6 Government
1.8.1.4.7 Energy & Utilities
1.8.1.4.8 Other Vertical
1.8.2 Canada
1.8.2.1 Segmentation By Solution
1.8.2.1.1 Software
1.8.2.1.2 Services
1.8.2.2 Segmentation By Deployment
1.8.2.2.1 Cloud
1.8.2.2.2 On-Premises
1.8.2.3 Segmentation By Enterprise Size
1.8.2.3.1 Large Enterprise
1.8.2.3.2 SMEs
1.8.2.4 Segmentation By Vertical
1.8.2.4.1 BFSI
1.8.2.4.2 IT & Telecommunication
1.8.2.4.3 Retail & E-commerce
1.8.2.4.4 Healthcare
1.8.2.4.5 Manufacturing
1.8.2.4.6 Government
1.8.2.4.7 Energy & Utilities
1.8.2.4.8 Other Vertical
1.8.3 Mexico
1.8.3.1 Segmentation By Solution
1.8.3.1.1 Software
1.8.3.1.2 Services
1.8.3.2 Segmentation By Deployment
1.8.3.2.1 Cloud
1.8.3.2.2 On-Premises
1.8.3.3 Segmentation By Enterprise Size
1.8.3.3.1 Large Enterprise
1.8.3.3.2 SMEs
1.8.3.4 Segmentation By Vertical
1.8.3.4.1 BFSI
1.8.3.4.2 IT & Telecommunication
1.8.3.4.3 Retail & E-commerce
1.8.3.4.4 Healthcare
1.8.3.4.5 Manufacturing
1.8.3.4.6 Government
1.8.3.4.7 Energy & Utilities
1.8.3.4.8 Other Vertical
1.8.4 Rest of North America
1.8.4.1 Segmentation By Solution
1.8.4.1.1 Software
1.8.4.1.2 Services
1.8.4.2 Segmentation By Deployment
1.8.4.2.1 Cloud
1.8.4.2.2 On-Premises
1.8.4.3 Segmentation By Enterprise Size
1.8.4.3.1 Large Enterprise
1.8.4.3.2 SMEs
1.8.4.4 Segmentation By Vertical
1.8.4.4.1 BFSI
1.8.4.4.2 IT & Telecommunication
1.8.4.4.3 Retail & E-commerce
1.8.4.4.4 Healthcare
1.8.4.4.5 Manufacturing
1.8.4.4.6 Government
1.8.4.4.7 Energy & Utilities
1.8.4.4.8 Other Vertical
Chapter 2. Company Snapshots
2.1 Microsoft
2.1.1 Business Overview
2.1.2 Key Information
2.1.3 Company Focus on Patch Management Market
2.1.4 Strategic Insights
2.1.5 Strategy Deployed
2.1.6 Product & Service Portfolio
2.1.7 Technology & Innovation Focus
2.1.8 SWOT Analysis
2.1.9 Customers / End Users
2.1.10 Key Differentiators
2.1.11 Future Outlook
2.2 Zoho Corporation
2.2.1 Business Overview
2.2.2 Key Information
2.2.3 Company Focus on Patch Management Market
2.2.4 Strategic Insights
2.2.5 Strategy Deployed
2.2.6 Portfolio Matrix
2.2.7 SWOT Analysis
2.2.8 Key Differentiators
2.2.9 Future Outlook
2.3 Ivanti
2.3.1 Business Overview
2.3.2 Key Information
2.3.3 Company Focus on Patch Management Market
2.3.4 Strategic Insights
2.3.5 Strategy Deployed
2.3.6 Technology & Innovation Focus
2.3.7 SWOT Analysis
2.3.8 Key Differentiators
2.3.9 Future Outlook
2.4 Tanium
2.4.1 Business Overview
2.4.2 Key Information
2.4.3 Company Focus on Patch Management Market
2.4.4 Strategic Insights
2.4.5 Strategy Deployed
2.4.6 Portfolio Matrix
2.4.7 SWOT Analysis
2.4.8 Key Differentiators
2.4.9 Future Outlook
2.5 HCLSoftware
2.5.1 Business Overview
2.5.2 Key Information
2.5.3 Company Focus on Patch Management Market
2.5.4 Strategic Insights
2.5.5 Strategy Deployed
2.5.6 Portfolio Matrix
2.5.7 SWOT Analysis
2.5.8 Key Differentiators
2.5.9 Future Outlook
2.6 Qualys
2.6.1 Business Overview
2.6.2 Key Information
2.6.3 Company Focus on Patch Management Market
2.6.4 Strategic Insights
2.6.5 Strategy Deployed
2.6.6 Technology & Innovation Focus
2.6.7 SWOT Analysis
2.6.8 Key Differentiators
2.6.9 Future Outlook
2.7 NinjaOne
2.7.1 Business Overview
2.7.2 Key Information
2.7.3 Company Focus on Patch Management Market
2.7.4 Strategic Insights
2.7.5 Strategy Deployed
2.7.6 Portfolio Matrix
2.7.7 SWOT Analysis
2.7.8 Key Differentiators
2.7.9 Future Outlook
2.8 Automox
2.8.1 Business Overview
2.8.2 Key Information
2.8.3 Company Focus on Patch Management Market
2.8.4 Strategic Insights
2.8.5 Strategy Deployed
2.8.6 Portfolio Matrix
2.8.7 SWOT Analysis
2.8.8 Key Differentiators
2.8.9 Future Outlook
2.9 Patch My PC
2.9.1 Business Overview
2.9.2 Key Information
2.9.3 Company Focus on Patch Management Market
2.9.4 Strategic Insights
2.9.5 Strategy Deployed
2.9.6 Technology & Innovation Focus
2.9.7 Portfolio Matrix
2.9.8 SWOT Analysis
2.9.9 Customers / End Users
2.9.10 Competitive Positioning
2.9.11 Key Differentiators
2.9.12 Future Outlook
2.10 Kaseya
2.10.1 Business Overview
2.10.2 Key Information
2.10.3 Company Focus on Patch Management Market
2.10.4 Strategic Insights
2.10.5 Strategy Deployed
2.10.6 Product & Service Portfolio
2.10.7 Capability Overview
2.10.8 Technology & Innovation Focus
2.10.9 SWOT Analysis
2.10.10 Customers / End Users
2.10.11 Competitive Positioning
2.10.12 Key Differentiators
2.10.13 Portfolio Matrix
2.10.14 Analyst View
2.10.15 Future Outlook
Table 1 North America Patch Management Market Market, 2022 - 2033, USD Million
Table 2 North America Patch Management Market Market by Deployment, 2022 - 2033, USD Million
Table 3 North America Cloud Market, 2022 - 2033, USD Million
Table 4 North America On-Premises Market, 2022 - 2033, USD Million
Table 5 North America Patch Management Market Market by Enterprise Size, 2022 - 2033, USD Million
Table 6 North America Large Enterprise Market, 2022 - 2033, USD Million
Table 7 North America SMEs Market, 2022 - 2033, USD Million
Table 8 North America Patch Management Market Market by Solution, 2022 - 2033, USD Million
Table 9 North America Services Market, 2022 - 2033, USD Million
Table 10 North America Software Market, 2022 - 2033, USD Million
Table 11 North America Patch Management Market Market by Vertical, 2022 - 2033, USD Million
Table 12 North America BFSI Market, 2022 - 2033, USD Million
Table 13 North America Energy & Utilities Market, 2022 - 2033, USD Million
Table 14 North America Government Market, 2022 - 2033, USD Million
Table 15 North America Healthcare Market, 2022 - 2033, USD Million
Table 16 North America IT & Telecommunication Market, 2022 - 2033, USD Million
Table 17 North America Manufacturing Market, 2022 - 2033, USD Million
Table 18 North America Other Vertical Market, 2022 - 2033, USD Million
Table 19 North America Retail & E-commerce Market, 2022 - 2033, USD Million
Table 20 United States Patch Management Market Market, 2022 - 2033, USD Million
Table 21 United States Patch Management Market Market by Deployment, 2022 - 2033, USD Million
Table 22 United States Cloud Market, 2022 - 2033, USD Million
Table 23 United States On-Premises Market, 2022 - 2033, USD Million
Table 24 United States Patch Management Market Market by Enterprise Size, 2022 - 2033, USD Million
Table 25 United States Large Enterprise Market, 2022 - 2033, USD Million
Table 26 United States SMEs Market, 2022 - 2033, USD Million
Table 27 United States Patch Management Market Market by Solution, 2022 - 2033, USD Million
Table 28 United States Services Market, 2022 - 2033, USD Million
Table 29 United States Software Market, 2022 - 2033, USD Million
Table 30 United States Patch Management Market Market by Vertical, 2022 - 2033, USD Million
Table 31 United States BFSI Market, 2022 - 2033, USD Million
Table 32 United States Energy & Utilities Market, 2022 - 2033, USD Million
Table 33 United States Government Market, 2022 - 2033, USD Million
Table 34 United States Healthcare Market, 2022 - 2033, USD Million
Table 35 United States IT & Telecommunication Market, 2022 - 2033, USD Million
Table 36 United States Manufacturing Market, 2022 - 2033, USD Million
Table 37 United States Other Vertical Market, 2022 - 2033, USD Million
Table 38 United States Retail & E-commerce Market, 2022 - 2033, USD Million
Table 39 Canada Patch Management Market Market, 2022 - 2033, USD Million
Table 40 Canada Patch Management Market Market by Deployment, 2022 - 2033, USD Million
Table 41 Canada Cloud Market, 2022 - 2033, USD Million
Table 42 Canada On-Premises Market, 2022 - 2033, USD Million
Table 43 Canada Patch Management Market Market by Enterprise Size, 2022 - 2033, USD Million
Table 44 Canada Large Enterprise Market, 2022 - 2033, USD Million
Table 45 Canada SMEs Market, 2022 - 2033, USD Million
Table 46 Canada Patch Management Market Market by Solution, 2022 - 2033, USD Million
Table 47 Canada Services Market, 2022 - 2033, USD Million
Table 48 Canada Software Market, 2022 - 2033, USD Million
Table 49 Canada Patch Management Market Market by Vertical, 2022 - 2033, USD Million
Table 50 Canada BFSI Market, 2022 - 2033, USD Million
Table 51 Canada Energy & Utilities Market, 2022 - 2033, USD Million
Table 52 Canada Government Market, 2022 - 2033, USD Million
Table 53 Canada Healthcare Market, 2022 - 2033, USD Million
Table 54 Canada IT & Telecommunication Market, 2022 - 2033, USD Million
Table 55 Canada Manufacturing Market, 2022 - 2033, USD Million
Table 56 Canada Other Vertical Market, 2022 - 2033, USD Million
Table 57 Canada Retail & E-commerce Market, 2022 - 2033, USD Million
Table 58 Mexico Patch Management Market Market, 2022 - 2033, USD Million
Table 59 Mexico Patch Management Market Market by Deployment, 2022 - 2033, USD Million
Table 60 Mexico Cloud Market, 2022 - 2033, USD Million
Table 61 Mexico On-Premises Market, 2022 - 2033, USD Million
Table 62 Mexico Patch Management Market Market by Enterprise Size, 2022 - 2033, USD Million
Table 63 Mexico Large Enterprise Market, 2022 - 2033, USD Million
Table 64 Mexico SMEs Market, 2022 - 2033, USD Million
Table 65 Mexico Patch Management Market Market by Solution, 2022 - 2033, USD Million
Table 66 Mexico Services Market, 2022 - 2033, USD Million
Table 67 Mexico Software Market, 2022 - 2033, USD Million
Table 68 Mexico Patch Management Market Market by Vertical, 2022 - 2033, USD Million
Table 69 Mexico BFSI Market, 2022 - 2033, USD Million
Table 70 Mexico Energy & Utilities Market, 2022 - 2033, USD Million
Table 71 Mexico Government Market, 2022 - 2033, USD Million
Table 72 Mexico Healthcare Market, 2022 - 2033, USD Million
Table 73 Mexico IT & Telecommunication Market, 2022 - 2033, USD Million
Table 74 Mexico Manufacturing Market, 2022 - 2033, USD Million
Table 75 Mexico Other Vertical Market, 2022 - 2033, USD Million
Table 76 Mexico Retail & E-commerce Market, 2022 - 2033, USD Million
Table 77 Rest of North America Patch Management Market Market, 2022 - 2033, USD Million
Table 78 Rest of North America Patch Management Market Market by Deployment, 2022 - 2033, USD Million
Table 79 Rest of North America Cloud Market, 2022 - 2033, USD Million
Table 80 Rest of North America On-Premises Market, 2022 - 2033, USD Million
Table 81 Rest of North America Patch Management Market Market by Enterprise Size, 2022 - 2033, USD Million
Table 82 Rest of North America Large Enterprise Market, 2022 - 2033, USD Million
Table 83 Rest of North America SMEs Market, 2022 - 2033, USD Million
Table 84 Rest of North America Patch Management Market Market by Solution, 2022 - 2033, USD Million
Table 85 Rest of North America Services Market, 2022 - 2033, USD Million
Table 86 Rest of North America Software Market, 2022 - 2033, USD Million
Table 87 Rest of North America Patch Management Market Market by Vertical, 2022 - 2033, USD Million
Table 88 Rest of North America BFSI Market, 2022 - 2033, USD Million
Table 89 Rest of North America Energy & Utilities Market, 2022 - 2033, USD Million
Table 90 Rest of North America Government Market, 2022 - 2033, USD Million
Table 91 Rest of North America Healthcare Market, 2022 - 2033, USD Million
Table 92 Rest of North America IT & Telecommunication Market, 2022 - 2033, USD Million
Table 93 Rest of North America Manufacturing Market, 2022 - 2033, USD Million
Table 94 Rest of North America Other Vertical Market, 2022 - 2033, USD Million
Table 95 Rest of North America Retail & E-commerce Market, 2022 - 2033, USD Million
List of Figures
FIG 1 Key Factors Impacting Market
FIG 2 Market Consolidation
FIG 3 Key Customer Criteria
FIG 4 Product Life Cycle
FIG 5 North America Patch Management Market Market, 2022 - 2033, USD Million
FIG 6 North America Patch Management Market Market by Deployment, 2022 - 2033, USD Million
FIG 7 North America Cloud Market, 2022 - 2033, USD Million
FIG 8 North America On-Premises Market, 2022 - 2033, USD Million
FIG 9 North America Patch Management Market Market by Enterprise Size, 2022 - 2033, USD Million
FIG 10 North America Large Enterprise Market, 2022 - 2033, USD Million
FIG 11 North America SMEs Market, 2022 - 2033, USD Million
FIG 12 North America Patch Management Market Market by Solution, 2022 - 2033, USD Million
FIG 13 North America Services Market, 2022 - 2033, USD Million
FIG 14 North America Software Market, 2022 - 2033, USD Million
FIG 15 North America Patch Management Market Market by Vertical, 2022 - 2033, USD Million
FIG 16 North America BFSI Market, 2022 - 2033, USD Million
FIG 17 North America Energy & Utilities Market, 2022 - 2033, USD Million
FIG 18 North America Government Market, 2022 - 2033, USD Million
FIG 19 North America Healthcare Market, 2022 - 2033, USD Million
FIG 20 North America IT & Telecommunication Market, 2022 - 2033, USD Million
FIG 21 North America Manufacturing Market, 2022 - 2033, USD Million
FIG 22 North America Other Vertical Market, 2022 - 2033, USD Million
FIG 23 North America Retail & E-commerce Market, 2022 - 2033, USD Million
FIG 24 United States Patch Management Market Market, 2022 - 2033, USD Million
FIG 25 United States Patch Management Market Market by Deployment, 2022 - 2033, USD Million
FIG 26 United States Cloud Market, 2022 - 2033, USD Million
FIG 27 United States On-Premises Market, 2022 - 2033, USD Million
FIG 28 United States Patch Management Market Market by Enterprise Size, 2022 - 2033, USD Million
FIG 29 United States Large Enterprise Market, 2022 - 2033, USD Million
FIG 30 United States SMEs Market, 2022 - 2033, USD Million
FIG 31 United States Patch Management Market Market by Solution, 2022 - 2033, USD Million
FIG 32 United States Services Market, 2022 - 2033, USD Million
FIG 33 United States Software Market, 2022 - 2033, USD Million
FIG 34 United States Patch Management Market Market by Vertical, 2022 - 2033, USD Million
FIG 35 United States BFSI Market, 2022 - 2033, USD Million
FIG 36 United States Energy & Utilities Market, 2022 - 2033, USD Million
FIG 37 United States Government Market, 2022 - 2033, USD Million
FIG 38 United States Healthcare Market, 2022 - 2033, USD Million
FIG 39 United States IT & Telecommunication Market, 2022 - 2033, USD Million
FIG 40 United States Manufacturing Market, 2022 - 2033, USD Million
FIG 41 United States Other Vertical Market, 2022 - 2033, USD Million
FIG 42 United States Retail & E-commerce Market, 2022 - 2033, USD Million
FIG 43 Canada Patch Management Market Market, 2022 - 2033, USD Million
FIG 44 Canada Patch Management Market Market by Deployment, 2022 - 2033, USD Million
FIG 45 Canada Cloud Market, 2022 - 2033, USD Million
FIG 46 Canada On-Premises Market, 2022 - 2033, USD Million
FIG 47 Canada Patch Management Market Market by Enterprise Size, 2022 - 2033, USD Million
FIG 48 Canada Large Enterprise Market, 2022 - 2033, USD Million
FIG 49 Canada SMEs Market, 2022 - 2033, USD Million
FIG 50 Canada Patch Management Market Market by Solution, 2022 - 2033, USD Million
FIG 51 Canada Services Market, 2022 - 2033, USD Million
FIG 52 Canada Software Market, 2022 - 2033, USD Million
FIG 53 Canada Patch Management Market Market by Vertical, 2022 - 2033, USD Million
FIG 54 Canada BFSI Market, 2022 - 2033, USD Million
FIG 55 Canada Energy & Utilities Market, 2022 - 2033, USD Million
FIG 56 Canada Government Market, 2022 - 2033, USD Million
FIG 57 Canada Healthcare Market, 2022 - 2033, USD Million
FIG 58 Canada IT & Telecommunication Market, 2022 - 2033, USD Million
FIG 59 Canada Manufacturing Market, 2022 - 2033, USD Million
FIG 60 Canada Other Vertical Market, 2022 - 2033, USD Million
FIG 61 Canada Retail & E-commerce Market, 2022 - 2033, USD Million
FIG 62 Mexico Patch Management Market Market, 2022 - 2033, USD Million
FIG 63 Mexico Patch Management Market Market by Deployment, 2022 - 2033, USD Million
FIG 64 Mexico Cloud Market, 2022 - 2033, USD Million
FIG 65 Mexico On-Premises Market, 2022 - 2033, USD Million
FIG 66 Mexico Patch Management Market Market by Enterprise Size, 2022 - 2033, USD Million
FIG 67 Mexico Large Enterprise Market, 2022 - 2033, USD Million
FIG 68 Mexico SMEs Market, 2022 - 2033, USD Million
FIG 69 Mexico Patch Management Market Market by Solution, 2022 - 2033, USD Million
FIG 70 Mexico Services Market, 2022 - 2033, USD Million
FIG 71 Mexico Software Market, 2022 - 2033, USD Million
FIG 72 Mexico Patch Management Market Market by Vertical, 2022 - 2033, USD Million
FIG 73 Mexico BFSI Market, 2022 - 2033, USD Million
FIG 74 Mexico Energy & Utilities Market, 2022 - 2033, USD Million
FIG 75 Mexico Government Market, 2022 - 2033, USD Million
FIG 76 Mexico Healthcare Market, 2022 - 2033, USD Million
FIG 77 Mexico IT & Telecommunication Market, 2022 - 2033, USD Million
FIG 78 Mexico Manufacturing Market, 2022 - 2033, USD Million
FIG 79 Mexico Other Vertical Market, 2022 - 2033, USD Million
FIG 80 Mexico Retail & E-commerce Market, 2022 - 2033, USD Million
FIG 81 Rest of North America Patch Management Market Market, 2022 - 2033, USD Million
FIG 82 Rest of North America Patch Management Market Market by Deployment, 2022 - 2033, USD Million
FIG 83 Rest of North America Cloud Market, 2022 - 2033, USD Million
FIG 84 Rest of North America On-Premises Market, 2022 - 2033, USD Million
FIG 85 Rest of North America Patch Management Market Market by Enterprise Size, 2022 - 2033, USD Million
FIG 86 Rest of North America Large Enterprise Market, 2022 - 2033, USD Million
FIG 87 Rest of North America SMEs Market, 2022 - 2033, USD Million
FIG 88 Rest of North America Patch Management Market Market by Solution, 2022 - 2033, USD Million
FIG 89 Rest of North America Services Market, 2022 - 2033, USD Million
FIG 90 Rest of North America Software Market, 2022 - 2033, USD Million
FIG 91 Rest of North America Patch Management Market Market by Vertical, 2022 - 2033, USD Million
FIG 92 Rest of North America BFSI Market, 2022 - 2033, USD Million
FIG 93 Rest of North America Energy & Utilities Market, 2022 - 2033, USD Million
FIG 94 Rest of North America Government Market, 2022 - 2033, USD Million
FIG 95 Rest of North America Healthcare Market, 2022 - 2033, USD Million
FIG 96 Rest of North America IT & Telecommunication Market, 2022 - 2033, USD Million
FIG 97 Rest of North America Manufacturing Market, 2022 - 2033, USD Million
FIG 98 Rest of North America Other Vertical Market, 2022 - 2033, USD Million
FIG 99 Rest of North America Retail & E-commerce Market, 2022 - 2033, USD Million