North America Partner Relationship Management Market Size, Share & Industry Analysis Report By Deployment (Cloud, and On-Premise), By Component (Software, and Services), By Services Type (Training & Consultation, and Managed Services), By Organization Size, By Application, By Country Outlook and Forecast, 2026 - 2033
Published Date : 02-Sep-2026 |
Pages: 259 |
Report Format: PDF + Excel |
COVID-19 Impact on the North America Partner Relationship Management Market
The North America Partner Relationship Management Market is expected to reach USD 90.9 billion by 2032, growing at a CAGR of 13.8% during (2026 – 2033).
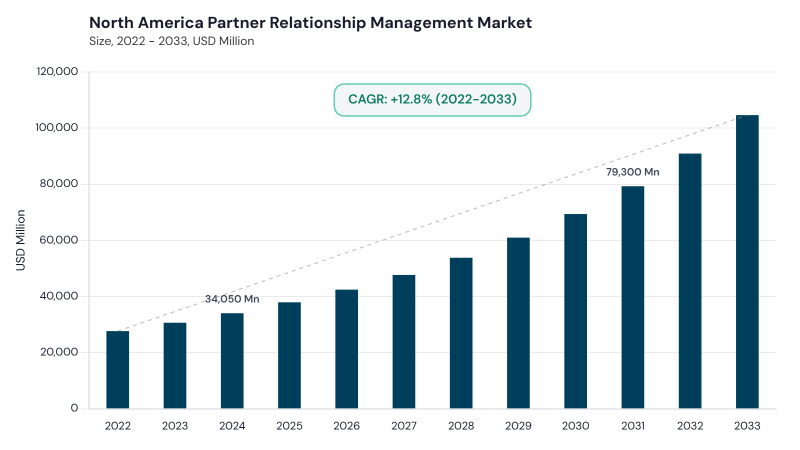
PRM adoption across North America evolved from basic repositories and communication systems used to coordinate resellers, distributors, and channel partners. Early solutions primarily supported partner activity tracking and information sharing. Advancements in cloud computing, automation, analytics, and CRM integration gradually transformed these systems into comprehensive partner engagement platforms. SaaS-based deployment further increased accessibility for mid-sized organizations, while growing expectations for personalized experiences and real-time information encouraged the development of more integrated and collaborative partner ecosystems.
Market development across North America is increasingly influenced by AI-powered personalization, advanced analytics, digital collaboration, and cloud-native architectures. Organizations are prioritizing self-service portals, automated workflows, predictive partner insights, personalized enablement, and seamless integration with CRM, ERP, and marketing platforms. API-driven connectivity is strengthening deal registration, incentive management, content distribution, and performance tracking. Greater emphasis on cybersecurity, compliance, scalability, and partner experience is also encouraging vendors to deliver more intelligent and configurable PRM environments.
Deployment Outlook
Based on Deployment, the market is segmented into Cloud and On-Premise. The Cloud market dominated the North America Partner Relationship Management Market by Deployment in 2025, and would continue to be a dominant market till 2033; thereby, achieving a market value of USD 64.7 billion by 2032, growing at a CAGR of 13.9 % during the forecast period. The On-Premise market is expected to witness a CAGR of 13.3% during (2026 - 2033).
Cloud deployment leads as enterprises increasingly seek scalable platforms, remote collaboration capabilities, faster implementation, and seamless integration with existing business applications. These solutions support partner onboarding, sales enablement, deal registration, performance monitoring, and real-time information sharing while reducing infrastructure requirements. On-Premise deployment continues to serve organizations that prioritize internal data control, customized system configurations, legacy infrastructure integration, and stringent security or regulatory requirements.
Component Outlook
Based on Component, the market is segmented into Software and Services. The Software market dominated the North America Partner Relationship Management Market by Component in 2025, and would continue to be a dominant market till 2033; thereby, achieving a market value of USD 58.6 billion by 2032, growing at a CAGR of 13.9 % during the forecast period. The Services market is expected to witness a CAGR of 13.5% during (2026 - 2033).
Software remains the principal component as organizations expand the use of automated partner portals, deal registration tools, incentive management systems, workflow automation, and analytics platforms. AI and predictive capabilities are further strengthening partner scoring, engagement monitoring, and decision-making. Services support implementation, customization, system integration, training, migration, technical assistance, and ongoing optimization, helping enterprises align PRM deployments with complex partner ecosystems and operational requirements.
Organization Size Outlook
Based on Organization Size, the market is segmented into Large Enterprise and Small & Medium Enterprises. The Large Enterprise market dominated the North America Partner Relationship Management Market by Organization Size in 2025, and would continue to be a dominant market till 2033; thereby, achieving a market value of USD 54.0 billion by 2032, growing at a CAGR of 13.4 % during the forecast period. The Small & Medium Enterprises market is expected to witness a CAGR of 14.3% during (2026 - 2033).
Large enterprises maintain strong adoption due to extensive partner portfolios, multi-tier distribution structures, complex channel operations, and greater demand for enterprise-wide integration. These organizations increasingly use PRM systems to automate engagement, improve collaboration, strengthen analytics, and enhance partner performance. Small & Medium Enterprises are benefiting from affordable cloud-native and SaaS-based offerings that provide faster deployment, modular pricing, simplified administration, and essential partner management functionality without extensive infrastructure investment.
Application Outlook
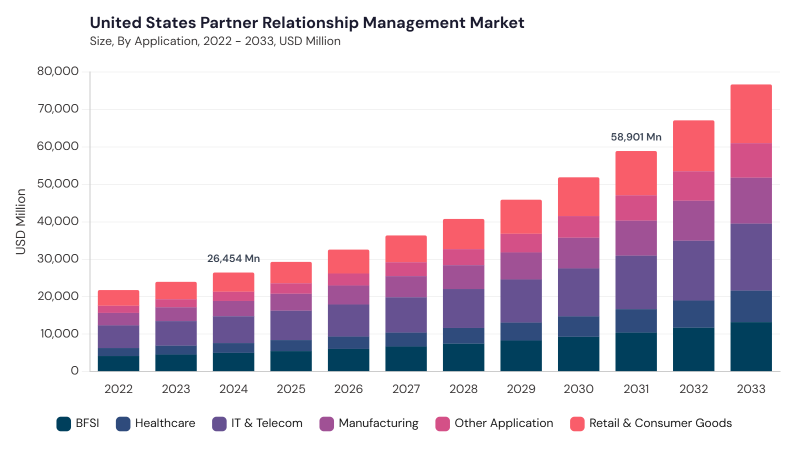
Based on Application, the market is segmented into IT & Telecom, Retail & Consumer Goods, BFSI, Manufacturing, Healthcare, and Other Application. IT & Telecom leads due to extensive networks of resellers, system integrators, consultants, and technology partners requiring efficient onboarding, certification, deal registration, and incentive management.
Retail & Consumer Goods uses PRM platforms for distributor coordination and omnichannel initiatives, while BFSI emphasizes broker and agency collaboration with strong compliance controls. Manufacturing relies on dealer and distributor management, Healthcare focuses on secure engagement with distributors and service partners, and Other Application includes education, energy, logistics, hospitality, government, and professional services.
Free Valuable Insights: The Global Partner Relationship Management Market will hit USD 287.0 Billion billion by 2033, at a CAGR of 14.3%
Country Outlook
Based on Country, the market is segmented into US, Canada, Mexico, and Rest of North America. The US market dominated the North America Partner Relationship Management Market by Country in 2025, and would continue to be a dominant market till 2033; thereby, achieving a market value of USD 67.0 billion by 2032, growing at a CAGR of 13 % during the forecast period. The Canada market is expected to witness a CAGR of 16% during (2026 - 2033). Additionally, The Mexico market is expected to witness a CAGR of 15.5% during (2026 - 2033).
The US exhibits a mature PRM environment supported by AI-enabled automation, analytics, extensive partner ecosystems, and integrated digital platforms. Canada is advancing through AI-based insights, omnichannel partner engagement, cloud adoption, and growing emphasis on data privacy and compliance. Mexico is progressing through cloud-native platforms, cross-border collaboration, localized solutions, and expanding digital transformation initiatives. Rest of North America is supported by unified partner engagement, configurable platforms, localized strategies, and stronger integration across diverse partner networks.
List of Key Companies Profiled
- Salesforce, Inc.
- Impartner Software, Inc.
- ZINFI Technologies, Inc.
- Unifyr
- PartnerStack, Inc.
- Channelscaler
- Magentrix Corporation
- Mindmatrix, Inc.
- Channeltivity, LLC
- WorkSpan, Inc.
North America Partner Relationship Management Market Report Segmentation
By Deployment
- Cloud
- On-Premise
By Component
- Software
- Services
- Training & Consultation
- Managed Services
- Other Services Type
By Organization Size
- Large Enterprise
- Small & Medium Enterprises
By Application
- IT & Telecom
- Retail & Consumer Goods
- BFSI
- Manufacturing
- Healthcare
- Other Application
By Country
- US
- Canada
- Mexico
- Rest of North America
1.1 Market Overview
1.2 Key Factors Impacting Market
1.2.1 Market Drivers
1.2.2 Market Restraints
1.2.3 Market Opportunities
1.2.4 Market Challenges
1.2.5 Market Trends
1.2.6 State of Competition
1.2.7 Market Consolidation
1.2.8 Key Customer Criteria
1.3 Product Life Cycle
1.4 Segmentation By Delivery
1.4.1 Instant Delivery
1.4.2 Scheduled Delivery
1.5 Segmentation By Delivery Payment
1.5.1 Online
1.5.2 Cash
1.6 Segmentation By Product Category
1.6.1 Grocery & Staples
1.6.2 Packaged Food & Snacks
1.6.3 Personal Care & Beauty
1.6.4 Pharmacy / Health & Wellness
1.6.5 Household Products
1.6.6 Small Electronics & Accessories
1.6.7 Fashion & Lifestyle
1.6.8 Other Product Category
1.7 Segmentation By Country
1.7.1 US
1.7.1.1 Segmentation By Delivery
1.7.1.1.1 Instant Delivery
1.7.1.1.2 Scheduled Delivery
1.7.1.2 Segmentation By Delivery Payment
1.7.1.2.1 Online
1.7.1.2.2 Cash
1.7.1.3 Segmentation By Product Category
1.7.1.3.1 Grocery & Staples
1.7.1.3.2 Packaged Food & Snacks
1.7.1.3.3 Personal Care & Beauty
1.7.1.3.4 Pharmacy / Health & Wellness
1.7.1.3.5 Household Products
1.7.1.3.6 Small Electronics & Accessories
1.7.1.3.7 Fashion & Lifestyle
1.7.1.3.8 Other Product Category
1.7.2 Canada
1.7.2.1 Segmentation By Delivery
1.7.2.1.1 Instant Delivery
1.7.2.1.2 Scheduled Delivery
1.7.2.2 Segmentation By Delivery Payment
1.7.2.2.1 Online
1.7.2.2.2 Cash
1.7.2.3 Segmentation By Product Category
1.7.2.3.1 Grocery & Staples
1.7.2.3.2 Packaged Food & Snacks
1.7.2.3.3 Personal Care & Beauty
1.7.2.3.4 Pharmacy / Health & Wellness
1.7.2.3.5 Household Products
1.7.2.3.6 Small Electronics & Accessories
1.7.2.3.7 Fashion & Lifestyle
1.7.2.3.8 Other Product Category
1.7.3 Mexico
1.7.3.1 Segmentation By Delivery
1.7.3.1.1 Instant Delivery
1.7.3.1.2 Scheduled Delivery
1.7.3.2 Segmentation By Delivery Payment
1.7.3.2.1 Online
1.7.3.2.2 Cash
1.7.3.3 Segmentation By Product Category
1.7.3.3.1 Grocery & Staples
1.7.3.3.2 Packaged Food & Snacks
1.7.3.3.3 Personal Care & Beauty
1.7.3.3.4 Pharmacy / Health & Wellness
1.7.3.3.5 Household Products
1.7.3.3.6 Small Electronics & Accessories
1.7.3.3.7 Fashion & Lifestyle
1.7.3.3.8 Other Product Category
1.7.4 Rest of North America
1.7.4.1 Segmentation By Delivery
1.7.4.1.1 Instant Delivery
1.7.4.1.2 Scheduled Delivery
1.7.4.2 Segmentation By Delivery Payment
1.7.4.2.1 Online
1.7.4.2.2 Cash
1.7.4.3 Segmentation By Product Category
1.7.4.3.1 Grocery & Staples
1.7.4.3.2 Packaged Food & Snacks
1.7.4.3.3 Personal Care & Beauty
1.7.4.3.4 Pharmacy / Health & Wellness
1.7.4.3.5 Household Products
1.7.4.3.6 Small Electronics & Accessories
1.7.4.3.7 Fashion & Lifestyle
1.7.4.3.8 Other Product Category
Chapter 2. Company Snapshots
2.1 Meituan
2.1.1 Business Overview
2.1.2 Key Information
2.1.3 Company Focus on Quick Commerce Market
2.1.4 Strategic Insights
2.1.5 Strategy Deployed for Quick Commerce Market
2.1.6 Product & Service Portfolio
2.1.7 Representative Products / Services
2.1.8 Capability Overview
2.1.9 Technology & Innovation Focus
2.1.10 SWOT Analysis
2.1.11 Customers / End Users
2.1.12 Competitive Positioning
2.1.13 Key Differentiators
2.1.14 Portfolio Matrix
2.1.15 Analyst View
2.1.16 Future Outlook
2.2 Alibaba Group Holding Limited
2.2.1 Business Overview
2.2.2 Key Information
2.2.3 Company Focus on Quick Commerce Market
2.2.4 Strategic Insights on Quick Commerce Market
2.2.5 Strategy Deployed
2.2.6 Product & Service Portfolio
2.2.7 Representative Products / Services
2.2.8 Technology & Innovation Focus
2.2.9 SWOT Analysis
2.2.10 Customers / End Users
2.2.11 Competitive Positioning
2.2.12 Key Differentiators
2.2.13 Portfolio Matrix
2.2.14 Analyst View
2.2.15 Future Outlook
2.3 JD.com, Inc.
2.3.1 Business Overview
2.3.2 Key Information
2.3.3 Company Focus on Quick Commerce Market
2.3.4 Strategic Insights on Quick Commerce Market
2.3.5 Strategy Deployed for Quick Commerce Market
2.3.6 Product & Service Portfolio
2.3.7 Representative Products / Services
2.3.8 Capability Overview
2.3.9 Technology & Innovation Focus
2.3.10 SWOT Analysis
2.3.11 Customers / End Users
2.3.12 Competitive Positioning
2.3.13 Key Differentiators
2.3.14 Portfolio Matrix
2.3.15 Analyst View
2.3.16 Future Outlook for Quick Commerce Market
2.4 DoorDash, Inc.
2.4.1 Business Overview
2.4.2 Key Information
2.4.3 Company Focus on Quick Commerce Market
2.4.4 Strategic Insights
2.4.5 Strategy Deployed
2.4.6 Product & Service Portfolio
2.4.7 Representative Products / Services
2.4.8 Capability Overview
2.4.9 Technology & Innovation Focus
2.4.10 SWOT Analysis
2.4.11 Customers / End Users
2.4.12 Competitive Positioning
2.4.13 Key Differentiators
2.4.14 Portfolio Matrix
2.4.15 Analyst View
2.4.16 Future Outlook
2.5 Delivery Hero SE
2.5.1 Business Overview
2.5.2 Key Information
2.5.3 Company Focus on Quick Commerce Market
2.5.4 Strategic Insights on Quick Commerce Market
2.5.5 Strategy Deployed
2.5.6 Product & Service Portfolio
2.5.7 Representative Products / Services
2.5.8 Capability Overview
2.5.9 Technology & Innovation Focus
2.5.10 SWOT Analysis
2.5.11 Customers / End Users
2.5.12 Competitive Positioning
2.5.13 Key Differentiators
2.5.14 Portfolio Matrix
2.5.15 Analyst View
2.5.16 Future Outlook for Quick Commerce Market
2.6 Uber Technologies, Inc.
2.6.1 Business Overview
2.6.2 Key Information
2.6.3 Company Focus on Quick Commerce Market
2.6.4 Strategic Insights on Quick Commerce Market
2.6.5 Strategy Deployed for Quick Commerce Market
2.6.6 Product & Service Portfolio
2.6.7 Representative Products / Services
2.6.8 Capability Overview
2.6.9 Technology & Innovation Focus
2.6.10 SWOT Analysis
2.6.11 Customers / End Users
2.6.12 Competitive Positioning
2.6.13 Key Differentiators
2.6.14 Portfolio Matrix
2.6.15 Analyst View
2.6.16 Future Outlook
2.7 Zomato Ltd.
2.7.1 Business Overview
2.7.2 Key Information
2.7.3 Company Focus on Quick Commerce Market
2.7.4 Strategic Insights
2.7.5 Strategy Deployed for Quick Commerce Market
2.7.6 Product & Service Portfolio
2.7.7 Representative Products / Services
2.7.8 Capability Overview
2.7.9 Technology & Innovation Focus
2.7.10 SWOT Analysis
2.7.11 Customers / End Users
2.7.12 Competitive Positioning
2.7.13 Key Differentiators
2.7.14 Portfolio Matrix
2.7.15 Analyst View
2.7.16 Future Outlook for Quick Commerce Market
2.8 Swiggy Ltd.
2.8.1 Business Overview
2.8.2 Key Information
2.8.3 Company Focus on Quick Commerce Market
2.8.4 Strategic Insights on Quick Commerce Market
2.8.5 Strategy Deployed for Quick Commerce Market
2.8.6 Product & Service Portfolio
2.8.7 Representative Products / Services
2.8.8 Capability Overview
2.8.9 Technology & Innovation Focus
2.8.10 SWOT Analysis
2.8.11 Customers / End Users
2.8.12 Competitive Positioning
2.8.13 Key Differentiators
2.8.14 Portfolio Matrix
2.8.15 Analyst View
2.8.16 Future Outlook
2.9 Zepto
2.9.1 Business Overview
2.9.2 Key Information
2.9.3 Company Focus on Quick Commerce Market
2.9.4 Strategic Insights on Quick Commerce Market
2.9.5 Strategy Deployed for Quick Commerce Market
2.9.6 Product & Service Portfolio
2.9.7 Representative Products / Services
2.9.8 Capability Overview
2.9.9 Technology & Innovation Focus
2.9.10 SWOT Analysis
2.9.11 Customers / End Users
2.9.12 Competitive Positioning
2.9.13 Key Differentiators
2.9.14 Portfolio Matrix
2.9.15 Analyst View 2.9.16 Future Outlook
2.10 Grab Holdings Limited
2.10.1 Business Overview
2.10.2 Key Information
2.10.3 Company Focus on Quick Commerce Market
2.10.4 Strategic Insights on Quick Commerce Market
2.10.5 Strategy Deployed for Quick Commerce Market
2.10.6 Product & Service Portfolio
2.10.7 Representative Products / Services
2.10.8 Capability Overview
2.10.9 Technology & Innovation Focus
2.10.10 SWOT Analysis
2.10.11 Customers / End Users
2.10.12 Competitive Positioning
2.10.13 Key Differentiators
2.10.14 Portfolio Matrix
2.10.15 Analyst View
2.10.16 Future Outlook
Table 1 North America Quick Commerce Market Market, 2022 - 2033, USD Million
Table 2 North America Quick Commerce Market Market by Delivery, 2022 - 2033, USD Million
Table 3 North America Instant Market, 2022 - 2033, USD Million
Table 4 North America Scheduled Market, 2022 - 2033, USD Million
Table 5 North America Quick Commerce Market Market by Delivery Payment, 2022 - 2033, USD Million
Table 6 North America Cash Market, 2022 - 2033, USD Million
Table 7 North America Online Market, 2022 - 2033, USD Million
Table 8 North America Quick Commerce Market Market by Product Category, 2022 - 2033, USD Million
Table 9 North America Fashion & Lifestyle Market, 2022 - 2033, USD Million
Table 10 North America Grocery & Staples Market, 2022 - 2033, USD Million
Table 11 North America Household Products Market, 2022 - 2033, USD Million
Table 12 North America Other Product Category Market, 2022 - 2033, USD Million
Table 13 North America Packaged Food & Snacks Market, 2022 - 2033, USD Million
Table 14 North America Personal Care & Beauty Market, 2022 - 2033, USD Million
Table 15 North America Pharmacy / Health & Wellness Market, 2022 - 2033, USD Million
Table 16 North America Small Electronics & Accessories Market, 2022 - 2033, USD Million
Table 17 United States Quick Commerce Market Market, 2022 - 2033, USD Million
Table 18 United States Quick Commerce Market Market by Delivery, 2022 - 2033, USD Million
Table 19 United States Instant Market, 2022 - 2033, USD Million
Table 20 United States Scheduled Market, 2022 - 2033, USD Million
Table 21 United States Quick Commerce Market Market by Delivery Payment, 2022 - 2033, USD Million
Table 22 United States Cash Market, 2022 - 2033, USD Million
Table 23 United States Online Market, 2022 - 2033, USD Million
Table 24 United States Quick Commerce Market Market by Product Category, 2022 - 2033, USD Million
Table 25 United States Fashion & Lifestyle Market, 2022 - 2033, USD Million
Table 26 United States Grocery & Staples Market, 2022 - 2033, USD Million
Table 27 United States Household Products Market, 2022 - 2033, USD Million
Table 28 United States Other Product Category Market, 2022 - 2033, USD Million
Table 29 United States Packaged Food & Snacks Market, 2022 - 2033, USD Million
Table 30 United States Personal Care & Beauty Market, 2022 - 2033, USD Million
Table 31 United States Pharmacy / Health & Wellness Market, 2022 - 2033, USD Million
Table 32 United States Small Electronics & Accessories Market, 2022 - 2033, USD Million
Table 33 Canada Quick Commerce Market Market, 2022 - 2033, USD Million
Table 34 Canada Quick Commerce Market Market by Delivery, 2022 - 2033, USD Million
Table 35 Canada Instant Market, 2022 - 2033, USD Million
Table 36 Canada Scheduled Market, 2022 - 2033, USD Million
Table 37 Canada Quick Commerce Market Market by Delivery Payment, 2022 - 2033, USD Million
Table 38 Canada Cash Market, 2022 - 2033, USD Million
Table 39 Canada Online Market, 2022 - 2033, USD Million
Table 40 Canada Quick Commerce Market Market by Product Category, 2022 - 2033, USD Million
Table 41 Canada Fashion & Lifestyle Market, 2022 - 2033, USD Million
Table 42 Canada Grocery & Staples Market, 2022 - 2033, USD Million
Table 43 Canada Household Products Market, 2022 - 2033, USD Million
Table 44 Canada Other Product Category Market, 2022 - 2033, USD Million
Table 45 Canada Packaged Food & Snacks Market, 2022 - 2033, USD Million
Table 46 Canada Personal Care & Beauty Market, 2022 - 2033, USD Million
Table 47 Canada Pharmacy / Health & Wellness Market, 2022 - 2033, USD Million
Table 48 Canada Small Electronics & Accessories Market, 2022 - 2033, USD Million
Table 49 Mexico Quick Commerce Market Market, 2022 - 2033, USD Million
Table 50 Mexico Quick Commerce Market Market by Delivery, 2022 - 2033, USD Million
Table 51 Mexico Instant Market, 2022 - 2033, USD Million
Table 52 Mexico Scheduled Market, 2022 - 2033, USD Million
Table 53 Mexico Quick Commerce Market Market by Delivery Payment, 2022 - 2033, USD Million
Table 54 Mexico Cash Market, 2022 - 2033, USD Million
Table 55 Mexico Online Market, 2022 - 2033, USD Million
Table 56 Mexico Quick Commerce Market Market by Product Category, 2022 - 2033, USD Million
Table 57 Mexico Fashion & Lifestyle Market, 2022 - 2033, USD Million
Table 58 Mexico Grocery & Staples Market, 2022 - 2033, USD Million
Table 59 Mexico Household Products Market, 2022 - 2033, USD Million
Table 60 Mexico Other Product Category Market, 2022 - 2033, USD Million
Table 61 Mexico Packaged Food & Snacks Market, 2022 - 2033, USD Million
Table 62 Mexico Personal Care & Beauty Market, 2022 - 2033, USD Million
Table 63 Mexico Pharmacy / Health & Wellness Market, 2022 - 2033, USD Million
Table 64 Mexico Small Electronics & Accessories Market, 2022 - 2033, USD Million
Table 65 Rest of North America Quick Commerce Market Market, 2022 - 2033, USD Million
Table 66 Rest of North America Quick Commerce Market Market by Delivery, 2022 - 2033, USD Million
Table 67 Rest of North America Instant Market, 2022 - 2033, USD Million
Table 68 Rest of North America Scheduled Market, 2022 - 2033, USD Million
Table 69 Rest of North America Quick Commerce Market Market by Delivery Payment, 2022 - 2033, USD Million
Table 70 Rest of North America Cash Market, 2022 - 2033, USD Million
Table 71 Rest of North America Online Market, 2022 - 2033, USD Million
Table 72 Rest of North America Quick Commerce Market Market by Product Category, 2022 - 2033, USD Million
Table 73 Rest of North America Fashion & Lifestyle Market, 2022 - 2033, USD Million
Table 74 Rest of North America Grocery & Staples Market, 2022 - 2033, USD Million
Table 75 Rest of North America Household Products Market, 2022 - 2033, USD Million
Table 76 Rest of North America Other Product Category Market, 2022 - 2033, USD Million
Table 77 Rest of North America Packaged Food & Snacks Market, 2022 - 2033, USD Million
Table 78 Rest of North America Personal Care & Beauty Market, 2022 - 2033, USD Million
Table 79 Rest of North America Pharmacy / Health & Wellness Market, 2022 - 2033, USD Million
Table 80 Rest of North America Small Electronics & Accessories Market, 2022 - 2033, USD Million
List of Figures
FIG 1 Key Factors Impacting Market
FIG 2 Market Consolidation
FIG 3 Key Customer Criteria
FIG 4 Product Life Cycle
FIG 5 North America Quick Commerce Market Market, 2022 - 2033, USD Million
FIG 6 North America Quick Commerce Market Market by Delivery, 2022 - 2033, USD Million
FIG 7 North America Instant Market, 2022 - 2033, USD Million
FIG 8 North America Scheduled Market, 2022 - 2033, USD Million
FIG 9 North America Quick Commerce Market Market by Delivery Payment, 2022 - 2033, USD Million
FIG 10 North America Cash Market, 2022 - 2033, USD Million
FIG 11 North America Online Market, 2022 - 2033, USD Million
FIG 12 North America Quick Commerce Market Market by Product Category, 2022 - 2033, USD Million
FIG 13 North America Fashion & Lifestyle Market, 2022 - 2033, USD Million
FIG 14 North America Grocery & Staples Market, 2022 - 2033, USD Million
FIG 15 North America Household Products Market, 2022 - 2033, USD Million
FIG 16 North America Other Product Category Market, 2022 - 2033, USD Million
FIG 17 North America Packaged Food & Snacks Market, 2022 - 2033, USD Million
FIG 18 North America Personal Care & Beauty Market, 2022 - 2033, USD Million
FIG 19 North America Pharmacy / Health & Wellness Market, 2022 - 2033, USD Million
FIG 20 North America Small Electronics & Accessories Market, 2022 - 2033, USD Million
FIG 21 United States Quick Commerce Market Market, 2022 - 2033, USD Million
FIG 22 United States Quick Commerce Market Market by Delivery, 2022 - 2033, USD Million
FIG 23 United States Instant Market, 2022 - 2033, USD Million
FIG 24 United States Scheduled Market, 2022 - 2033, USD Million
FIG 25 United States Quick Commerce Market Market by Delivery Payment, 2022 - 2033, USD Million
FIG 26 United States Cash Market, 2022 - 2033, USD Million
FIG 27 United States Online Market, 2022 - 2033, USD Million
FIG 28 United States Quick Commerce Market Market by Product Category, 2022 - 2033, USD Million
FIG 29 United States Fashion & Lifestyle Market, 2022 - 2033, USD Million
FIG 30 United States Grocery & Staples Market, 2022 - 2033, USD Million
FIG 31 United States Household Products Market, 2022 - 2033, USD Million
FIG 32 United States Other Product Category Market, 2022 - 2033, USD Million
FIG 33 United States Packaged Food & Snacks Market, 2022 - 2033, USD Million
FIG 34 United States Personal Care & Beauty Market, 2022 - 2033, USD Million
FIG 35 United States Pharmacy / Health & Wellness Market, 2022 - 2033, USD Million
FIG 36 United States Small Electronics & Accessories Market, 2022 - 2033, USD Million
FIG 37 Canada Quick Commerce Market Market, 2022 - 2033, USD Million
FIG 38 Canada Quick Commerce Market Market by Delivery, 2022 - 2033, USD Million
FIG 39 Canada Instant Market, 2022 - 2033, USD Million
FIG 40 Canada Scheduled Market, 2022 - 2033, USD Million
FIG 41 Canada Quick Commerce Market Market by Delivery Payment, 2022 - 2033, USD Million
FIG 42 Canada Cash Market, 2022 - 2033, USD Million
FIG 43 Canada Online Market, 2022 - 2033, USD Million
FIG 44 Canada Quick Commerce Market Market by Product Category, 2022 - 2033, USD Million
FIG 45 Canada Fashion & Lifestyle Market, 2022 - 2033, USD Million
FIG 46 Canada Grocery & Staples Market, 2022 - 2033, USD Million
FIG 47 Canada Household Products Market, 2022 - 2033, USD Million
FIG 48 Canada Other Product Category Market, 2022 - 2033, USD Million
FIG 49 Canada Packaged Food & Snacks Market, 2022 - 2033, USD Million
FIG 50 Canada Personal Care & Beauty Market, 2022 - 2033, USD Million
FIG 51 Canada Pharmacy / Health & Wellness Market, 2022 - 2033, USD Million
FIG 52 Canada Small Electronics & Accessories Market, 2022 - 2033, USD Million
FIG 53 Mexico Quick Commerce Market Market, 2022 - 2033, USD Million
FIG 54 Mexico Quick Commerce Market Market by Delivery, 2022 - 2033, USD Million
FIG 55 Mexico Instant Market, 2022 - 2033, USD Million
FIG 56 Mexico Scheduled Market, 2022 - 2033, USD Million
FIG 57 Mexico Quick Commerce Market Market by Delivery Payment, 2022 - 2033, USD Million
FIG 58 Mexico Cash Market, 2022 - 2033, USD Million
FIG 59 Mexico Online Market, 2022 - 2033, USD Million
FIG 60 Mexico Quick Commerce Market Market by Product Category, 2022 - 2033, USD Million
FIG 61 Mexico Fashion & Lifestyle Market, 2022 - 2033, USD Million
FIG 62 Mexico Grocery & Staples Market, 2022 - 2033, USD Million
FIG 63 Mexico Household Products Market, 2022 - 2033, USD Million
FIG 64 Mexico Other Product Category Market, 2022 - 2033, USD Million
FIG 65 Mexico Packaged Food & Snacks Market, 2022 - 2033, USD Million
FIG 66 Mexico Personal Care & Beauty Market, 2022 - 2033, USD Million
FIG 67 Mexico Pharmacy / Health & Wellness Market, 2022 - 2033, USD Million
FIG 68 Mexico Small Electronics & Accessories Market, 2022 - 2033, USD Million
FIG 69 Rest of North America Quick Commerce Market Market, 2022 - 2033, USD Million
FIG 70 Rest of North America Quick Commerce Market Market by Delivery, 2022 - 2033, USD Million
FIG 71 Rest of North America Instant Market, 2022 - 2033, USD Million
FIG 72 Rest of North America Scheduled Market, 2022 - 2033, USD Million
FIG 73 Rest of North America Quick Commerce Market Market by Delivery Payment, 2022 - 2033, USD Million
FIG 74 Rest of North America Cash Market, 2022 - 2033, USD Million
FIG 75 Rest of North America Online Market, 2022 - 2033, USD Million
FIG 76 Rest of North America Quick Commerce Market Market by Product Category, 2022 - 2033, USD Million
FIG 77 Rest of North America Fashion & Lifestyle Market, 2022 - 2033, USD Million
FIG 78 Rest of North America Grocery & Staples Market, 2022 - 2033, USD Million
FIG 79 Rest of North America Household Products Market, 2022 - 2033, USD Million
FIG 80 Rest of North America Other Product Category Market, 2022 - 2033, USD Million
FIG 81 Rest of North America Packaged Food & Snacks Market, 2022 - 2033, USD Million
FIG 82 Rest of North America Personal Care & Beauty Market, 2022 - 2033, USD Million
FIG 83 Rest of North America Pharmacy / Health & Wellness Market, 2022 - 2033, USD Million
FIG 84 Rest of North America Small Electronics & Accessories Market, 2022 - 2033, USD Million