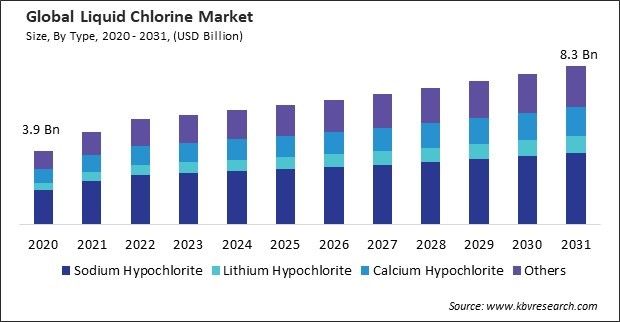
The Global Liquid Chlorine Market size is expected to reach $8.3 billion by 2031, rising at a market growth of 4.8% CAGR during the forecast period. In the year 2023, the market attained a volume of 9,702.0 kilo tonnes, experiencing a growth of 18.4% (2020-2023).
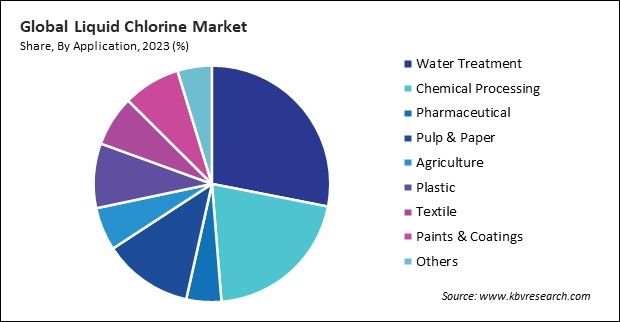
Liquid chlorine enables pulp & paper mills to increase their production capacity and output by improving the efficiency of the bleaching process. Thus, the pulp & paper segment acquired 12.9% revenue share in the market 2023. In terms of volume, the pulp & paper segment attained a volume of 1,192.9 kilo tonnes in the market 2023. It helps to shorten bleaching cycles, reduce chemical consumption, and optimize production operations. It is a highly efficient bleaching agent that provides rapid and consistent bleaching results.

Liquid chlorine is used to treat irrigation water, control microbial growth, and prevent the spread of waterborne diseases. It helps maintain the quality of water used for irrigation, ensuring the health and productivity of crops.
Additionally, it provides effective microbial control against microorganisms commonly found in food and beverage processing environments. It helps prevent the growth of bacteria, molds, yeasts, and other pathogens, ensuring the safety and quality of food and beverage products. Thus, because of the rising demand for food and beverage processing, the market is anticipated to increase significantly.
However, Supply chain disruptions, such as natural disasters, accidents, transportation issues, and geopolitical tensions, can lead to production delays and shortages of liquid chlorine. This can disrupt supply to end-users, leading to downtime and production losses. Thus, vulnerability to supply chain disruptions can slow down the growth of the market.
 Drivers
  Restraints
  Opportunities
  Challenges
 By type, the market is categorized into sodium hypochlorite, lithium hypochlorite, calcium hypochlorite, and others. The lithium hypochlorite segment covered 9.6% revenue share in the market in 2023. In terms of volume, the lithium hypochlorite segment would attain a volume of 731 kilo tonnes by 2029.

Based on application, the market is classified into water treatment, agriculture, chemical processing, pharmaceutical, pulp & paper, plastic, textile, paints & coatings, and others. In 2023, the water treatment segment witnessed 28.2% revenue share in the market. In terms of volume the water treatment segment would attain a volume of 3,273.7 kilo tonnes by 2030.
Free Valuable Insights: Global Liquid Chlorine Market size to reach USD 8.3 Billion by 2031
Region-wise, the market is analysed across North America, Europe, Asia Pacific, and LAMEA. In 2023, the North America region acquired 23.3% revenue share in the market. In terms of volume the North America region would attain a volume of 2,923.9 kilo tonnes by 2031.
| Report Attribute | Details |
|---|---|
| Market size value in 2023 | USD 5.7 Billion |
| Market size forecast in 2031 | USD 8.3 Billion |
| Base Year | 2023 |
| Historical Period | 2020 to 2022 |
| Forecast Period | 2024 to 2031 |
| Revenue Growth Rate | CAGR of 4.8% from 2024 to 2031 |
| Quantitative Data | Volume in Kilo Tonnes, Revenue in USD Billion, and CAGR from 2020 to 2031 |
| Number of Pages | 318 |
| Number of Tables | 650 |
| Report coverage | Market Trends, Revenue Estimation and Forecast, Segmentation Analysis, Regional and Country Breakdown, Porter’s 5 Forces Analysis, Company Profiling, Companies Strategic Developments, SWOT Analysis, Winning Imperatives |
| Segments covered | Type, Application, Region |
| Country scope |
|
| Companies Included | Formosa Plastics Group, Tata Chemicals Ltd., Atul Ltd., AGC, Inc., Vencorex Chemicals (PTT Global Chemical), Clean Plus Chemicals Pty Ltd., DCW Limited, Vynova Belgium NV, Hamilton chemicals, Global Heavy Chemicals Ltd. |
By Type (Volume, Kilo Tonnes, USD Billion, 2020-2031)
By Application (Volume, Kilo Tonnes, USD Billion, 2020-2031)
By Geography (Volume, Kilo Tonnes, USD Billion, 2020-2031)
Our team of dedicated experts can provide you with attractive expansion opportunities for your business.
