Europe Rack-Scale GPU Infrastructure Market Size, Share & Industry Analysis Report By End User (Cloud Service Providers, and Enterprises), By Solution Type (Compute Systems, and Networking Systems), By Deployment Scale (Cluster-Scale AI Factory, and Multi-Rack Pod), By Cooling Architecture, By Country Outlook and Forecast, 2026 - 2033
Published Date : 02-Sep-2026 |
Pages: 349 |
Report Format: PDF + Excel |
COVID-19 Impact on the Europe Rack-Scale GPU Infrastructure Market
The Europe Rack-Scale GPU Infrastructure Market is expected to reach USD 7.3 billion by 2031, growing at a CAGR of 32.5% during (2026 – 2033).
The Europe Rack-Scale GPU Infrastructure Market originated as demand increased for high-performance computing capable of supporting AI, machine learning, and big data analytics workloads. Early development involved discrete GPUs placed within server racks, but scaling was limited by heat, latency, and inefficient resource pooling. Over time, modular rack-scale architectures, liquid cooling, NVLink, PCIe Gen4, and software orchestration enabled denser and more efficient GPU clusters. The market has now evolved into a mature infrastructure ecosystem focused on energy efficiency, scalability, interoperability, workload distribution, and compliance with European sustainability and data regulations.
The Europe Rack-Scale GPU Infrastructure Market is being shaped by AI-optimized GPU clusters, sovereign cloud initiatives, energy-efficient cooling, high-bandwidth networking, modular architectures, and collaborative infrastructure ecosystems. Organizations are adopting rack-scale GPU infrastructure to support generative AI, large AI models, scientific computing, industrial automation, data analytics, and high-performance cloud services. Demand is supported by cloud service providers, enterprises, government and research institutions, telecommunications providers, and edge infrastructure operators. Providers are focusing on liquid cooling, open-standard interconnects, hybrid CPU-GPU architectures, software-defined orchestration, and compliant regional deployments.
End User Outlook
Based on End User, the market is segmented into Cloud Service Providers, Enterprises, Government and Research Institutions, Telecommunications Providers, and Edge Infrastructure Operators. The Cloud Service Providers market dominated the Europe Rack-Scale GPU Infrastructure Market by End User in 2025, and would continue to be a dominant market till 2033; thereby, achieving a market value of USD 3.6 billion by 2031, growing at a CAGR of 31.6 % during the forecast period. The Enterprises market is expected to witness a CAGR of 32.9% during (2026 - 2033). The Edge Infrastructure Operators market is expected to witness a CAGR of 34.7% during (2026 - 2033).
Cloud Service Providers lead due to expanding sovereign cloud initiatives, AI infrastructure investments, hyperscale data center deployments, and demand for high-performance cloud computing services. These providers require scalable GPU capacity to support generative AI, enterprise AI workloads, and multi-tenant computing environments. Enterprises remain significant as manufacturing, financial services, healthcare, and other industries adopt GPU systems for AI-driven automation, analytics, simulations, and digital transformation. Government and Research Institutions use these systems for scientific research, AI innovation, and supercomputing, while Telecommunications Providers and Edge Infrastructure Operators deploy GPU infrastructure for intelligent networks, edge computing, real-time analytics, and low-latency distributed processing.
Solution Type Outlook
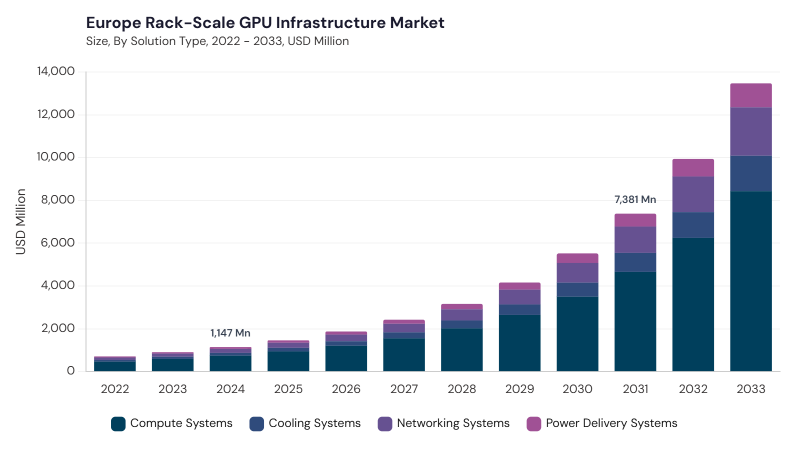
Based on Solution Type, the market is segmented into Compute Systems, Networking Systems, Cooling Systems, and Power Delivery Systems. The Compute Systems market dominated the Europe Rack-Scale GPU Infrastructure Market by Solution Type in 2025, and would continue to be a dominant market till 2033; thereby, achieving a market value of USD 4.6 billion by 2031, growing at a CAGR of 32 % during the forecast period. The Networking Systems market is expected to witness a CAGR of 33% during (2026 - 2033). Additionally, The Cooling Systems market is expected to witness highest CAGR of 33.8% during (2026 - 2033).
Compute Systems lead due to rising demand for GPU platforms that accelerate AI model training, inference, scientific computing, and large-scale data processing. These systems form the core of rack-scale infrastructure by integrating GPU accelerators, servers, and compute modules for dense parallel processing. Networking Systems remain significant as high-speed interconnects, switches, and fabrics enable low-latency communication across GPUs and clusters. Cooling Systems continue gaining importance as high-density deployments require efficient thermal management, while Power Delivery Systems support reliable electrical distribution, intelligent power management, redundancy, and compliance with European energy-efficiency requirements.
Deployment Scale Outlook
Based on Deployment Scale, the market is segmented into Cluster-Scale AI Factory, Multi-Rack Pod, and Single-Rack. The Cluster-Scale AI Factory market dominated the Europe Rack-Scale GPU Infrastructure Market by Deployment Scale in 2025, and would continue to be a dominant market till 2033; thereby, achieving a market value of USD 2.7 billion by 2031, growing at a CAGR of 31.9 % during the forecast period. The Multi-Rack Pod market is expected to witness a CAGR of 32.8% during (2026 - 2033). Additionally, The Single-Rack market is expected to witness highest CAGR of 33.2% during (2026 - 2033).
Cluster-Scale AI Factory leads due to increasing investments in large-scale AI research, foundation model development, sovereign AI initiatives, and high-performance computing facilities. These deployments integrate numerous GPU racks into large clusters supported by advanced orchestration, high-speed networking, cooling, and energy-efficient operations. Multi-Rack Pod remains significant as enterprises and research organizations require scalable GPU clusters with flexibility, redundancy, and strong workload distribution. Single-Rack deployments support compact AI infrastructure for inference workloads, engineering simulations, proof-of-concept projects, edge sites, and specialized computing applications with smaller infrastructure requirements.
Cooling Architecture Outlook
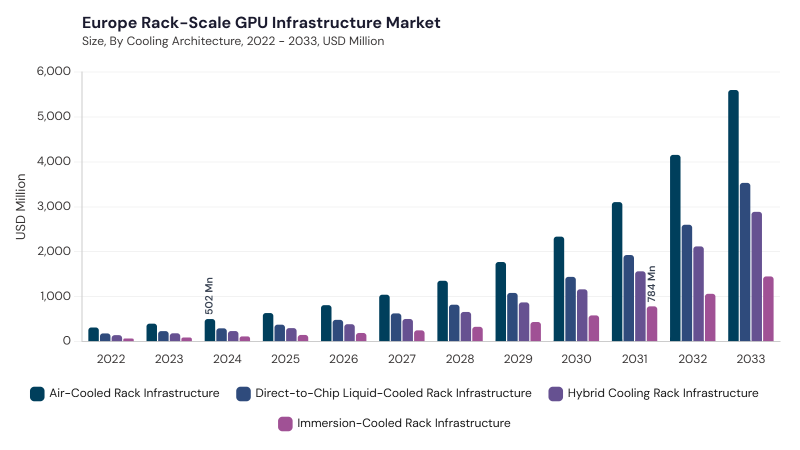
Based on Cooling Architecture, the market is segmented into Air-Cooled Rack Infrastructure, Direct-to-Chip Liquid-Cooled Rack Infrastructure, Hybrid Cooling Rack Infrastructure, and Immersion-Cooled Rack Infrastructure. Air-Cooled Rack Infrastructure leads due to compatibility with existing data center facilities, lower upfront implementation complexity, and established cooling practices across enterprise environments. This architecture remains suitable for moderate GPU workloads and facilities that prioritize easier maintenance and legacy compatibility.
Direct-to-Chip Liquid-Cooled Rack Infrastructure is gaining importance as dense AI workloads require efficient chip-level thermal management and lower energy usage. Hybrid Cooling Rack Infrastructure supports phased upgrades by combining air and liquid cooling, while Immersion-Cooled Rack Infrastructure is concentrated in advanced AI data centers and research facilities requiring ultra-high-density, sustainable cooling performance.
Free Valuable Insights: The Worldwide Rack-Scale GPU Infrastructure Market is projected to reach USD 70.6 Billion billion by 2033, at a CAGR of 32.9%
Country Outlook
Based on Country, the market is segmented into Germany, UK, France, Russia, Spain, Italy, and Rest of Europe. The Germany market dominated the Europe Rack-Scale GPU Infrastructure Market by Country in 2025, and would continue to be a dominant market till 2033; thereby, achieving a market value of USD 1.5 billion by 2031, growing at a CAGR of 30.8 % during the forecast period. The UK market is expected to witness a CAGR of 31.4% during (2026 - 2033). Additionally, The France market is expected to witness a CAGR of 33.5% during (2026 - 2033).
Germany leads due to strong industrial AI adoption, AI-powered factories, robotics hubs, open-source AI infrastructure stacks, high-capacity interconnect demand, and localized rack-scale GPU deployments. The UK supports market growth through energy-efficient designs, heterogeneous GPU architectures, local data center partnerships, liquid cooling, and software-defined resource allocation. France contributes through sovereign cloud initiatives, composable GPU infrastructure, local R&D, energy-efficient designs, and orchestration frameworks. Russia, Spain, and Italy add momentum through open platforms, high-density GPU racks, hybrid cloud integration, AI workloads, sustainability-focused designs, and regional system integration, while Rest of Europe benefits from modular GPU infrastructure, AI adoption, green data centers, and scalable rack-level compute solutions.
List of Key Companies Profiled
- Super Micro Computer, Inc.
- Dell Technologies Inc.
- NVIDIA Corporation
- Quanta Computer Inc. (Quanta Cloud Technology)
- Hewlett Packard Enterprise Company
- Hon Hai Precision Industry Co., Ltd. (Foxconn and Ingrasys)
- Lenovo Group Limited
- IEIT Systems Co., Ltd.
- Giga Computing Technology Co., Ltd. (GIGABYTE)
- Wiwynn Corporation
Europe Rack-Scale GPU Infrastructure Market Report Segmentation
By End User
- Cloud Service Providers
- Enterprises
- Government and Research Institutions
- Telecommunications Providers
- Edge Infrastructure Operators
By Solution Type
- Compute Systems
- Networking Systems
- Cooling Systems
- Power Delivery Systems
By Deployment Scale
- Cluster-Scale AI Factory
- Multi-Rack Pod
- Single-Rack
By Cooling Architecture
- Air-Cooled Rack Infrastructure
- Direct-to-Chip Liquid-Cooled Rack Infrastructure
- Hybrid Cooling Rack Infrastructure
- Immersion-Cooled Rack Infrastructure
By Country
- Germany
- UK
- France
- Russia
- Spain
- Italy
- Rest of Europe
1.1 Market Overview
1.2 Key Factors Impacting Market
1.2.1 Market Drivers
1.2.2 Market Restraints
1.2.3 Market Opportunities
1.2.4 Market Challenges
1.2.5 Market Trends
1.2.6 State of Competition
1.2.7 Market Consolidation
1.2.8 Key Customer Criteria
1.3 Product Life Cycle
1.4 Segmentation By Deployment
1.4.1 Cloud
1.4.2 On-premise
1.5 Segmentation By Type
1.5.1 Customer Relationship Management Software
1.5.2 Property Management Software
1.5.3 Enterprise Resource Planning Software
1.5.4 Contract Software
1.5.5 Other Type
1.6 Segmentation By Application
1.6.1 Residential
1.6.2 Commercial
1.7 Segmentation By End Use
1.7.1 Architects & Engineers
1.7.2 Real Estate Agents
1.7.3 Project Managers
1.7.4 Other End Use
1.8 Segmentation By Country
1.8.1 Germany
1.8.1.1 Segmentation By Deployment
1.8.1.1.1 Cloud
1.8.1.1.2 On-Premise
1.8.1.2 Segmentation By Type
1.8.1.2.1 Customer Relationship Management Software
1.8.1.2.2 Property Management Software
1.8.1.2.3 Enterprise Resource Planning Software
1.8.1.2.4 Contract Software
1.8.1.2.5 Other Type
1.8.1.3 Segmentation By Application
1.8.1.3.1 Residential
1.8.1.3.2 Commercial
1.8.1.4 Segmentation By End Use
1.8.1.4.1 Architects & Engineers
1.8.1.4.2 Real Estate Agents
1.8.1.4.3 Project Managers
1.8.1.4.4 Other End Use
1.8.2 UK
1.8.2.1 Segmentation By Deployment
1.8.2.1.1 Cloud
1.8.2.1.2 On-Premise
1.8.2.2 Segmentation By Type
1.8.2.2.1 Customer Relationship Management Software
1.8.2.2.2 Property Management Software
1.8.2.2.3 Enterprise Resource Planning Software
1.8.2.2.4 Contract Software
1.8.2.2.5 Other Type
1.8.2.3 Segmentation By Application
1.8.2.3.1 Residential
1.8.2.3.2 Commercial
1.8.2.4 Segmentation By End Use
1.8.2.4.1 Architects & Engineers
1.8.2.4.2 Real Estate Agents
1.8.2.4.3 Project Managers
1.8.2.4.4 Other End Use
1.8.3 France
1.8.3.1 Segmentation By Deployment
1.8.3.1.1 Cloud
1.8.3.1.2 On-Premise
1.8.3.2 Segmentation By Type
1.8.3.2.1 Customer Relationship Management Software
1.8.3.2.2 Property Management Software
1.8.3.2.3 Enterprise Resource Planning Software
1.8.3.2.4 Contract Software
1.8.3.2.5 Other Type
1.8.3.3 Segmentation By Application
1.8.3.3.1 Residential
1.8.3.3.2 Commercial
1.8.3.4 Segmentation By End Use
1.8.3.4.1 Architects & Engineers
1.8.3.4.2 Real Estate Agents
1.8.3.4.3 Project Managers
1.8.3.4.4 Other End Use
1.8.4 Russia
1.8.4.1 Segmentation By Deployment
1.8.4.1.1 Cloud
1.8.4.1.2 On-Premise
1.8.4.2 Segmentation By Type
1.8.4.2.1 Customer Relationship Management Software
1.8.4.2.2 Property Management Software
1.8.4.2.3 Enterprise Resource Planning Software
1.8.4.2.4 Contract Software
1.8.4.2.5 Other Type
1.8.4.3 Segmentation By Application
1.8.4.3.1 Residential
1.8.4.3.2 Commercial
1.8.4.4 Segmentation By End Use
1.8.4.4.1 Architects & Engineers
1.8.4.4.2 Real Estate Agents
1.8.4.4.3 Project Managers
1.8.4.4.4 Other End Use
1.8.5 Spain
1.8.5.1 Segmentation By Deployment
1.8.5.1.1 Cloud
1.8.5.1.2 On-Premise
1.8.5.2 Segmentation By Type
1.8.5.2.1 Customer Relationship Management Software
1.8.5.2.2 Property Management Software
1.8.5.2.3 Enterprise Resource Planning Software
1.8.5.2.4 Contract Software
1.8.5.2.5 Other Type
1.8.5.3 Segmentation By Application
1.8.5.3.1 Residential
1.8.5.3.2 Commercial
1.8.5.4 Segmentation By End Use
1.8.5.4.1 Architects & Engineers
1.8.5.4.2 Real Estate Agents
1.8.5.4.3 Project Managers
1.8.5.4.4 Other End Use
1.8.6 Italy
1.8.6.1 Segmentation By Deployment
1.8.6.1.1 Cloud
1.8.6.1.2 On-Premise
1.8.6.2 Segmentation By Type
1.8.6.2.1 Customer Relationship Management Software
1.8.6.2.2 Property Management Software
1.8.6.2.3 Enterprise Resource Planning Software
1.8.6.2.4 Contract Software
1.8.6.2.5 Other Type
1.8.6.3 Segmentation By Application
1.8.6.3.1 Residential
1.8.6.3.2 Commercial
1.8.6.4 Segmentation By End Use
1.8.6.4.1 Architects & Engineers
1.8.6.4.2 Real Estate Agents
1.8.6.4.3 Project Managers
1.8.6.4.4 Other End Use
1.8.7 Rest of Europe
1.8.7.1 Segmentation By Deployment
1.8.7.1.1 Cloud
1.8.7.1.2 On-Premise
1.8.7.2 Segmentation By Type
1.8.7.2.1 Customer Relationship Management Software
1.8.7.2.2 Property Management Software
1.8.7.2.3 Enterprise Resource Planning Software
1.8.7.2.4 Contract Software
1.8.7.2.5 Other Type
1.8.7.3 Segmentation By Application
1.8.7.3.1 Residential
1.8.7.3.2 Commercial
1.8.7.4 Segmentation By End Use
1.8.7.4.1 Architects & Engineers
1.8.7.4.2 Real Estate Agents
1.8.7.4.3 Project Managers
1.8.7.4.4 Other End Use
Chapter 2. Company Snapshots
2.1 RealPage, Inc.
2.1.1 Business Overview
2.1.2 Key Information
2.1.3 Company Focus on Real Estate Software Market
2.1.4 Strategic Insights
2.1.5 Strategy Deployed
2.1.6 Product & Service Portfolio
2.1.7 Capability Overview
2.1.8 Technology & Innovation Focus
2.1.9 SWOT Analysis
2.1.10 Customers / End Users
2.1.11 Competitive Positioning
2.1.12 Key Differentiators
2.1.13 Portfolio Matrix
2.1.14 Analyst View
2.1.15 Future Outlook for Real Estate Software Market
2.2 Yardi Systems, Inc.
2.2.1 Business Overview
2.2.2 Key Information
2.2.3 Company Focus on Real Estate Software Market
2.2.4 Strategic Insights on Real Estate Software Market
2.2.5 Strategy Deployed for Real Estate Software Market
2.2.6 Product & Service Portfolio
2.2.7 Portfolio Categories
2.2.8 Capability Overview
2.2.9 Technology & Innovation Focus
2.2.10 SWOT Analysis
2.2.11 Customers / End Users
2.2.12 Competitive Positioning
2.2.13 Key Differentiators
2.2.14 Portfolio Matrix
2.2.15 Analyst View
2.2.16 Future Outlook
2.3 CoStar Group, Inc.
2.3.1 Business Overview
2.3.2 Key Information
2.3.3 Company Focus on Real Estate Software Market
2.3.4 Strategic Insights on Real Estate Software Market
2.3.5 Strategy Deployed for Real Estate Software Market
2.3.6 Product & Service Portfolio
2.3.7 Capability Overview
2.3.8 Technology & Innovation Focus
2.3.9 SWOT Analysis
2.3.10 Customers / End Users
2.3.11 Competitive Positioning
2.3.12 Key Differentiators
2.3.13 Portfolio Matrix
2.3.14 Analyst View
2.3.15 Future Outlook
2.4 AppFolio, Inc.
2.4.1 Business Overview
2.4.2 Key Information
2.4.3 Company Focus on Real Estate Software Market
2.4.4 Strategic Insights on Real Estate Software Market
2.4.5 Strategy Deployed for Real Estate Software Market
2.4.6 Product & Service Portfolio
2.4.7 Capability Overview
2.4.8 Technology & Innovation Focus
2.4.9 SWOT Analysis
2.4.10 Customers / End Users
2.4.11 Competitive Positioning
2.4.12 Key Differentiators
2.4.13 Portfolio Matrix
2.4.14 Analyst View
2.4.15 Future Outlook
2.4.16 MRI Software LLC
2.4.17 Business Overview
2.4.18 Key Information
2.4.19 Company Focus on Real Estate Software Market
2.4.20 Strategic Insights
2.4.21 Strategy Deployed for Real Estate Software Market
2.4.22 Product & Service Portfolio
2.4.23 Portfolio Categories
2.4.24 Capability Overview
2.4.25 Technology & Innovation Focus
2.4.26 SWOT Analysis
2.4.27 Customers / End Users
2.4.28 Competitive Positioning
2.4.29 Key Differentiators
2.5 Portfolio Matrix
2.5.1 Analyst View
2.5.2 Future Outlook for Real Estate Software Market
2.6 Aareon AG
2.6.1 Business Overview
2.6.2 Key Information
2.6.3 Company Focus on Real Estate Software Market
2.6.4 Strategic Insights on Real Estate Software Market 2.6.5 Strategy Deployed for Real Estate Software Market
2.6.6 Product & Service Portfolio
2.6.7 Capability Overview
2.6.8 Technology & Innovation Focus
2.6.9 SWOT Analysis
2.6.10 Customers / End Users
2.6.11 Competitive Positioning
2.6.12 Key Differentiators
2.6.13 Portfolio Matrix
2.6.14 Analyst View
2.6.15 Future Outlook for Real Estate Software Market
2.7 Entrata, Inc.
2.7.1 Business Overview
2.7.2 Key Information
2.7.3 Company Focus on Real Estate Software Market
2.7.4 Strategic Insights
2.7.5 Strategy Deployed
2.7.6 Product & Service Portfolio
2.7.7 Capability Overview
2.7.8 Technology & Innovation Focus
2.7.9 SWOT Analysis
2.7.10 Customers / End Users
2.7.11 Competitive Positioning
2.7.12 Key Differentiators
2.7.13 Portfolio Matrix
2.7.14 Analyst View
2.7.15 Future Outlook for Real Estate Software Market
2.8 Constellation Software Inc.
2.8.1 Business Overview
2.8.2 Key Information
2.8.3 Company Focus on Real Estate Software Market
2.8.4 Strategic Insights on Real Estate Software Market
2.8.5 Strategy Deployed for Real Estate Software Market
2.8.6 Product & Service Portfolio
2.8.7 Capability Overview
2.8.8 Technology & Innovation Focus
2.8.9 SWOT Analysis
2.8.10 Customers / End Users
2.8.11 Competitive Positioning
2.8.12 Key Differentiators
2.8.13 Portfolio Matrix
2.8.14 Analyst View
2.8.15 Future Outlook
2.9 Buildium LLC
2.9.1 Business Overview
2.9.2 Key Information
2.9.3 Company Focus on Real Estate Software Market
2.9.4 Strategic Insights
2.9.5 Strategy Deployed
2.9.6 Product & Service Portfolio
2.9.7 Capability Overview
2.9.8 Technology & Innovation Focus
2.9.9 SWOT Analysis
2.9.10 Customers / End Users
2.9.11 Competitive Positioning
2.9.12 Key Differentiators
2.9.13 Portfolio Matrix
2.9.14 Analyst View
2.9.15 Future Outlook
2.10 Altus Group Limited
2.10.1 Business Overview
2.10.2 Key Information
2.10.3 Company Focus on Real Estate Software Market
2.10.4 Strategic Insights
2.10.5 Strategy Deployed
2.10.6 Product & Service Portfolio
2.10.7 Capability Overview
2.10.8 Technology & Innovation Focus
2.10.9 SWOT Analysis
2.10.10 Customers / End Users
2.10.11 Competitive Positioning
2.10.12 Key Differentiators
2.10.13 Portfolio Matrix
2.10.14 Analyst View
2.10.15 Future Outlook
Table 1 Europe Real Estate Software Market Market, 2022 - 2033, USD Million
Table 2 Europe Real Estate Software Market Market by Application, 2022 - 2033, USD Million
Table 3 Europe Commercial Market, 2022 - 2033, USD Million
Table 4 Europe Residential Market, 2022 - 2033, USD Million
Table 5 Europe Real Estate Software Market Market by Deployment, 2022 - 2033, USD Million
Table 6 Europe Cloud Market, 2022 - 2033, USD Million
Table 7 Europe On-premise Market, 2022 - 2033, USD Million
Table 8 Europe Real Estate Software Market Market by End Use, 2022 - 2033, USD Million
Table 9 Europe Architects & Engineers Market, 2022 - 2033, USD Million
Table 10 Europe Other End Use Market, 2022 - 2033, USD Million
Table 11 Europe Project Managers Market, 2022 - 2033, USD Million
Table 12 Europe Real Estate Agents Market, 2022 - 2033, USD Million
Table 13 Europe Real Estate Software Market Market by Type, 2022 - 2033, USD Million
Table 14 Europe Contract Software Market, 2022 - 2033, USD Million
Table 15 Europe Customer Relationship Management Software Market, 2022 - 2033, USD Million
Table 16 Europe Enterprise Resource Planning Software Market, 2022 - 2033, USD Million
Table 17 Europe Other Type Market, 2022 - 2033, USD Million
Table 18 Europe Property Management Software Market, 2022 - 2033, USD Million
Table 19 Germany Real Estate Software Market Market, 2022 - 2033, USD Million
Table 20 Germany Real Estate Software Market Market by Application, 2022 - 2033, USD Million
Table 21 Germany Commercial Market, 2022 - 2033, USD Million
Table 22 Germany Residential Market, 2022 - 2033, USD Million
Table 23 Germany Real Estate Software Market Market by Deployment, 2022 - 2033, USD Million
Table 24 Germany Cloud Market, 2022 - 2033, USD Million
Table 25 Germany On-premise Market, 2022 - 2033, USD Million
Table 26 Germany Real Estate Software Market Market by End Use, 2022 - 2033, USD Million
Table 27 Germany Architects & Engineers Market, 2022 - 2033, USD Million
Table 28 Germany Other End Use Market, 2022 - 2033, USD Million
Table 29 Germany Project Managers Market, 2022 - 2033, USD Million
Table 30 Germany Real Estate Agents Market, 2022 - 2033, USD Million
Table 31 Germany Real Estate Software Market Market by Type, 2022 - 2033, USD Million
Table 32 Germany Contract Software Market, 2022 - 2033, USD Million
Table 33 Germany Customer Relationship Management Software Market, 2022 - 2033, USD Million
Table 34 Germany Enterprise Resource Planning Software Market, 2022 - 2033, USD Million
Table 35 Germany Other Type Market, 2022 - 2033, USD Million
Table 36 Germany Property Management Software Market, 2022 - 2033, USD Million
Table 37 United Kingdom Real Estate Software Market Market, 2022 - 2033, USD Million
Table 38 United Kingdom Real Estate Software Market Market by Application, 2022 - 2033, USD Million
Table 39 United Kingdom Commercial Market, 2022 - 2033, USD Million
Table 40 United Kingdom Residential Market, 2022 - 2033, USD Million
Table 41 United Kingdom Real Estate Software Market Market by Deployment, 2022 - 2033, USD Million
Table 42 United Kingdom Cloud Market, 2022 - 2033, USD Million
Table 43 United Kingdom On-premise Market, 2022 - 2033, USD Million
Table 44 United Kingdom Real Estate Software Market Market by End Use, 2022 - 2033, USD Million
Table 45 United Kingdom Architects & Engineers Market, 2022 - 2033, USD Million
Table 46 United Kingdom Other End Use Market, 2022 - 2033, USD Million
Table 47 United Kingdom Project Managers Market, 2022 - 2033, USD Million
Table 48 United Kingdom Real Estate Agents Market, 2022 - 2033, USD Million
Table 49 United Kingdom Real Estate Software Market Market by Type, 2022 - 2033, USD Million
Table 50 United Kingdom Contract Software Market, 2022 - 2033, USD Million
Table 51 United Kingdom Customer Relationship Management Software Market, 2022 - 2033, USD Million
Table 52 United Kingdom Enterprise Resource Planning Software Market, 2022 - 2033, USD Million
Table 53 United Kingdom Other Type Market, 2022 - 2033, USD Million
Table 54 United Kingdom Property Management Software Market, 2022 - 2033, USD Million
Table 55 France Real Estate Software Market Market, 2022 - 2033, USD Million
Table 56 France Real Estate Software Market Market by Application, 2022 - 2033, USD Million
Table 57 France Commercial Market, 2022 - 2033, USD Million
Table 58 France Residential Market, 2022 - 2033, USD Million
Table 59 France Real Estate Software Market Market by Deployment, 2022 - 2033, USD Million
Table 60 France Cloud Market, 2022 - 2033, USD Million
Table 61 France On-premise Market, 2022 - 2033, USD Million
Table 62 France Real Estate Software Market Market by End Use, 2022 - 2033, USD Million
Table 63 France Architects & Engineers Market, 2022 - 2033, USD Million
Table 64 France Other End Use Market, 2022 - 2033, USD Million
Table 65 France Project Managers Market, 2022 - 2033, USD Million
Table 66 France Real Estate Agents Market, 2022 - 2033, USD Million
Table 67 France Real Estate Software Market Market by Type, 2022 - 2033, USD Million
Table 68 France Contract Software Market, 2022 - 2033, USD Million
Table 69 France Customer Relationship Management Software Market, 2022 - 2033, USD Million
Table 70 France Enterprise Resource Planning Software Market, 2022 - 2033, USD Million
Table 71 France Other Type Market, 2022 - 2033, USD Million
Table 72 France Property Management Software Market, 2022 - 2033, USD Million
Table 73 Russia Real Estate Software Market Market, 2022 - 2033, USD Million
Table 74 Russia Real Estate Software Market Market by Application, 2022 - 2033, USD Million
Table 75 Russia Commercial Market, 2022 - 2033, USD Million
Table 76 Russia Residential Market, 2022 - 2033, USD Million
Table 77 Russia Real Estate Software Market Market by Deployment, 2022 - 2033, USD Million
Table 78 Russia Cloud Market, 2022 - 2033, USD Million
Table 79 Russia On-premise Market, 2022 - 2033, USD Million
Table 80 Russia Real Estate Software Market Market by End Use, 2022 - 2033, USD Million
Table 81 Russia Architects & Engineers Market, 2022 - 2033, USD Million
Table 82 Russia Other End Use Market, 2022 - 2033, USD Million
Table 83 Russia Project Managers Market, 2022 - 2033, USD Million
Table 84 Russia Real Estate Agents Market, 2022 - 2033, USD Million
Table 85 Russia Real Estate Software Market Market by Type, 2022 - 2033, USD Million
Table 86 Russia Contract Software Market, 2022 - 2033, USD Million
Table 87 Russia Customer Relationship Management Software Market, 2022 - 2033, USD Million
Table 88 Russia Enterprise Resource Planning Software Market, 2022 - 2033, USD Million
Table 89 Russia Other Type Market, 2022 - 2033, USD Million
Table 90 Russia Property Management Software Market, 2022 - 2033, USD Million
Table 91 Spain Real Estate Software Market Market, 2022 - 2033, USD Million
Table 92 Spain Real Estate Software Market Market by Application, 2022 - 2033, USD Million
Table 93 Spain Commercial Market, 2022 - 2033, USD Million
Table 94 Spain Residential Market, 2022 - 2033, USD Million
Table 95 Spain Real Estate Software Market Market by Deployment, 2022 - 2033, USD Million
Table 96 Spain Cloud Market, 2022 - 2033, USD Million
Table 97 Spain On-premise Market, 2022 - 2033, USD Million
Table 98 Spain Real Estate Software Market Market by End Use, 2022 - 2033, USD Million
Table 99 Spain Architects & Engineers Market, 2022 - 2033, USD Million
Table 100 Spain Other End Use Market, 2022 - 2033, USD Million
Table 101 Spain Project Managers Market, 2022 - 2033, USD Million
Table 102 Spain Real Estate Agents Market, 2022 - 2033, USD Million
Table 103 Spain Real Estate Software Market Market by Type, 2022 - 2033, USD Million
Table 104 Spain Contract Software Market, 2022 - 2033, USD Million
Table 105 Spain Customer Relationship Management Software Market, 2022 - 2033, USD Million
Table 106 Spain Enterprise Resource Planning Software Market, 2022 - 2033, USD Million
Table 107 Spain Other Type Market, 2022 - 2033, USD Million
Table 108 Spain Property Management Software Market, 2022 - 2033, USD Million
Table 109 Italy Real Estate Software Market Market, 2022 - 2033, USD Million
Table 110 Italy Real Estate Software Market Market by Application, 2022 - 2033, USD Million
Table 111 Italy Commercial Market, 2022 - 2033, USD Million
Table 112 Italy Residential Market, 2022 - 2033, USD Million
Table 113 Italy Real Estate Software Market Market by Deployment, 2022 - 2033, USD Million
Table 114 Italy Cloud Market, 2022 - 2033, USD Million
Table 115 Italy On-premise Market, 2022 - 2033, USD Million
Table 116 Italy Real Estate Software Market Market by End Use, 2022 - 2033, USD Million
Table 117 Italy Architects & Engineers Market, 2022 - 2033, USD Million
Table 118 Italy Other End Use Market, 2022 - 2033, USD Million
Table 119 Italy Project Managers Market, 2022 - 2033, USD Million
Table 120 Italy Real Estate Agents Market, 2022 - 2033, USD Million
Table 121 Italy Real Estate Software Market Market by Type, 2022 - 2033, USD Million
Table 122 Italy Contract Software Market, 2022 - 2033, USD Million
Table 123 Italy Customer Relationship Management Software Market, 2022 - 2033, USD Million
Table 124 Italy Enterprise Resource Planning Software Market, 2022 - 2033, USD Million
Table 125 Italy Other Type Market, 2022 - 2033, USD Million
Table 126 Italy Property Management Software Market, 2022 - 2033, USD Million
Table 127 Rest of Europe Real Estate Software Market Market, 2022 - 2033, USD Million
Table 128 Rest of Europe Real Estate Software Market Market by Application, 2022 - 2033, USD Million
Table 129 Rest of Europe Commercial Market, 2022 - 2033, USD Million
Table 130 Rest of Europe Residential Market, 2022 - 2033, USD Million
Table 131 Rest of Europe Real Estate Software Market Market by Deployment, 2022 - 2033, USD Million
Table 132 Rest of Europe Cloud Market, 2022 - 2033, USD Million
Table 133 Rest of Europe On-premise Market, 2022 - 2033, USD Million
Table 134 Rest of Europe Real Estate Software Market Market by End Use, 2022 - 2033, USD Million
Table 135 Rest of Europe Architects & Engineers Market, 2022 - 2033, USD Million
Table 136 Rest of Europe Other End Use Market, 2022 - 2033, USD Million
Table 137 Rest of Europe Project Managers Market, 2022 - 2033, USD Million
Table 138 Rest of Europe Real Estate Agents Market, 2022 - 2033, USD Million
Table 139 Rest of Europe Real Estate Software Market Market by Type, 2022 - 2033, USD Million
Table 140 Rest of Europe Contract Software Market, 2022 - 2033, USD Million
Table 141 Rest of Europe Customer Relationship Management Software Market, 2022 - 2033, USD Million
Table 142 Rest of Europe Enterprise Resource Planning Software Market, 2022 - 2033, USD Million
Table 143 Rest of Europe Other Type Market, 2022 - 2033, USD Million
Table 144 Rest of Europe Property Management Software Market, 2022 - 2033, USD Million
List of Figures
FIG 1 Key Factors Impacting Market
FIG 2 Market Consolidation
FIG 3 Key Customer Criteria
FIG 4 Product Life Cycle
FIG 5 Europe Real Estate Software Market Market, 2022 - 2033, USD Million
FIG 6 Europe Real Estate Software Market Market by Application, 2022 - 2033, USD Million
FIG 7 Europe Commercial Market, 2022 - 2033, USD Million
FIG 8 Europe Residential Market, 2022 - 2033, USD Million
FIG 9 Europe Real Estate Software Market Market by Deployment, 2022 - 2033, USD Million
FIG 10 Europe Cloud Market, 2022 - 2033, USD Million
FIG 11 Europe On-premise Market, 2022 - 2033, USD Million
FIG 12 Europe Real Estate Software Market Market by End Use, 2022 - 2033, USD Million
FIG 13 Europe Architects & Engineers Market, 2022 - 2033, USD Million
FIG 14 Europe Other End Use Market, 2022 - 2033, USD Million
FIG 15 Europe Project Managers Market, 2022 - 2033, USD Million
FIG 16 Europe Real Estate Agents Market, 2022 - 2033, USD Million
FIG 17 Europe Real Estate Software Market Market by Type, 2022 - 2033, USD Million
FIG 18 Europe Contract Software Market, 2022 - 2033, USD Million
FIG 19 Europe Customer Relationship Management Software Market, 2022 - 2033, USD Million
FIG 20 Europe Enterprise Resource Planning Software Market, 2022 - 2033, USD Million
FIG 21 Europe Other Type Market, 2022 - 2033, USD Million
FIG 22 Europe Property Management Software Market, 2022 - 2033, USD Million
FIG 23 Germany Real Estate Software Market Market, 2022 - 2033, USD Million
FIG 24 Germany Real Estate Software Market Market by Application, 2022 - 2033, USD Million
FIG 25 Germany Commercial Market, 2022 - 2033, USD Million
FIG 26 Germany Residential Market, 2022 - 2033, USD Million
FIG 27 Germany Real Estate Software Market Market by Deployment, 2022 - 2033, USD Million
FIG 28 Germany Cloud Market, 2022 - 2033, USD Million
FIG 29 Germany On-premise Market, 2022 - 2033, USD Million
FIG 30 Germany Real Estate Software Market Market by End Use, 2022 - 2033, USD Million
FIG 31 Germany Architects & Engineers Market, 2022 - 2033, USD Million
FIG 32 Germany Other End Use Market, 2022 - 2033, USD Million
FIG 33 Germany Project Managers Market, 2022 - 2033, USD Million
FIG 34 Germany Real Estate Agents Market, 2022 - 2033, USD Million
FIG 35 Germany Real Estate Software Market Market by Type, 2022 - 2033, USD Million
FIG 36 Germany Contract Software Market, 2022 - 2033, USD Million
FIG 37 Germany Customer Relationship Management Software Market, 2022 - 2033, USD Million
FIG 38 Germany Enterprise Resource Planning Software Market, 2022 - 2033, USD Million
FIG 39 Germany Other Type Market, 2022 - 2033, USD Million
FIG 40 Germany Property Management Software Market, 2022 - 2033, USD Million
FIG 41 United Kingdom Real Estate Software Market Market, 2022 - 2033, USD Million
FIG 42 United Kingdom Real Estate Software Market Market by Application, 2022 - 2033, USD Million
FIG 43 United Kingdom Commercial Market, 2022 - 2033, USD Million
FIG 44 United Kingdom Residential Market, 2022 - 2033, USD Million
FIG 45 United Kingdom Real Estate Software Market Market by Deployment, 2022 - 2033, USD Million
FIG 46 United Kingdom Cloud Market, 2022 - 2033, USD Million
FIG 47 United Kingdom On-premise Market, 2022 - 2033, USD Million
FIG 48 United Kingdom Real Estate Software Market Market by End Use, 2022 - 2033, USD Million
FIG 49 United Kingdom Architects & Engineers Market, 2022 - 2033, USD Million
FIG 50 United Kingdom Other End Use Market, 2022 - 2033, USD Million
FIG 51 United Kingdom Project Managers Market, 2022 - 2033, USD Million
FIG 52 United Kingdom Real Estate Agents Market, 2022 - 2033, USD Million
FIG 53 United Kingdom Real Estate Software Market Market by Type, 2022 - 2033, USD Million
FIG 54 United Kingdom Contract Software Market, 2022 - 2033, USD Million
FIG 55 United Kingdom Customer Relationship Management Software Market, 2022 - 2033, USD Million
FIG 56 United Kingdom Enterprise Resource Planning Software Market, 2022 - 2033, USD Million
FIG 57 United Kingdom Other Type Market, 2022 - 2033, USD Million
FIG 58 United Kingdom Property Management Software Market, 2022 - 2033, USD Million
FIG 59 France Real Estate Software Market Market, 2022 - 2033, USD Million
FIG 60 France Real Estate Software Market Market by Application, 2022 - 2033, USD Million
FIG 61 France Commercial Market, 2022 - 2033, USD Million
FIG 62 France Residential Market, 2022 - 2033, USD Million
FIG 63 France Real Estate Software Market Market by Deployment, 2022 - 2033, USD Million
FIG 64 France Cloud Market, 2022 - 2033, USD Million
FIG 65 France On-premise Market, 2022 - 2033, USD Million
FIG 66 France Real Estate Software Market Market by End Use, 2022 - 2033, USD Million
FIG 67 France Architects & Engineers Market, 2022 - 2033, USD Million
FIG 68 France Other End Use Market, 2022 - 2033, USD Million
FIG 69 France Project Managers Market, 2022 - 2033, USD Million
FIG 70 France Real Estate Agents Market, 2022 - 2033, USD Million
FIG 71 France Real Estate Software Market Market by Type, 2022 - 2033, USD Million
FIG 72 France Contract Software Market, 2022 - 2033, USD Million
FIG 73 France Customer Relationship Management Software Market, 2022 - 2033, USD Million
FIG 74 France Enterprise Resource Planning Software Market, 2022 - 2033, USD Million
FIG 75 France Other Type Market, 2022 - 2033, USD Million
FIG 76 France Property Management Software Market, 2022 - 2033, USD Million
FIG 77 Russia Real Estate Software Market Market, 2022 - 2033, USD Million
FIG 78 Russia Real Estate Software Market Market by Application, 2022 - 2033, USD Million
FIG 79 Russia Commercial Market, 2022 - 2033, USD Million
FIG 80 Russia Residential Market, 2022 - 2033, USD Million
FIG 81 Russia Real Estate Software Market Market by Deployment, 2022 - 2033, USD Million
FIG 82 Russia Cloud Market, 2022 - 2033, USD Million
FIG 83 Russia On-premise Market, 2022 - 2033, USD Million
FIG 84 Russia Real Estate Software Market Market by End Use, 2022 - 2033, USD Million
FIG 85 Russia Architects & Engineers Market, 2022 - 2033, USD Million
FIG 86 Russia Other End Use Market, 2022 - 2033, USD Million
FIG 87 Russia Project Managers Market, 2022 - 2033, USD Million
FIG 88 Russia Real Estate Agents Market, 2022 - 2033, USD Million
FIG 89 Russia Real Estate Software Market Market by Type, 2022 - 2033, USD Million
FIG 90 Russia Contract Software Market, 2022 - 2033, USD Million
FIG 91 Russia Customer Relationship Management Software Market, 2022 - 2033, USD Million
FIG 92 Russia Enterprise Resource Planning Software Market, 2022 - 2033, USD Million
FIG 93 Russia Other Type Market, 2022 - 2033, USD Million
FIG 94 Russia Property Management Software Market, 2022 - 2033, USD Million
FIG 95 Spain Real Estate Software Market Market, 2022 - 2033, USD Million
FIG 96 Spain Real Estate Software Market Market by Application, 2022 - 2033, USD Million
FIG 97 Spain Commercial Market, 2022 - 2033, USD Million
FIG 98 Spain Residential Market, 2022 - 2033, USD Million FIG 99 Spain Real Estate Software Market Market by Deployment, 2022 - 2033, USD Million
FIG 100 Spain Cloud Market, 2022 - 2033, USD Million
FIG 101 Spain On-premise Market, 2022 - 2033, USD Million
FIG 102 Spain Real Estate Software Market Market by End Use, 2022 - 2033, USD Million
FIG 103 Spain Architects & Engineers Market, 2022 - 2033, USD Million
FIG 104 Spain Other End Use Market, 2022 - 2033, USD Million
FIG 105 Spain Project Managers Market, 2022 - 2033, USD Million
FIG 106 Spain Real Estate Agents Market, 2022 - 2033, USD Million
FIG 107 Spain Real Estate Software Market Market by Type, 2022 - 2033, USD Million
FIG 108 Spain Contract Software Market, 2022 - 2033, USD Million
FIG 109 Spain Customer Relationship Management Software Market, 2022 - 2033, USD Million
FIG 110 Spain Enterprise Resource Planning Software Market, 2022 - 2033, USD Million
FIG 111 Spain Other Type Market, 2022 - 2033, USD Million
FIG 112 Spain Property Management Software Market, 2022 - 2033, USD Million
FIG 113 Italy Real Estate Software Market Market, 2022 - 2033, USD Million
FIG 114 Italy Real Estate Software Market Market by Application, 2022 - 2033, USD Million
FIG 115 Italy Commercial Market, 2022 - 2033, USD Million
FIG 116 Italy Residential Market, 2022 - 2033, USD Million
FIG 117 Italy Real Estate Software Market Market by Deployment, 2022 - 2033, USD Million
FIG 118 Italy Cloud Market, 2022 - 2033, USD Million
FIG 119 Italy On-premise Market, 2022 - 2033, USD Million
FIG 120 Italy Real Estate Software Market Market by End Use, 2022 - 2033, USD Million
FIG 121 Italy Architects & Engineers Market, 2022 - 2033, USD Million
FIG 122 Italy Other End Use Market, 2022 - 2033, USD Million
FIG 123 Italy Project Managers Market, 2022 - 2033, USD Million
FIG 124 Italy Real Estate Agents Market, 2022 - 2033, USD Million
FIG 125 Italy Real Estate Software Market Market by Type, 2022 - 2033, USD Million
FIG 126 Italy Contract Software Market, 2022 - 2033, USD Million
FIG 127 Italy Customer Relationship Management Software Market, 2022 - 2033, USD Million
FIG 128 Italy Enterprise Resource Planning Software Market, 2022 - 2033, USD Million
FIG 129 Italy Other Type Market, 2022 - 2033, USD Million
FIG 130 Italy Property Management Software Market, 2022 - 2033, USD Million
FIG 131 Rest of Europe Real Estate Software Market Market, 2022 - 2033, USD Million
FIG 132 Rest of Europe Real Estate Software Market Market by Application, 2022 - 2033, USD Million
FIG 133 Rest of Europe Commercial Market, 2022 - 2033, USD Million
FIG 134 Rest of Europe Residential Market, 2022 - 2033, USD Million
FIG 135 Rest of Europe Real Estate Software Market Market by Deployment, 2022 - 2033, USD Million
FIG 136 Rest of Europe Cloud Market, 2022 - 2033, USD Million
FIG 137 Rest of Europe On-premise Market, 2022 - 2033, USD Million
FIG 138 Rest of Europe Real Estate Software Market Market by End Use, 2022 - 2033, USD Million
FIG 139 Rest of Europe Architects & Engineers Market, 2022 - 2033, USD Million
FIG 140 Rest of Europe Other End Use Market, 2022 - 2033, USD Million
FIG 141 Rest of Europe Project Managers Market, 2022 - 2033, USD Million
FIG 142 Rest of Europe Real Estate Agents Market, 2022 - 2033, USD Million
FIG 143 Rest of Europe Real Estate Software Market Market by Type, 2022 - 2033, USD Million
FIG 144 Rest of Europe Contract Software Market, 2022 - 2033, USD Million
FIG 145 Rest of Europe Customer Relationship Management Software Market, 2022 - 2033, USD Million
FIG 146 Rest of Europe Enterprise Resource Planning Software Market, 2022 - 2033, USD Million
FIG 147 Rest of Europe Other Type Market, 2022 - 2033, USD Million
FIG 148 Rest of Europe Property Management Software Market, 2022 - 2033, USD Million