Europe Quick Commerce Market Size, Share & Industry Analysis Report By Delivery (Instant Delivery, and Scheduled Delivery), By Delivery Payment (Online, and Cash), By Product Category (Grocery & Staples, Personal Care & Beauty, Pharmacy / Health & Wellness, and Packaged Food & Snacks), By Country Outlook and Forecast, 2026 - 2033
Published Date : 02-Sep-2026 |
Pages: 265 |
Report Format: PDF + Excel |
COVID-19 Impact on the Europe Quick Commerce Market
The Europe Quick Commerce Market is expected to reach USD 139.9 billion by 2031, growing at a CAGR of 20.6% during (2026 – 2033).
The Europe Quick Commerce Market developed from the expansion of online retail and same-day delivery models as consumers began expecting faster access to groceries, essentials, and daily-use products. Early quick commerce services were mainly pilot projects supported by localized warehouses, mobile ordering platforms, and basic urban delivery networks. Over time, GPS tracking, real-time inventory visibility, app-based payments, AI analytics, and route optimization improved fulfillment speed and delivery accuracy. The rise of dark stores and micro-fulfillment centers near dense urban areas marked a major shift in the market. Today, the market reflects a structured urban retail ecosystem built around convenience, rapid fulfillment, and localized delivery infrastructure.
The current Europe Quick Commerce Market is shaped by hyperlocal fulfillment, AI-driven logistics, regulatory scrutiny, sustainability goals, and omnichannel retail integration. Companies are moving inventory closer to customers through dark stores, neighborhood hubs, and micro-distribution centers to reduce delivery distances and improve service reliability. AI and machine learning are being used for demand forecasting, route planning, dynamic inventory allocation, and personalized shopping experiences. Operators are also adopting electric bikes, low-emission fleets, recyclable packaging, and localized partnerships to meet European consumer and regulatory expectations. These trends are moving the market toward faster, greener, data-driven, and city-focused quick commerce models.
Delivery Outlook
Based on Delivery, the market is segmented into Instant Delivery and Scheduled Delivery. The Instant market dominated the Europe Quick Commerce Market by Delivery in 2025, and would continue to be a dominant market till 2033; thereby, achieving a market value of USD 100.8 billion by 2031, growing at a CAGR of 20.2 % during the forecast period. The Scheduled market is expected to witness a CAGR of 21.7% during (2026 - 2033).
Instant delivery leads due to strong consumer preference for ultra-fast fulfillment of groceries, daily essentials, snacks, pharmacy products, and household items. This segment is supported by dark stores, micro-fulfillment centers, app-based ordering, real-time tracking, and electric micro-mobility delivery fleets across major cities. Scheduled delivery is gaining importance among customers who prefer planned grocery purchases, flexible time slots, and reliable delivery for larger or less urgent orders. Retailers also benefit from scheduled delivery because it supports better route consolidation, order batching, delivery cost control, and operational efficiency.
Delivery Payment Outlook
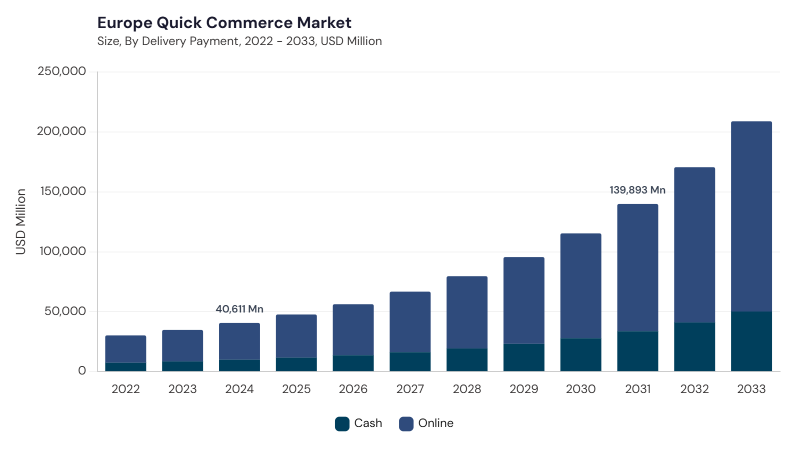
Based on Delivery Payment, the market is segmented into Online and Cash. The Online market dominated the Europe Quick Commerce Market by Delivery Payment in 2025, and would continue to be a dominant market till 2033; thereby, achieving a market value of USD 106.2 billion by 2031, growing at a CAGR of 20.7 % during the forecast period. The Cash market is expected to witness a CAGR of 20.4% during (2026 - 2033).
Online payment leads due to strong adoption of digital banking, contactless cards, mobile wallets, secure payment gateways, and app-based checkout across Europe. Digital payment supports faster order confirmation, smoother fulfillment, real-time transaction tracking, loyalty programs, and reduced cash-handling complexity for delivery operators. Cash remains relevant in selected markets and among consumer groups that prefer traditional payment methods or are less comfortable with digital transactions. However, cash adoption is comparatively smaller due to rising digital payment penetration, contactless delivery preferences, and operational challenges related to reconciliation and failed payments.
Product Category Outlook
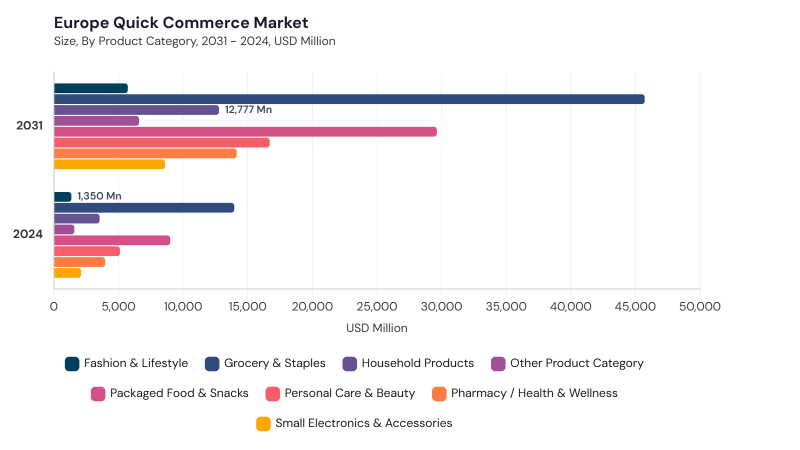
Based on Product Category, the market is segmented into Grocery & Staples, Packaged Food & Snacks, Personal Care & Beauty, Pharmacy / Health & Wellness, Household Products, Small Electronics & Accessories, Fashion & Lifestyle, and Other Product Category. Grocery & Staples lead due to frequent household demand, daily replenishment needs, urban consumer convenience, and partnerships between quick commerce platforms and grocery retailers.
Packaged Food & Snacks benefit from impulse buying, ready-to-eat consumption, and rapid availability through quick delivery platforms. Personal Care & Beauty and Pharmacy / Health & Wellness are expanding through demand for daily essentials, wellness products, grooming items, and urgent non-prescription health products. Household Products, Small Electronics & Accessories, Fashion & Lifestyle, and Other Product Category add diversification as platforms expand beyond essentials into broader retail and lifestyle assortments.
Free Valuable Insights: The Worldwide Quick Commerce Market is projected to reach USD 984.7 Billion billion by 2033, at a CAGR of 20.9%
Country Outlook
Based on Country, the market is segmented into Germany, UK, France, Russia, Spain, Italy, and Rest of Europe. The UK market dominated the Europe Quick Commerce Market by Country in 2025, and would continue to be a dominant market till 2033; thereby, achieving a market value of USD 27.7 million by 2031, growing at a CAGR of 19 % during the forecast period. The Germany market is expected to witness a CAGR of 19.6% during (2026 - 2033). Additionally, The France market is expected to witness a CAGR of 21.4% during (2026 - 2033).
Germany leads due to its strong e-commerce base, dense urban centers, advanced fulfillment infrastructure, AI-enabled logistics adoption, and high consumer expectations for reliable delivery. The UK supports growth through mobile commerce, urban micro-fulfillment centers, AI-based route optimization, and demand for fast delivery across groceries and convenience products. France contributes through dark store networks, sustainability-focused logistics, AI-enabled inventory management, and partnerships with retailers and local suppliers. Russia, Spain, and Italy add demand through urban digital adoption, hyperlocal delivery models, rapid grocery delivery, and expanding platform partnerships, while Rest of Europe benefits from warehouse automation, digital payment growth, and localized quick commerce services.
List of Key Companies Profiled
- Meituan
- Alibaba Group Holding Limited
- JD.com, Inc.
- DoorDash, Inc.
- Delivery Hero SE
- Uber Technologies, Inc.
- Zomato Ltd.
- Swiggy Ltd.
- Zepto
- Grab Holdings Limited
Europe Quick Commerce Market Report Segmentation
By Delivery
- Instant
- Scheduled
By Delivery Payment
- Online
- Cash
By Product Category
- Grocery & Staples
- Packaged Food & Snacks
- Personal Care & Beauty
- Pharmacy / Health & Wellness
- Household Products
- Small Electronics & Accessories
- Fashion & Lifestyle
- Other Product Category
By Country
- Germany
- UK
- France
- Russia
- Spain
- Italy
- Rest of Europe
1.1 Market Overview
1.2 Key Factors Impacting Market
1.2.1 Market Drivers
1.2.2 Market Restraints
1.2.3 Market Opportunities
1.2.4 Market Challenges
1.2.5 Market Trends
1.2.6 State of Competition
1.2.7 Market Consolidation
1.2.8 Key Customer Criteria
1.3 Product Life Cycle
1.4 Segmentation By End User
1.4.1 Cloud Service Providers
1.4.2 Enterprises
1.4.3 Government and Research Institutions
1.4.4 Telecommunications Providers
1.4.5 Edge Infrastructure Operators
1.5 Segmentation By Solution Type
1.5.1 Compute Systems
1.5.2 Networking Systems
1.5.3 Cooling Systems
1.5.4 Power Delivery Systems
1.6 Segmentation By Deployment Scale
1.6.1 Single-Rack
1.6.2 Multi-Rack Pod
1.6.3 Cluster-Scale AI Factory
1.7 Segmentation By Cooling Architecture
1.7.1 Air-Cooled Rack Infrastructure
1.7.2 Direct-to-Chip Liquid-Cooled Rack Infrastructure
1.7.3 Hybrid Cooling Rack Infrastructure
1.7.4 Immersion-Cooled Rack Infrastructure
1.8 Segmentation By Country
1.8.1 Germany
1.8.1.1 Segmentation By End User
1.8.1.1.1 Cloud Service Providers
1.8.1.1.2 Enterprises
1.8.1.1.3 Government and Research Institutions
1.8.1.1.4 Telecommunications Providers
1.8.1.1.5 Edge Infrastructure Operators
1.8.1.2 Segmentation By Solution Type
1.8.1.2.1 Compute Systems
1.8.1.2.2 Networking Systems
1.8.1.2.3 Cooling Systems
1.8.1.2.4 Power Delivery Systems
1.8.1.3 Segmentation By Deployment Scale
1.8.1.3.1 Single-Rack
1.8.1.3.2 Multi-Rack Pod
1.8.1.3.3 Cluster-Scale AI Factory
1.8.1.4 Segmentation By Cooling Architecture
1.8.1.4.1 Air-Cooled Rack Infrastructure
1.8.1.4.2 Direct-to-Chip Liquid-Cooled Rack Infrastructure
1.8.1.4.3 Hybrid Cooling Rack Infrastructure
1.8.1.4.4 Immersion-Cooled Rack Infrastructure
1.8.2 UK
1.8.2.1 Segmentation By End User
1.8.2.1.1 Cloud Service Providers
1.8.2.1.2 Enterprises
1.8.2.1.3 Government and Research Institutions
1.8.2.1.4 Telecommunications Providers
1.8.2.1.5 Edge Infrastructure Operators
1.8.2.2 Segmentation By Solution Type
1.8.2.2.1 Compute Systems
1.8.2.2.2 Networking Systems
1.8.2.2.3 Cooling Systems
1.8.2.2.4 Power Delivery Systems
1.8.2.3 Segmentation By Deployment Scale
1.8.2.3.1 Single-Rack
1.8.2.3.2 Multi-Rack Pod
1.8.2.3.3 Cluster-Scale AI Factory
1.8.2.4 Segmentation By Cooling Architecture
1.8.2.4.1 Air-Cooled Rack Infrastructure
1.8.2.4.2 Direct-to-Chip Liquid-Cooled Rack Infrastructure
1.8.2.4.3 Hybrid Cooling Rack Infrastructure
1.8.2.4.4 Immersion-Cooled Rack Infrastructure
1.8.3 France
1.8.3.1 Segmentation By End User
1.8.3.1.1 Cloud Service Providers
1.8.3.1.2 Enterprises
1.8.3.1.3 Government and Research Institutions
1.8.3.1.4 Telecommunications Providers
1.8.3.1.5 Edge Infrastructure Operators
1.8.3.2 Segmentation By Solution Type
1.8.3.2.1 Compute Systems
1.8.3.2.2 Networking Systems
1.8.3.2.3 Cooling Systems
1.8.3.2.4 Power Delivery Systems
1.8.3.3 Segmentation By Deployment Scale
1.8.3.3.1 Single-Rack
1.8.3.3.2 Multi-Rack Pod
1.8.3.3.3 Cluster-Scale AI Factory
1.8.3.4 Segmentation By Cooling Architecture
1.8.3.4.1 Air-Cooled Rack Infrastructure
1.8.3.4.2 Direct-to-Chip Liquid-Cooled Rack Infrastructure
1.8.3.4.3 Hybrid Cooling Rack Infrastructure
1.8.3.4.4 Immersion-Cooled Rack Infrastructure
1.8.4 Russia
1.8.4.1 Segmentation By End User
1.8.4.1.1 Cloud Service Providers
1.8.4.1.2 Enterprises
1.8.4.1.3 Government and Research Institutions
1.8.4.1.4 Telecommunications Providers
1.8.4.1.5 Edge Infrastructure Operators
1.8.4.2 Segmentation By Solution Type
1.8.4.2.1 Compute Systems
1.8.4.2.2 Networking Systems
1.8.4.2.3 Cooling Systems
1.8.4.2.4 Power Delivery Systems
1.8.4.3 Segmentation By Deployment Scale
1.8.4.3.1 Single-Rack
1.8.4.3.2 Multi-Rack Pod
1.8.4.3.3 Cluster-Scale AI Factory
1.8.4.4 Segmentation By Cooling Architecture
1.8.4.4.1 Air-Cooled Rack Infrastructure
1.8.4.4.2 Direct-to-Chip Liquid-Cooled Rack Infrastructure
1.8.4.4.3 Hybrid Cooling Rack Infrastructure
1.8.4.4.4 Immersion-Cooled Rack Infrastructure
1.8.5 Spain
1.8.5.1 Segmentation By End User
1.8.5.1.1 Cloud Service Providers
1.8.5.1.2 Enterprises
1.8.5.1.3 Government and Research Institutions
1.8.5.1.4 Telecommunications Providers
1.8.5.1.5 Edge Infrastructure Operators
1.8.5.2 Segmentation By Solution Type
1.8.5.2.1 Compute Systems
1.8.5.2.2 Networking Systems
1.8.5.2.3 Cooling Systems
1.8.5.2.4 Power Delivery Systems
1.8.5.3 Segmentation By Deployment Scale
1.8.5.3.1 Single-Rack
1.8.5.3.2 Multi-Rack Pod
1.8.5.3.3 Cluster-Scale AI Factory
1.8.5.4 Segmentation By Cooling Architecture
1.8.5.4.1 Air-Cooled Rack Infrastructure
1.8.5.4.2 Direct-to-Chip Liquid-Cooled Rack Infrastructure
1.8.5.4.3 Hybrid Cooling Rack Infrastructure
1.8.5.4.4 Immersion-Cooled Rack Infrastructure
1.8.6 Italy
1.8.6.1 Segmentation By End User
1.8.6.1.1 Cloud Service Providers
1.8.6.1.2 Enterprises
1.8.6.1.3 Government and Research Institutions
1.8.6.1.4 Telecommunications Providers
1.8.6.1.5 Edge Infrastructure Operators
1.8.6.2 Segmentation By Solution Type
1.8.6.2.1 Compute Systems
1.8.6.2.2 Networking Systems
1.8.6.2.3 Cooling Systems
1.8.6.2.4 Power Delivery Systems
1.8.6.3 Segmentation By Deployment Scale
1.8.6.3.1 Single-Rack
1.8.6.3.2 Multi-Rack Pod
1.8.6.3.3 Cluster-Scale AI Factory
1.8.6.4 Segmentation By Cooling Architecture
1.8.6.4.1 Air-Cooled Rack Infrastructure
1.8.6.4.2 Direct-to-Chip Liquid-Cooled Rack Infrastructure
1.8.6.4.3 Hybrid Cooling Rack Infrastructure
1.8.6.4.4 Immersion-Cooled Rack Infrastructure
1.8.7 Rest of Europe
1.8.7.1 Segmentation By End User
1.8.7.1.1 Cloud Service Providers
1.8.7.1.2 Enterprises
1.8.7.1.3 Government and Research Institutions
1.8.7.1.4 Telecommunications Providers
1.8.7.1.5 Edge Infrastructure Operators
1.8.7.2 Segmentation By Solution Type
1.8.7.2.1 Compute Systems
1.8.7.2.2 Networking Systems
1.8.7.2.3 Cooling Systems
1.8.7.2.4 Power Delivery Systems
1.8.7.3 Segmentation By Deployment Scale
1.8.7.3.1 Single-Rack
1.8.7.3.2 Multi-Rack Pod
1.8.7.3.3 Cluster-Scale AI Factory
1.8.7.4 Segmentation By Cooling Architecture
1.8.7.4.1 Air-Cooled Rack Infrastructure
1.8.7.4.2 Direct-to-Chip Liquid-Cooled Rack Infrastructure
1.8.7.4.3 Hybrid Cooling Rack Infrastructure
1.8.7.4.4 Immersion-Cooled Rack Infrastructure
Chapter 2. Company Snapshots
2.1 Super Micro Computer, Inc.
2.1.1 Business Overview
2.1.2 Key Information
2.1.3 Company Focus on Rack-Scale GPU Infrastructure Market
2.1.4 Strategic Insights
2.1.5 Strategy Deployed
2.1.6 Product & Service Portfolio
2.1.7 Representative Products
2.1.8 Capability Overview
2.1.9 Technology & Innovation Focus
2.1.10 SWOT Analysis
2.1.11 Customers / End Users
2.1.12 Competitive Positioning
2.1.13 Key Differentiators
2.1.14 Portfolio Matrix
2.1.15 Analyst View
2.1.16 Future Outlook
2.2 Dell Technologies Inc.
2.2.1 Business Overview
2.2.2 Key Information
2.2.3 Company Focus on Rack-Scale GPU Infrastructure Market
2.2.4 Strategic Insights
2.2.5 Strategy Deployed
2.2.6 Product & Service Portfolio
2.2.7 Representative Products
2.2.8 Capability Overview
2.2.9 Technology & Innovation Focus
2.2.10 SWOT Analysis
2.2.11 Customers / End Users
2.2.12 Competitive Positioning
2.2.13 Key Differentiators
2.2.14 Portfolio Matrix
2.2.15 Analyst View
2.2.16 Future Outlook
2.3 NVIDIA Corporation
2.3.1 Business Overview
2.3.2 Key Information
2.3.3 Company Focus on Rack-Scale GPU Infrastructure Market
2.3.4 Strategic Insights
2.3.5 Strategy Deployed
2.3.6 Product & Service Portfolio
2.3.7 Representative Products
2.3.8 Capability Overview
2.3.9 Technology & Innovation Focus
2.3.10 SWOT Analysis
2.3.11 Customers / End Users
2.3.12 Competitive Positioning
2.3.13 Key Differentiators
2.3.14 Portfolio Matrix
2.3.15 Analyst View
2.3.16 Future Outlook
2.4 Quanta Computer Inc.
2.4.1 Business Overview
2.4.2 Key Information
2.4.3 Company Focus on Rack-Scale GPU Infrastructure Market
2.4.4 Strategic Insights
2.4.5 Strategy Deployed
2.4.6 Product & Service Portfolio
2.4.7 Representative Products
2.4.8 Capability Overview
2.4.9 Technology & Innovation Focus
2.4.10 SWOT Analysis
2.4.11 Customers / End Users 2.4.12 Competitive Positioning
2.4.13 Key Differentiators
2.4.14 Portfolio Matrix
2.4.15 Analyst View
2.4.16 Future Outlook
2.5 Hewlett Packard Enterprise (HPE)
2.5.1 Business Overview
2.5.2 Key Information
2.5.3 Company Focus on Rack-Scale GPU Infrastructure Market
2.5.4 Strategic Insights
2.5.5 Strategy Deployed
2.5.6 Product & Service Portfolio
2.5.7 Representative Products
2.5.8 Capability Overview
2.5.9 Technology & Innovation Focus
2.5.10 SWOT Analysis
2.5.11 Customers / End Users
2.5.12 Competitive Positioning
2.5.13 Key Differentiators
2.5.14 Portfolio Matrix
2.5.15 Analyst View
2.5.16 Future Outlook
2.6 Hon Hai Precision Industry Co., Ltd.
2.6.1 Business Overview
2.6.2 Key Information
2.6.3 Company Focus on Rack-Scale GPU Infrastructure Market
2.6.4 Strategic Insights
2.6.5 Strategy Deployed
2.6.6 Product & Service Portfolio
2.6.7 Representative Products
2.6.8 Capability Overview
2.6.9 Technology & Innovation Focus
2.6.10 SWOT Analysis
2.6.11 Customers / End Users
2.6.12 Competitive Positioning
2.6.13 Key Differentiators
2.6.14 Portfolio Matrix
2.6.15 Analyst View
2.6.16 Future Outlook
2.7 Lenovo Group Limited
2.7.1 Business Overview
2.7.2 Key Information
2.7.3 Company Focus on Rack-Scale GPU Infrastructure Market
2.7.4 Strategic Insights
2.7.5 Strategy Deployed
2.7.6 Product & Service Portfolio
2.7.7 Representative Products
2.7.8 Capability Overview
2.7.9 Technology & Innovation Focus
2.7.10 SWOT Analysis
2.7.11 Customers / End Users
2.7.12 Competitive Positioning
2.7.13 Key Differentiators
2.7.14 Portfolio Matrix
2.7.15 Analyst View
2.7.16 Future Outlook
2.8 IEIT Systems Co., Ltd.
2.8.1 Business Overview
2.8.2 Key Information
2.8.3 Company Focus on Rack-Scale GPU Infrastructure Market
2.8.4 Strategic Insights
2.8.5 Strategy Deployed
2.8.6 Product & Service Portfolio
2.8.7 Representative Products
2.8.8 Capability Overview
2.8.9 Technology & Innovation Focus
2.8.10 SWOT Analysis
2.8.11 Customers / End Users
2.8.12 Competitive Positioning
2.8.13 Key Differentiators
2.8.14 Portfolio Matrix
2.8.15 Analyst View
2.8.16 Future Outlook
2.9 Giga Computing Technology Co., Ltd.
2.9.1 Business Overview
2.9.2 Key Information
2.9.3 Company Focus on Rack-Scale GPU Infrastructure Market
2.9.4 Strategic Insights
2.9.5 Strategy Deployed
2.9.6 Product & Service Portfolio
2.9.7 Representative Products
2.9.8 Capability Overview
2.9.9 Technology & Innovation Focus
2.9.10 SWOT Analysis
2.9.11 Customers / End Users
2.9.12 Competitive Positioning
2.9.13 Key Differentiators
2.9.14 Portfolio Matrix
2.9.15 Analyst View
2.9.16 Future Outlook
2.10 Wiwynn Corporation
2.10.1 Business Overview
2.10.2 Key Information
2.10.3 Company Focus on Rack-Scale GPU Infrastructure Market
2.10.4 Strategic Insights
2.10.5 Strategy Deployed
2.10.6 Product & Service Portfolio
2.10.7 Representative Products
2.10.8 Capability Overview
2.10.9 Technology & Innovation Focus
2.10.10 SWOT Analysis
2.10.11 Customers / End Users
2.10.12 Competitive Positioning
2.10.13 Key Differentiators
2.10.14 Portfolio Matrix
2.10.15 Analyst View
2.10.16 Future Outlook
Table 1 Europe Rack-Scale GPU Infrastructure Market Market, 2022 - 2033, USD Million
Table 2 Europe Rack-Scale GPU Infrastructure Market Market by Cooling Architecture, 2022 - 2033, USD Million
Table 3 Europe Air-Cooled Rack Infrastructure Market, 2022 - 2033, USD Million
Table 4 Europe Direct-to-Chip Liquid-Cooled Rack Infrastructure Market, 2022 - 2033, USD Million
Table 5 Europe Hybrid Cooling Rack Infrastructure Market, 2022 - 2033, USD Million
Table 6 Europe Immersion-Cooled Rack Infrastructure Market, 2022 - 2033, USD Million
Table 7 Europe Rack-Scale GPU Infrastructure Market Market by Deployment Scale, 2022 - 2033, USD Million
Table 8 Europe Cluster-Scale AI Factory Market, 2022 - 2033, USD Million
Table 9 Europe Multi-Rack Pod Market, 2022 - 2033, USD Million
Table 10 Europe Single-Rack Market, 2022 - 2033, USD Million
Table 11 Europe Rack-Scale GPU Infrastructure Market Market by End User, 2022 - 2033, USD Million
Table 12 Europe Cloud Service Providers Market, 2022 - 2033, USD Million
Table 13 Europe Edge Infrastructure Operators Market, 2022 - 2033, USD Million
Table 14 Europe Enterprises Market, 2022 - 2033, USD Million
Table 15 Europe Government and Research Institutions Market, 2022 - 2033, USD Million
Table 16 Europe Telecommunications Providers Market, 2022 - 2033, USD Million
Table 17 Europe Rack-Scale GPU Infrastructure Market Market by Solution Type, 2022 - 2033, USD Million
Table 18 Europe Compute Systems Market, 2022 - 2033, USD Million
Table 19 Europe Cooling Systems Market, 2022 - 2033, USD Million
Table 20 Europe Networking Systems Market, 2022 - 2033, USD Million
Table 21 Europe Power Delivery Systems Market, 2022 - 2033, USD Million
Table 22 Germany Rack-Scale GPU Infrastructure Market Market, 2022 - 2033, USD Million
Table 23 Germany Rack-Scale GPU Infrastructure Market Market by Cooling Architecture, 2022 - 2033, USD Million
Table 24 Germany Air-Cooled Rack Infrastructure Market, 2022 - 2033, USD Million
Table 25 Germany Direct-to-Chip Liquid-Cooled Rack Infrastructure Market, 2022 - 2033, USD Million
Table 26 Germany Hybrid Cooling Rack Infrastructure Market, 2022 - 2033, USD Million
Table 27 Germany Immersion-Cooled Rack Infrastructure Market, 2022 - 2033, USD Million
Table 28 Germany Rack-Scale GPU Infrastructure Market Market by Deployment Scale, 2022 - 2033, USD Million
Table 29 Germany Cluster-Scale AI Factory Market, 2022 - 2033, USD Million
Table 30 Germany Multi-Rack Pod Market, 2022 - 2033, USD Million
Table 31 Germany Single-Rack Market, 2022 - 2033, USD Million
Table 32 Germany Rack-Scale GPU Infrastructure Market Market by End User, 2022 - 2033, USD Million
Table 33 Germany Cloud Service Providers Market, 2022 - 2033, USD Million
Table 34 Germany Edge Infrastructure Operators Market, 2022 - 2033, USD Million
Table 35 Germany Enterprises Market, 2022 - 2033, USD Million
Table 36 Germany Government and Research Institutions Market, 2022 - 2033, USD Million
Table 37 Germany Telecommunications Providers Market, 2022 - 2033, USD Million
Table 38 Germany Rack-Scale GPU Infrastructure Market Market by Solution Type, 2022 - 2033, USD Million
Table 39 Germany Compute Systems Market, 2022 - 2033, USD Million
Table 40 Germany Cooling Systems Market, 2022 - 2033, USD Million
Table 41 Germany Networking Systems Market, 2022 - 2033, USD Million
Table 42 Germany Power Delivery Systems Market, 2022 - 2033, USD Million
Table 43 United Kingdom Rack-Scale GPU Infrastructure Market Market, 2022 - 2033, USD Million
Table 44 United Kingdom Rack-Scale GPU Infrastructure Market Market by Cooling Architecture, 2022 - 2033, USD Million
Table 45 United Kingdom Air-Cooled Rack Infrastructure Market, 2022 - 2033, USD Million
Table 46 United Kingdom Direct-to-Chip Liquid-Cooled Rack Infrastructure Market, 2022 - 2033, USD Million
Table 47 United Kingdom Hybrid Cooling Rack Infrastructure Market, 2022 - 2033, USD Million
Table 48 United Kingdom Immersion-Cooled Rack Infrastructure Market, 2022 - 2033, USD Million
Table 49 United Kingdom Rack-Scale GPU Infrastructure Market Market by Deployment Scale, 2022 - 2033, USD Million
Table 50 United Kingdom Cluster-Scale AI Factory Market, 2022 - 2033, USD Million
Table 51 United Kingdom Multi-Rack Pod Market, 2022 - 2033, USD Million
Table 52 United Kingdom Single-Rack Market, 2022 - 2033, USD Million
Table 53 United Kingdom Rack-Scale GPU Infrastructure Market Market by End User, 2022 - 2033, USD Million
Table 54 United Kingdom Cloud Service Providers Market, 2022 - 2033, USD Million
Table 55 United Kingdom Edge Infrastructure Operators Market, 2022 - 2033, USD Million
Table 56 United Kingdom Enterprises Market, 2022 - 2033, USD Million
Table 57 United Kingdom Government and Research Institutions Market, 2022 - 2033, USD Million
Table 58 United Kingdom Telecommunications Providers Market, 2022 - 2033, USD Million
Table 59 United Kingdom Rack-Scale GPU Infrastructure Market Market by Solution Type, 2022 - 2033, USD Million
Table 60 United Kingdom Compute Systems Market, 2022 - 2033, USD Million
Table 61 United Kingdom Cooling Systems Market, 2022 - 2033, USD Million
Table 62 United Kingdom Networking Systems Market, 2022 - 2033, USD Million
Table 63 United Kingdom Power Delivery Systems Market, 2022 - 2033, USD Million
Table 64 France Rack-Scale GPU Infrastructure Market Market, 2022 - 2033, USD Million
Table 65 France Rack-Scale GPU Infrastructure Market Market by Cooling Architecture, 2022 - 2033, USD Million
Table 66 France Air-Cooled Rack Infrastructure Market, 2022 - 2033, USD Million
Table 67 France Direct-to-Chip Liquid-Cooled Rack Infrastructure Market, 2022 - 2033, USD Million
Table 68 France Hybrid Cooling Rack Infrastructure Market, 2022 - 2033, USD Million
Table 69 France Immersion-Cooled Rack Infrastructure Market, 2022 - 2033, USD Million
Table 70 France Rack-Scale GPU Infrastructure Market Market by Deployment Scale, 2022 - 2033, USD Million
Table 71 France Cluster-Scale AI Factory Market, 2022 - 2033, USD Million
Table 72 France Multi-Rack Pod Market, 2022 - 2033, USD Million
Table 73 France Single-Rack Market, 2022 - 2033, USD Million
Table 74 France Rack-Scale GPU Infrastructure Market Market by End User, 2022 - 2033, USD Million
Table 75 France Cloud Service Providers Market, 2022 - 2033, USD Million
Table 76 France Edge Infrastructure Operators Market, 2022 - 2033, USD Million
Table 77 France Enterprises Market, 2022 - 2033, USD Million
Table 78 France Government and Research Institutions Market, 2022 - 2033, USD Million
Table 79 France Telecommunications Providers Market, 2022 - 2033, USD Million
Table 80 France Rack-Scale GPU Infrastructure Market Market by Solution Type, 2022 - 2033, USD Million
Table 81 France Compute Systems Market, 2022 - 2033, USD Million
Table 82 France Cooling Systems Market, 2022 - 2033, USD Million
Table 83 France Networking Systems Market, 2022 - 2033, USD Million
Table 84 France Power Delivery Systems Market, 2022 - 2033, USD Million
Table 85 Russia Rack-Scale GPU Infrastructure Market Market, 2022 - 2033, USD Million
Table 86 Russia Rack-Scale GPU Infrastructure Market Market by Cooling Architecture, 2022 - 2033, USD Million
Table 87 Russia Air-Cooled Rack Infrastructure Market, 2022 - 2033, USD Million
Table 88 Russia Direct-to-Chip Liquid-Cooled Rack Infrastructure Market, 2022 - 2033, USD Million
Table 89 Russia Hybrid Cooling Rack Infrastructure Market, 2022 - 2033, USD Million
Table 90 Russia Immersion-Cooled Rack Infrastructure Market, 2022 - 2033, USD Million
Table 91 Russia Rack-Scale GPU Infrastructure Market Market by Deployment Scale, 2022 - 2033, USD Million
Table 92 Russia Cluster-Scale AI Factory Market, 2022 - 2033, USD Million
Table 93 Russia Multi-Rack Pod Market, 2022 - 2033, USD Million
Table 94 Russia Single-Rack Market, 2022 - 2033, USD Million
Table 95 Russia Rack-Scale GPU Infrastructure Market Market by End User, 2022 - 2033, USD Million
Table 96 Russia Cloud Service Providers Market, 2022 - 2033, USD Million
Table 97 Russia Edge Infrastructure Operators Market, 2022 - 2033, USD Million
Table 98 Russia Enterprises Market, 2022 - 2033, USD Million
Table 99 Russia Government and Research Institutions Market, 2022 - 2033, USD Million
Table 100 Russia Telecommunications Providers Market, 2022 - 2033, USD Million
Table 101 Russia Rack-Scale GPU Infrastructure Market Market by Solution Type, 2022 - 2033, USD Million
Table 102 Russia Compute Systems Market, 2022 - 2033, USD Million
Table 103 Russia Cooling Systems Market, 2022 - 2033, USD Million
Table 104 Russia Networking Systems Market, 2022 - 2033, USD Million
Table 105 Russia Power Delivery Systems Market, 2022 - 2033, USD Million
Table 106 Spain Rack-Scale GPU Infrastructure Market Market, 2022 - 2033, USD Million
Table 107 Spain Rack-Scale GPU Infrastructure Market Market by Cooling Architecture, 2022 - 2033, USD Million
Table 108 Spain Air-Cooled Rack Infrastructure Market, 2022 - 2033, USD Million
Table 109 Spain Direct-to-Chip Liquid-Cooled Rack Infrastructure Market, 2022 - 2033, USD Million
Table 110 Spain Hybrid Cooling Rack Infrastructure Market, 2022 - 2033, USD Million
Table 111 Spain Immersion-Cooled Rack Infrastructure Market, 2022 - 2033, USD Million
Table 112 Spain Rack-Scale GPU Infrastructure Market Market by Deployment Scale, 2022 - 2033, USD Million
Table 113 Spain Cluster-Scale AI Factory Market, 2022 - 2033, USD Million
Table 114 Spain Multi-Rack Pod Market, 2022 - 2033, USD Million
Table 115 Spain Single-Rack Market, 2022 - 2033, USD Million
Table 116 Spain Rack-Scale GPU Infrastructure Market Market by End User, 2022 - 2033, USD Million
Table 117 Spain Cloud Service Providers Market, 2022 - 2033, USD Million
Table 118 Spain Edge Infrastructure Operators Market, 2022 - 2033, USD Million
Table 119 Spain Enterprises Market, 2022 - 2033, USD Million
Table 120 Spain Government and Research Institutions Market, 2022 - 2033, USD Million
Table 121 Spain Telecommunications Providers Market, 2022 - 2033, USD Million
Table 122 Spain Rack-Scale GPU Infrastructure Market Market by Solution Type, 2022 - 2033, USD Million
Table 123 Spain Compute Systems Market, 2022 - 2033, USD Million
Table 124 Spain Cooling Systems Market, 2022 - 2033, USD Million
Table 125 Spain Networking Systems Market, 2022 - 2033, USD Million
Table 126 Spain Power Delivery Systems Market, 2022 - 2033, USD Million
Table 127 Italy Rack-Scale GPU Infrastructure Market Market, 2022 - 2033, USD Million
Table 128 Italy Rack-Scale GPU Infrastructure Market Market by Cooling Architecture, 2022 - 2033, USD Million
Table 129 Italy Air-Cooled Rack Infrastructure Market, 2022 - 2033, USD Million
Table 130 Italy Direct-to-Chip Liquid-Cooled Rack Infrastructure Market, 2022 - 2033, USD Million
Table 131 Italy Hybrid Cooling Rack Infrastructure Market, 2022 - 2033, USD Million
Table 132 Italy Immersion-Cooled Rack Infrastructure Market, 2022 - 2033, USD Million
Table 133 Italy Rack-Scale GPU Infrastructure Market Market by Deployment Scale, 2022 - 2033, USD Million
Table 134 Italy Cluster-Scale AI Factory Market, 2022 - 2033, USD Million
Table 135 Italy Multi-Rack Pod Market, 2022 - 2033, USD Million
Table 136 Italy Single-Rack Market, 2022 - 2033, USD Million
Table 137 Italy Rack-Scale GPU Infrastructure Market Market by End User, 2022 - 2033, USD Million
Table 138 Italy Cloud Service Providers Market, 2022 - 2033, USD Million
Table 139 Italy Edge Infrastructure Operators Market, 2022 - 2033, USD Million
Table 140 Italy Enterprises Market, 2022 - 2033, USD Million
Table 141 Italy Government and Research Institutions Market, 2022 - 2033, USD Million
Table 142 Italy Telecommunications Providers Market, 2022 - 2033, USD Million
Table 143 Italy Rack-Scale GPU Infrastructure Market Market by Solution Type, 2022 - 2033, USD Million
Table 144 Italy Compute Systems Market, 2022 - 2033, USD Million
Table 145 Italy Cooling Systems Market, 2022 - 2033, USD Million
Table 146 Italy Networking Systems Market, 2022 - 2033, USD Million
Table 147 Italy Power Delivery Systems Market, 2022 - 2033, USD Million
Table 148 Rest of Europe Rack-Scale GPU Infrastructure Market Market, 2022 - 2033, USD Million
Table 149 Rest of Europe Rack-Scale GPU Infrastructure Market Market by Cooling Architecture, 2022 - 2033, USD Million
Table 150 Rest of Europe Air-Cooled Rack Infrastructure Market, 2022 - 2033, USD Million
Table 151 Rest of Europe Direct-to-Chip Liquid-Cooled Rack Infrastructure Market, 2022 - 2033, USD Million
Table 152 Rest of Europe Hybrid Cooling Rack Infrastructure Market, 2022 - 2033, USD Million
Table 153 Rest of Europe Immersion-Cooled Rack Infrastructure Market, 2022 - 2033, USD Million
Table 154 Rest of Europe Rack-Scale GPU Infrastructure Market Market by Deployment Scale, 2022 - 2033, USD Million
Table 155 Rest of Europe Cluster-Scale AI Factory Market, 2022 - 2033, USD Million
Table 156 Rest of Europe Multi-Rack Pod Market, 2022 - 2033, USD Million
Table 157 Rest of Europe Single-Rack Market, 2022 - 2033, USD Million
Table 158 Rest of Europe Rack-Scale GPU Infrastructure Market Market by End User, 2022 - 2033, USD Million
Table 159 Rest of Europe Cloud Service Providers Market, 2022 - 2033, USD Million
Table 160 Rest of Europe Edge Infrastructure Operators Market, 2022 - 2033, USD Million
Table 161 Rest of Europe Enterprises Market, 2022 - 2033, USD Million
Table 162 Rest of Europe Government and Research Institutions Market, 2022 - 2033, USD Million
Table 163 Rest of Europe Telecommunications Providers Market, 2022 - 2033, USD Million
Table 164 Rest of Europe Rack-Scale GPU Infrastructure Market Market by Solution Type, 2022 - 2033, USD Million
Table 165 Rest of Europe Compute Systems Market, 2022 - 2033, USD Million
Table 166 Rest of Europe Cooling Systems Market, 2022 - 2033, USD Million
Table 167 Rest of Europe Networking Systems Market, 2022 - 2033, USD Million
Table 168 Rest of Europe Power Delivery Systems Market, 2022 - 2033, USD Million
List of Figures
FIG 1 Key Factors Impacting Market
FIG 2 Market Consolidation
FIG 3 Key Customer Criteria
FIG 4 Product Life Cycle
FIG 5 Europe Rack-Scale GPU Infrastructure Market Market, 2022 - 2033, USD Million
FIG 6 Europe Rack-Scale GPU Infrastructure Market Market by Cooling Architecture, 2022 - 2033, USD Million
FIG 7 Europe Air-Cooled Rack Infrastructure Market, 2022 - 2033, USD Million
FIG 8 Europe Direct-to-Chip Liquid-Cooled Rack Infrastructure Market, 2022 - 2033, USD Million
FIG 9 Europe Hybrid Cooling Rack Infrastructure Market, 2022 - 2033, USD Million
FIG 10 Europe Immersion-Cooled Rack Infrastructure Market, 2022 - 2033, USD Million
FIG 11 Europe Rack-Scale GPU Infrastructure Market Market by Deployment Scale, 2022 - 2033, USD Million
FIG 12 Europe Cluster-Scale AI Factory Market, 2022 - 2033, USD Million
FIG 13 Europe Multi-Rack Pod Market, 2022 - 2033, USD Million
FIG 14 Europe Single-Rack Market, 2022 - 2033, USD Million
FIG 15 Europe Rack-Scale GPU Infrastructure Market Market by End User, 2022 - 2033, USD Million
FIG 16 Europe Cloud Service Providers Market, 2022 - 2033, USD Million
FIG 17 Europe Edge Infrastructure Operators Market, 2022 - 2033, USD Million
FIG 18 Europe Enterprises Market, 2022 - 2033, USD Million
FIG 19 Europe Government and Research Institutions Market, 2022 - 2033, USD Million
FIG 20 Europe Telecommunications Providers Market, 2022 - 2033, USD Million
FIG 21 Europe Rack-Scale GPU Infrastructure Market Market by Solution Type, 2022 - 2033, USD Million
FIG 22 Europe Compute Systems Market, 2022 - 2033, USD Million
FIG 23 Europe Cooling Systems Market, 2022 - 2033, USD Million
FIG 24 Europe Networking Systems Market, 2022 - 2033, USD Million
FIG 25 Europe Power Delivery Systems Market, 2022 - 2033, USD Million
FIG 26 Germany Rack-Scale GPU Infrastructure Market Market, 2022 - 2033, USD Million
FIG 27 Germany Rack-Scale GPU Infrastructure Market Market by Cooling Architecture, 2022 - 2033, USD Million
FIG 28 Germany Air-Cooled Rack Infrastructure Market, 2022 - 2033, USD Million
FIG 29 Germany Direct-to-Chip Liquid-Cooled Rack Infrastructure Market, 2022 - 2033, USD Million
FIG 30 Germany Hybrid Cooling Rack Infrastructure Market, 2022 - 2033, USD Million
FIG 31 Germany Immersion-Cooled Rack Infrastructure Market, 2022 - 2033, USD Million
FIG 32 Germany Rack-Scale GPU Infrastructure Market Market by Deployment Scale, 2022 - 2033, USD Million
FIG 33 Germany Cluster-Scale AI Factory Market, 2022 - 2033, USD Million
FIG 34 Germany Multi-Rack Pod Market, 2022 - 2033, USD Million
FIG 35 Germany Single-Rack Market, 2022 - 2033, USD Million
FIG 36 Germany Rack-Scale GPU Infrastructure Market Market by End User, 2022 - 2033, USD Million
FIG 37 Germany Cloud Service Providers Market, 2022 - 2033, USD Million
FIG 38 Germany Edge Infrastructure Operators Market, 2022 - 2033, USD Million
FIG 39 Germany Enterprises Market, 2022 - 2033, USD Million
FIG 40 Germany Government and Research Institutions Market, 2022 - 2033, USD Million
FIG 41 Germany Telecommunications Providers Market, 2022 - 2033, USD Million
FIG 42 Germany Rack-Scale GPU Infrastructure Market Market by Solution Type, 2022 - 2033, USD Million
FIG 43 Germany Compute Systems Market, 2022 - 2033, USD Million
FIG 44 Germany Cooling Systems Market, 2022 - 2033, USD Million
FIG 45 Germany Networking Systems Market, 2022 - 2033, USD Million
FIG 46 Germany Power Delivery Systems Market, 2022 - 2033, USD Million
FIG 47 United Kingdom Rack-Scale GPU Infrastructure Market Market, 2022 - 2033, USD Million
FIG 48 United Kingdom Rack-Scale GPU Infrastructure Market Market by Cooling Architecture, 2022 - 2033, USD Million
FIG 49 United Kingdom Air-Cooled Rack Infrastructure Market, 2022 - 2033, USD Million
FIG 50 United Kingdom Direct-to-Chip Liquid-Cooled Rack Infrastructure Market, 2022 - 2033, USD Million
FIG 51 United Kingdom Hybrid Cooling Rack Infrastructure Market, 2022 - 2033, USD Million
FIG 52 United Kingdom Immersion-Cooled Rack Infrastructure Market, 2022 - 2033, USD Million
FIG 53 United Kingdom Rack-Scale GPU Infrastructure Market Market by Deployment Scale, 2022 - 2033, USD Million
FIG 54 United Kingdom Cluster-Scale AI Factory Market, 2022 - 2033, USD Million
FIG 55 United Kingdom Multi-Rack Pod Market, 2022 - 2033, USD Million
FIG 56 United Kingdom Single-Rack Market, 2022 - 2033, USD Million
FIG 57 United Kingdom Rack-Scale GPU Infrastructure Market Market by End User, 2022 - 2033, USD Million
FIG 58 United Kingdom Cloud Service Providers Market, 2022 - 2033, USD Million
FIG 59 United Kingdom Edge Infrastructure Operators Market, 2022 - 2033, USD Million
FIG 60 United Kingdom Enterprises Market, 2022 - 2033, USD Million
FIG 61 United Kingdom Government and Research Institutions Market, 2022 - 2033, USD Million
FIG 62 United Kingdom Telecommunications Providers Market, 2022 - 2033, USD Million
FIG 63 United Kingdom Rack-Scale GPU Infrastructure Market Market by Solution Type, 2022 - 2033, USD Million
FIG 64 United Kingdom Compute Systems Market, 2022 - 2033, USD Million
FIG 65 United Kingdom Cooling Systems Market, 2022 - 2033, USD Million
FIG 66 United Kingdom Networking Systems Market, 2022 - 2033, USD Million
FIG 67 United Kingdom Power Delivery Systems Market, 2022 - 2033, USD Million
FIG 68 France Rack-Scale GPU Infrastructure Market Market, 2022 - 2033, USD Million
FIG 69 France Rack-Scale GPU Infrastructure Market Market by Cooling Architecture, 2022 - 2033, USD Million
FIG 70 France Air-Cooled Rack Infrastructure Market, 2022 - 2033, USD Million
FIG 71 France Direct-to-Chip Liquid-Cooled Rack Infrastructure Market, 2022 - 2033, USD Million
FIG 72 France Hybrid Cooling Rack Infrastructure Market, 2022 - 2033, USD Million
FIG 73 France Immersion-Cooled Rack Infrastructure Market, 2022 - 2033, USD Million
FIG 74 France Rack-Scale GPU Infrastructure Market Market by Deployment Scale, 2022 - 2033, USD Million FIG 75 France Cluster-Scale AI Factory Market, 2022 - 2033, USD Million
FIG 76 France Multi-Rack Pod Market, 2022 - 2033, USD Million
FIG 77 France Single-Rack Market, 2022 - 2033, USD Million
FIG 78 France Rack-Scale GPU Infrastructure Market Market by End User, 2022 - 2033, USD Million
FIG 79 France Cloud Service Providers Market, 2022 - 2033, USD Million
FIG 80 France Edge Infrastructure Operators Market, 2022 - 2033, USD Million
FIG 81 France Enterprises Market, 2022 - 2033, USD Million
FIG 82 France Government and Research Institutions Market, 2022 - 2033, USD Million
FIG 83 France Telecommunications Providers Market, 2022 - 2033, USD Million
FIG 84 France Rack-Scale GPU Infrastructure Market Market by Solution Type, 2022 - 2033, USD Million
FIG 85 France Compute Systems Market, 2022 - 2033, USD Million
FIG 86 France Cooling Systems Market, 2022 - 2033, USD Million
FIG 87 France Networking Systems Market, 2022 - 2033, USD Million
FIG 88 France Power Delivery Systems Market, 2022 - 2033, USD Million
FIG 89 Russia Rack-Scale GPU Infrastructure Market Market, 2022 - 2033, USD Million
FIG 90 Russia Rack-Scale GPU Infrastructure Market Market by Cooling Architecture, 2022 - 2033, USD Million
FIG 91 Russia Air-Cooled Rack Infrastructure Market, 2022 - 2033, USD Million
FIG 92 Russia Direct-to-Chip Liquid-Cooled Rack Infrastructure Market, 2022 - 2033, USD Million
FIG 93 Russia Hybrid Cooling Rack Infrastructure Market, 2022 - 2033, USD Million
FIG 94 Russia Immersion-Cooled Rack Infrastructure Market, 2022 - 2033, USD Million
FIG 95 Russia Rack-Scale GPU Infrastructure Market Market by Deployment Scale, 2022 - 2033, USD Million
FIG 96 Russia Cluster-Scale AI Factory Market, 2022 - 2033, USD Million
FIG 97 Russia Multi-Rack Pod Market, 2022 - 2033, USD Million
FIG 98 Russia Single-Rack Market, 2022 - 2033, USD Million
FIG 99 Russia Rack-Scale GPU Infrastructure Market Market by End User, 2022 - 2033, USD Million
FIG 100 Russia Cloud Service Providers Market, 2022 - 2033, USD Million
FIG 101 Russia Edge Infrastructure Operators Market, 2022 - 2033, USD Million
FIG 102 Russia Enterprises Market, 2022 - 2033, USD Million
FIG 103 Russia Government and Research Institutions Market, 2022 - 2033, USD Million
FIG 104 Russia Telecommunications Providers Market, 2022 - 2033, USD Million
FIG 105 Russia Rack-Scale GPU Infrastructure Market Market by Solution Type, 2022 - 2033, USD Million
FIG 106 Russia Compute Systems Market, 2022 - 2033, USD Million
FIG 107 Russia Cooling Systems Market, 2022 - 2033, USD Million
FIG 108 Russia Networking Systems Market, 2022 - 2033, USD Million
FIG 109 Russia Power Delivery Systems Market, 2022 - 2033, USD Million
FIG 110 Spain Rack-Scale GPU Infrastructure Market Market, 2022 - 2033, USD Million
FIG 111 Spain Rack-Scale GPU Infrastructure Market Market by Cooling Architecture, 2022 - 2033, USD Million
FIG 112 Spain Air-Cooled Rack Infrastructure Market, 2022 - 2033, USD Million
FIG 113 Spain Direct-to-Chip Liquid-Cooled Rack Infrastructure Market, 2022 - 2033, USD Million
FIG 114 Spain Hybrid Cooling Rack Infrastructure Market, 2022 - 2033, USD Million
FIG 115 Spain Immersion-Cooled Rack Infrastructure Market, 2022 - 2033, USD Million
FIG 116 Spain Rack-Scale GPU Infrastructure Market Market by Deployment Scale, 2022 - 2033, USD Million
FIG 117 Spain Cluster-Scale AI Factory Market, 2022 - 2033, USD Million
FIG 118 Spain Multi-Rack Pod Market, 2022 - 2033, USD Million
FIG 119 Spain Single-Rack Market, 2022 - 2033, USD Million
FIG 120 Spain Rack-Scale GPU Infrastructure Market Market by End User, 2022 - 2033, USD Million
FIG 121 Spain Cloud Service Providers Market, 2022 - 2033, USD Million
FIG 122 Spain Edge Infrastructure Operators Market, 2022 - 2033, USD Million
FIG 123 Spain Enterprises Market, 2022 - 2033, USD Million
FIG 124 Spain Government and Research Institutions Market, 2022 - 2033, USD Million
FIG 125 Spain Telecommunications Providers Market, 2022 - 2033, USD Million
FIG 126 Spain Rack-Scale GPU Infrastructure Market Market by Solution Type, 2022 - 2033, USD Million
FIG 127 Spain Compute Systems Market, 2022 - 2033, USD Million
FIG 128 Spain Cooling Systems Market, 2022 - 2033, USD Million
FIG 129 Spain Networking Systems Market, 2022 - 2033, USD Million
FIG 130 Spain Power Delivery Systems Market, 2022 - 2033, USD Million
FIG 131 Italy Rack-Scale GPU Infrastructure Market Market, 2022 - 2033, USD Million
FIG 132 Italy Rack-Scale GPU Infrastructure Market Market by Cooling Architecture, 2022 - 2033, USD Million
FIG 133 Italy Air-Cooled Rack Infrastructure Market, 2022 - 2033, USD Million
FIG 134 Italy Direct-to-Chip Liquid-Cooled Rack Infrastructure Market, 2022 - 2033, USD Million
FIG 135 Italy Hybrid Cooling Rack Infrastructure Market, 2022 - 2033, USD Million
FIG 136 Italy Immersion-Cooled Rack Infrastructure Market, 2022 - 2033, USD Million
FIG 137 Italy Rack-Scale GPU Infrastructure Market Market by Deployment Scale, 2022 - 2033, USD Million
FIG 138 Italy Cluster-Scale AI Factory Market, 2022 - 2033, USD Million
FIG 139 Italy Multi-Rack Pod Market, 2022 - 2033, USD Million
FIG 140 Italy Single-Rack Market, 2022 - 2033, USD Million
FIG 141 Italy Rack-Scale GPU Infrastructure Market Market by End User, 2022 - 2033, USD Million
FIG 142 Italy Cloud Service Providers Market, 2022 - 2033, USD Million
FIG 143 Italy Edge Infrastructure Operators Market, 2022 - 2033, USD Million
FIG 144 Italy Enterprises Market, 2022 - 2033, USD Million
FIG 145 Italy Government and Research Institutions Market, 2022 - 2033, USD Million
FIG 146 Italy Telecommunications Providers Market, 2022 - 2033, USD Million
FIG 147 Italy Rack-Scale GPU Infrastructure Market Market by Solution Type, 2022 - 2033, USD Million
FIG 148 Italy Compute Systems Market, 2022 - 2033, USD Million
FIG 149 Italy Cooling Systems Market, 2022 - 2033, USD Million
FIG 150 Italy Networking Systems Market, 2022 - 2033, USD Million
FIG 151 Italy Power Delivery Systems Market, 2022 - 2033, USD Million
FIG 152 Rest of Europe Rack-Scale GPU Infrastructure Market Market, 2022 - 2033, USD Million
FIG 153 Rest of Europe Rack-Scale GPU Infrastructure Market Market by Cooling Architecture, 2022 - 2033, USD Million
FIG 154 Rest of Europe Air-Cooled Rack Infrastructure Market, 2022 - 2033, USD Million
FIG 155 Rest of Europe Direct-to-Chip Liquid-Cooled Rack Infrastructure Market, 2022 - 2033, USD Million
FIG 156 Rest of Europe Hybrid Cooling Rack Infrastructure Market, 2022 - 2033, USD Million
FIG 157 Rest of Europe Immersion-Cooled Rack Infrastructure Market, 2022 - 2033, USD Million
FIG 158 Rest of Europe Rack-Scale GPU Infrastructure Market Market by Deployment Scale, 2022 - 2033, USD Million
FIG 159 Rest of Europe Cluster-Scale AI Factory Market, 2022 - 2033, USD Million
FIG 160 Rest of Europe Multi-Rack Pod Market, 2022 - 2033, USD Million
FIG 161 Rest of Europe Single-Rack Market, 2022 - 2033, USD Million
FIG 162 Rest of Europe Rack-Scale GPU Infrastructure Market Market by End User, 2022 - 2033, USD Million
FIG 163 Rest of Europe Cloud Service Providers Market, 2022 - 2033, USD Million
FIG 164 Rest of Europe Edge Infrastructure Operators Market, 2022 - 2033, USD Million
FIG 165 Rest of Europe Enterprises Market, 2022 - 2033, USD Million
FIG 166 Rest of Europe Government and Research Institutions Market, 2022 - 2033, USD Million
FIG 167 Rest of Europe Telecommunications Providers Market, 2022 - 2033, USD Million
FIG 168 Rest of Europe Rack-Scale GPU Infrastructure Market Market by Solution Type, 2022 - 2033, USD Million
FIG 169 Rest of Europe Compute Systems Market, 2022 - 2033, USD Million
FIG 170 Rest of Europe Cooling Systems Market, 2022 - 2033, USD Million
FIG 171 Rest of Europe Networking Systems Market, 2022 - 2033, USD Million
FIG 172 Rest of Europe Power Delivery Systems Market, 2022 - 2033, USD Million