“Global Augmented Reality In E-Commerce Market to reach a market value of USD 61.47 Billion by 2032 growing at a CAGR of 35.3%”
The Global Augmented Reality In E-Commerce Market size is expected to reach $61.47 billion by 2032, rising at a market growth of 35.3% CAGR during the forecast period.
The hardware segment is experiencing transformative trends driven by technological innovation and consumer expectations. One major trend is the miniaturization and ergonomic enhancement of AR wearables, such as lightweight AR glasses with wider fields of view and longer battery life. Another emerging trend is the integration of AR capabilities in smartphones and tablets, eliminating the need for dedicated AR devices and making the technology more accessible.

The COVID-19 pandemic had a notably positive impact on the Augmented Reality (AR) in E-Commerce market. As physical retail spaces faced widespread closures and social distancing mandates, consumers rapidly shifted to online shopping. In response, e-commerce platforms adopted immersive technologies such as AR to recreate the in-store experience virtually. This accelerated the adoption of AR tools that allowed customers to visualize products in 3D, try them on virtually, or see how they would look in real-world environments — such as furniture in a living room or eyewear on a face — before making a purchase. Thus, the COVID-19 pandemic had a positive impact on the market.

One of the most significant drivers propelling the adoption of augmented reality in e-commerce is the demand for enhanced customer engagement through immersive shopping experiences. Traditional online shopping has always faced the challenge of a disconnect between physical interaction and digital browsing. Customers cannot touch, feel, or try on products virtually, which often leads to hesitation, uncertainty, and higher return rates. Augmented reality bridges this gap by overlaying digital content onto the real world, allowing consumers to visualize products in their actual environment before making a purchase. Ultimately, the increasing consumer appetite for personalized, convenient, and engaging shopping experiences ensures that augmented reality continues to be a vital tool for e-commerce players aiming to capture and retain tech-savvy shoppers.
Additionally, Another critical factor driving the growth of augmented reality in e-commerce is the rapid evolution of AR technology alongside improvements in mobile device capabilities. The widespread availability of powerful smartphones and tablets equipped with advanced cameras, processors, and sensors has created an ideal platform for delivering high-quality AR experiences to millions of consumers globally. These technological advancements have significantly lowered the barrier to entry for both consumers and retailers, enabling seamless integration of AR features into existing e-commerce apps and websites without requiring additional hardware. As AR technology continues to advance and becomes even more cost-effective, it will serve as a catalyst for broader adoption and experimentation across multiple product categories, driving the market forward at a rapid pace.
One of the most significant restraints hindering the widespread adoption of augmented reality in the e-commerce sector is the high cost associated with its implementation and development. AR technology requires sophisticated hardware and software components that are often expensive, especially for small to medium-sized enterprises (SMEs). Developing an immersive AR experience involves creating detailed 3D models, integrating these models with AR platforms, and ensuring seamless interaction on various devices such as smartphones, tablets, and AR headsets. Consequently, the high cost of implementation acts as a major restraint on the adoption of AR in e-commerce, slowing down its penetration across various industries and geographies.
")
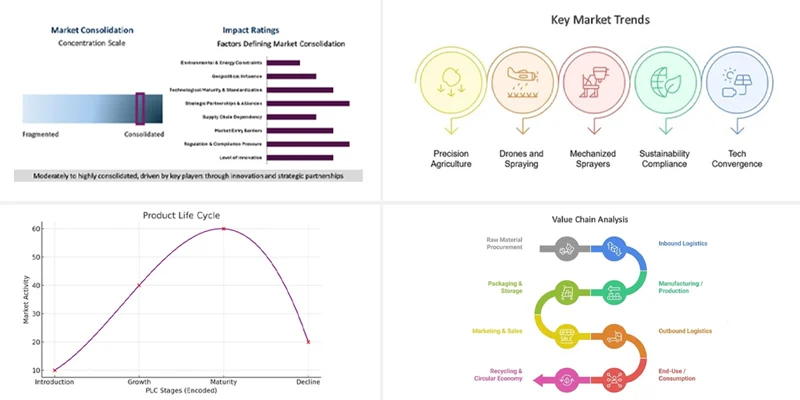
The Augmented Reality (AR) in E-Commerce Market value chain begins with Research and Development (R&D), which fuels AR content creation and 3D asset modeling to enhance virtual product visualization. This is followed by platform and application development and integration with e-commerce infrastructure, ensuring seamless user experiences. Cloud infrastructure and content delivery support scalable and fast AR services. A strong emphasis is placed on user experience and interaction design, data analytics and personalization, and cybersecurity, privacy, and compliance. Finally, deployment, maintenance, and performance monitoring, along with feedback and customer support, create a continuous improvement loop that feeds back into R&D.

The leading players in the market are competing with diverse innovative offerings to remain competitive in the market. The above illustration shows the percentage of revenue shared by some of the leading companies in the market. The leading players of the market are adopting various strategies in order to cater demand coming from the different industries. The key developmental strategies in the market are Acquisitions, and Partnerships & Collaborations.
Based on component, the augmented reality in e-commerce market is characterized into hardware and software. The software segment procured 43% revenue share in the augmented reality in e-commerce market in 2024. This segment includes AR development platforms, AR content creation tools, SDKs (Software Development Kits), and mobile applications that facilitate the deployment of AR experiences in online retail. Software is crucial for enabling seamless interaction between consumers and AR hardware, allowing them to visualize products in real-world environments.
On the basis of display, the augmented reality in e-commerce market is classified into HMD (head-mounted display), handheld devices, smart glass, and head-up display (HUD). The handheld devices segment recorded 23% revenue share in the augmented reality in e-commerce market in 2024. This can be attributed to the widespread use of mobile devices and the availability of AR features through apps and browsers without requiring additional hardware. Consumers can easily access AR functionalities such as virtual try-ons, product placement previews, and interactive ads, making handheld devices a practical and accessible entry point for AR in e-commerce.

By application, the augmented reality in e-commerce market is divided into virtual try-on solutions, product visualization, AR advertising & marketing, personalized shopping experience, virtual showrooms, and others. The product visualization segment garnered 27% revenue share in the augmented reality in e-commerce market in 2024. This application allows consumers to place 3D models of products within their real-world environments through their devices, enabling accurate spatial visualization. It helps bridge the gap between physical and online retail by giving users a better sense of scale, texture, and design.
Region-wise, the augmented reality in e-commerce market is analyzed across North America, Europe, Asia Pacific, and LAMEA. The North America segment recorded 36% revenue share in the augmented reality in e-commerce market in 2024. The region’s strong technological infrastructure, high smartphone penetration, and early adoption of advanced retail technologies have been key drivers. Major e-commerce players like Amazon and Walmart have integrated AR features into their platforms, offering customers immersive shopping experiences such as virtual try-ons and 3D product views.
Free Valuable Insights: Global Augmented Reality In E-Commerce Market size to reach USD 61.47 Billion by 2032
| Report Attribute | Details |
|---|---|
| Market size value in 2024 | USD 5.70 Billion |
| Market size forecast in 2032 | USD 61.47 Billion |
| Base Year | 2024 |
| Historical Period | 2021 to 2023 |
| Forecast Period | 2025 to 2032 |
| Revenue Growth Rate | CAGR of 35.3% from 2025 to 2032 |
| Number of Pages | 361 |
| Number of Tables | 393 |
| Report coverage | Market Trends, Revenue Estimation and Forecast, Segmentation Analysis, Regional and Country Breakdown, Market Share Analysis, Porter’s 5 Forces Analysis, Company Profiling, Companies Strategic Developments, SWOT Analysis, Winning Imperatives |
| Segments covered | Component, Display, Application, Region |
| Country scope |
|
| Companies Included | Google LLC, Meta Platforms, Inc., Amazon Web Services, Inc. (Amazon.com, Inc.), Microsoft Corporation, Apple, Inc., L'Oréal S.A., Shopify Inc., Unity Software, Inc., Inter Ikea Systems B.V. (Inter Ikea Holding B.V), and Snap, Inc. (SnapChat) |
By Component
By Display
By Application
By Geography
This Market size is expected to reach $61.47 billion by 2032.
Enhanced Customer Engagement And Immersive Shopping Experience are driving the Market in coming years, however, High Implementation And Development Costs restraints the growth of the Market.
Google LLC, Meta Platforms, Inc., Amazon Web Services, Inc. (Amazon.com, Inc.), Microsoft Corporation, Apple, Inc., L'Oréal S.A., Shopify Inc., Unity Software, Inc., Inter Ikea Systems B.V. (Inter Ikea Holding B.V), and Snap, Inc. (SnapChat)
The expected CAGR of this Market is 35.3% from 2023 to 2032.
The HMD (Head-Mounted Display) segment led the maximum revenue in the Market by Display in 2024, thereby, achieving a market value of $31.7 billion by 2032.
The North America region dominated the Market by Region in 2024, and would continue to be a dominant market till 2032; thereby, achieving a market value of $21.5 billion by 2032.
Our team of dedicated experts can provide you with attractive expansion opportunities for your business.


