Asia Pacific Partner Relationship Management Market Size, Share & Industry Analysis Report By Deployment (Cloud, and On-Premise), By Component (Software, and Services), By Services Type (Training & Consultation, and Managed Services), By Organization Size, By Application, By Country Outlook and Forecast, 2026 - 2033
Published Date : 02-Sep-2026 |
Pages: 352 |
Report Format: PDF + Excel |
COVID-19 Impact on the Asia Pacific Partner Relationship Management Market
The Asia Pacific Partner Relationship Management Market is expected to reach USD 48.7 billion by 2030, growing at a CAGR of 15% during (2026 – 2033).
PRM adoption across Asia Pacific developed as enterprises required more structured methods to coordinate increasingly complex reseller, distributor, and technology-partner networks. Early systems replaced fragmented manual processes with centralized partner onboarding, lead distribution, communication, and campaign management capabilities. Cloud computing and SaaS delivery later improved scalability and real-time collaboration across geographically dispersed markets. Subsequent integration of analytics, automation, AI-driven insights, and mobile accessibility transformed PRM platforms into strategic systems supporting partner performance, personalized engagement, and broader ecosystem orchestration.
Market development across Asia Pacific is increasingly influenced by digital business models, omnichannel sales strategies, AI-enabled partner intelligence, cloud adoption, and stronger data governance requirements. Organizations are integrating PRM platforms with CRM, ERP, marketing automation, and analytics systems to improve visibility and operational coordination. AI and machine learning are supporting partner segmentation, predictive performance analysis, lead scoring, and personalized incentive programs. Localization, multilingual functionality, cybersecurity, regulatory compliance, mobile access, and scalable cloud infrastructure are also becoming important capabilities across diverse regional markets.
Deployment Outlook
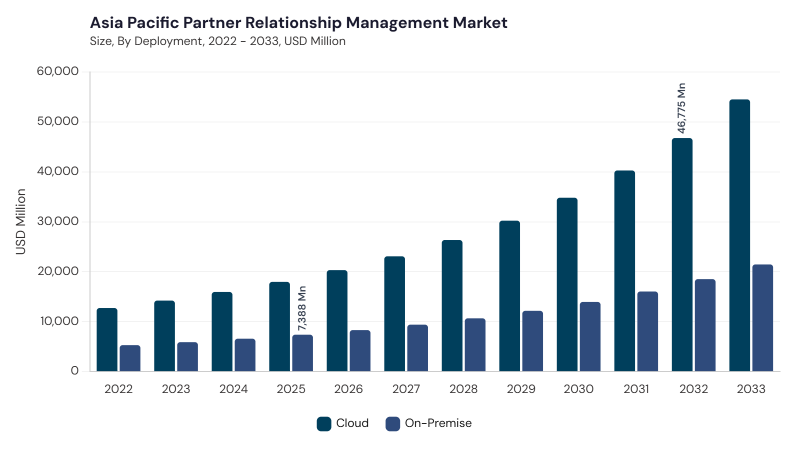
Based on Deployment, the market is segmented into Cloud and On-Premise. The Cloud market dominated the Asia Pacific Partner Relationship Management Market by Deployment in 2025, and would continue to be a dominant market till 2033; thereby, achieving a market value of USD 34.8 billion by 2030, growing at a CAGR of 15.1 % during the forecast period. The On-Premise market is expected to witness a CAGR of 14.5% during (2026 - 2033).
Cloud deployment leads as enterprises accelerate digitalization, adopt subscription-based applications, and expand partner collaboration across multiple countries. Cloud PRM platforms provide scalable infrastructure, rapid deployment, real-time data accessibility, automated updates, and integration with CRM, ERP, and marketing systems. On-Premise deployment remains relevant among organizations requiring enhanced data control, extensive customization, legacy-system compatibility, data residency, and stricter governance in highly regulated operating environments.
Component Outlook
Based on Component, the market is segmented into Software and Services. The Software market dominated the Asia Pacific Partner Relationship Management Market by Component in 2025, and would continue to be a dominant market till 2033; thereby, achieving a market value of USD 31.5 billion by 2030, growing at a CAGR of 15.1 % during the forecast period. The Services market is expected to witness a CAGR of 14.7% during (2026 - 2033).
Software maintains a leading position through rising demand for partner portals, automated deal registration, incentive management, workflow automation, analytics dashboards, and AI-powered performance insights. Enterprises increasingly use these platforms to improve partner productivity and streamline indirect sales operations. Services support implementation, integration, customization, consulting, training, migration, technical assistance, and ongoing optimization, particularly where organizations operate across diverse technology environments and regulatory conditions.
Organization Size Outlook
Based on Organization Size, the market is segmented into Large Enterprise and Small & Medium Enterprises. The Large Enterprise market dominated the Asia Pacific Partner Relationship Management Market by Organization Size in 2025, and would continue to be a dominant market till 2033; thereby, achieving a market value of USD 29.3 billion by 2030, growing at a CAGR of 14.6 % during the forecast period. The Small & Medium Enterprises market is expected to witness a CAGR of 15.5% during (2026 - 2033).
Large enterprises lead adoption as multinational operations, extensive distributor networks, cross-border partnerships, and sophisticated channel programs require scalable partner management capabilities. These organizations increasingly prioritize automation, advanced analytics, enterprise integration, compliance controls, and multi-language functionality. Small & Medium Enterprises are benefiting from affordable cloud-based and SaaS solutions that provide simplified onboarding, essential partner collaboration tools, modular pricing, and scalable functionality without requiring significant infrastructure investment.
Application Outlook
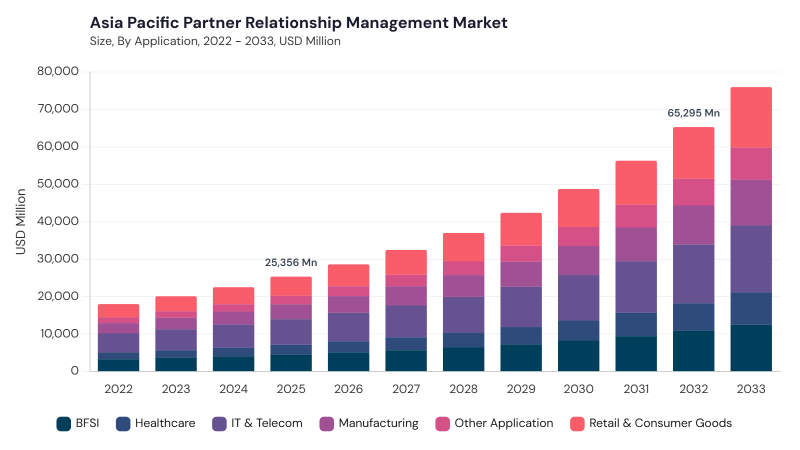
Based on Application, the market is segmented into IT & Telecom, Retail & Consumer Goods, BFSI, Manufacturing, Healthcare, and Other Application. IT & Telecom leads due to extensive software distribution networks, resellers, system integrators, cloud service partners, and complex technology ecosystems requiring scalable partner enablement. Retail & Consumer Goods focuses on distributor collaboration, omnichannel execution, promotions, and retailer management, while BFSI uses PRM for agents, brokers, and financial intermediaries with strong compliance requirements.
Manufacturing emphasizes dealer, distributor, service-partner, and supply chain coordination, whereas Healthcare focuses on secure engagement with pharmaceutical distributors, medical device suppliers, and healthcare partners. Other Application includes education, logistics, energy, hospitality, government-related ecosystems, and professional services.
Free Valuable Insights: Partner Relationship Management Market is Predicted to reach USD 287.0 Billion billion by 2033, at a CAGR of 14.3%
Country Outlook
Based on Country, the market is segmented into China, Japan, India, South Korea, Singapore, Malaysia, and Rest of Asia Pacific. The China market dominated the Asia Pacific Partner Relationship Management Market by Country in 2025, and would continue to be a dominant market till 2033; thereby, achieving a market value of USD 13.7 billion by 2030, growing at a CAGR of 13 % during the forecast period. The Japan market is expected to witness a CAGR of 14.1% during (2026 - 2033). Additionally, The India market is expected to witness a CAGR of 15.6% during (2026 - 2033).
China demonstrates increasing adoption of AI-enabled analytics, cloud architectures, omnichannel partner engagement, and localized data governance capabilities. Japan reflects a mature environment supported by AI-driven enablement, mobile accessibility, advanced security, and integration with broader enterprise platforms. India is advancing through cloud adoption, integrated PRM-CRM-ERP environments, localized functionality, and increasing use of analytics and automation. South Korea is characterized by sophisticated digital infrastructure, AI-based partner intelligence, cloud-native architectures, and expanding cross-border partner ecosystems.
Singapore benefits from advanced digital infrastructure, strong ecosystem integration, AI-powered analytics, scalable cloud adoption, and an emphasis on compliance and regional connectivity. Malaysia is progressing through cloud adoption, omnichannel partner engagement, localized functionality, predictive analytics, and stronger data governance requirements. Rest of Asia Pacific reflects diverse levels of digital maturity, with demand centered on scalable SaaS platforms, mobile accessibility, automation, interoperability, localization, and AI-enabled partner performance management.
List of Key Companies Profiled
- Salesforce, Inc.
- Impartner Software, Inc.
- ZINFI Technologies, Inc.
- Unifyr
- PartnerStack, Inc.
- Channelscaler
- Magentrix Corporation
- Mindmatrix, Inc.
- Channeltivity, LLC
- WorkSpan, Inc.
Asia Pacific Partner Relationship Management Market Report Segmentation
By Deployment
- Cloud
- On-Premise
By Component
- Software
- Services
- Training & Consultation
- Managed Services
- Other Services Type
By Organization Size
- Large Enterprise
- Small & Medium Enterprises
By Application
- IT & Telecom
- Retail & Consumer Goods
- BFSI
- Manufacturing
- Healthcare
- Other Application
By Country
- China
- Japan
- India
- South Korea
- Singapore
- Malaysia
- Rest of Asia Pacific
1.1 Market Overview
1.2 Key Factors Impacting Market
1.2.1 Market Drivers
1.2.2 Market Restraints
1.2.3 Market Opportunities
1.2.4 Market Challenges
1.2.5 Market Trends
1.2.6 State of Competition
1.2.7 Market Consolidation
1.2.8 Key Customer Criteria
1.3 Product Life Cycle
1.4 Segmentation By Delivery
1.4.1 Instant Delivery
1.4.2 Scheduled Delivery
1.5 Segmentation By Delivery Payment
1.5.1 Online
1.5.2 Cash
1.6 Segmentation By Product Category
1.6.1 Grocery & Staples
1.6.2 Packaged Food & Snacks
1.6.3 Personal Care & Beauty
1.6.4 Pharmacy / Health & Wellness
1.6.5 Household Products
1.6.6 Small Electronics & Accessories
1.6.7 Fashion & Lifestyle
1.6.8 Other Product Category
1.7 Segmentation By Country
1.7.1 China
1.7.1.1 Segmentation By Delivery
1.7.1.1.1 Instant Delivery
1.7.1.1.2 Scheduled Delivery
1.7.1.2 Segmentation By Delivery Payment
1.7.1.2.1 Online
1.7.1.2.2 Cash
1.7.1.3 Segmentation By Product Category
1.7.1.3.1 Grocery & Staples
1.7.1.3.2 Packaged Food & Snacks
1.7.1.3.3 Personal Care & Beauty
1.7.1.3.4 Pharmacy / Health & Wellness
1.7.1.3.5 Household Products
1.7.1.3.6 Small Electronics & Accessories
1.7.1.3.7 Fashion & Lifestyle
1.7.1.3.8 Other Product Category
1.7.2 Japan
1.7.2.1 Segmentation By Delivery
1.7.2.1.1 Instant Delivery
1.7.2.1.2 Scheduled Delivery
1.7.2.2 Segmentation By Delivery Payment
1.7.2.2.1 Online
1.7.2.2.2 Cash
1.7.2.3 Segmentation By Product Category
1.7.2.3.1 Grocery & Staples
1.7.2.3.2 Packaged Food & Snacks
1.7.2.3.3 Personal Care & Beauty
1.7.2.3.4 Pharmacy / Health & Wellness
1.7.2.3.5 Household Products
1.7.2.3.6 Small Electronics & Accessories
1.7.2.3.7 Fashion & Lifestyle
1.7.2.3.8 Other Product Category
1.7.3 India
1.7.3.1 Segmentation By Delivery
1.7.3.1.1 Instant Delivery
1.7.3.1.2 Scheduled Delivery
1.7.3.2 Segmentation By Delivery Payment
1.7.3.2.1 Online
1.7.3.2.2 Cash
1.7.3.3 Segmentation By Product Category
1.7.3.3.1 Grocery & Staples
1.7.3.3.2 Packaged Food & Snacks
1.7.3.3.3 Personal Care & Beauty
1.7.3.3.4 Pharmacy / Health & Wellness
1.7.3.3.5 Household Products
1.7.3.3.6 Small Electronics & Accessories
1.7.3.3.7 Fashion & Lifestyle
1.7.3.3.8 Other Product Category
1.7.4 South Korea
1.7.4.1 Segmentation By Delivery
1.7.4.1.1 Instant Delivery
1.7.4.1.2 Scheduled Delivery
1.7.4.2 Segmentation By Delivery Payment
1.7.4.2.1 Online
1.7.4.2.2 Cash
1.7.4.3 Segmentation By Product Category
1.7.4.3.1 Grocery & Staples
1.7.4.3.2 Packaged Food & Snacks
1.7.4.3.3 Personal Care & Beauty
1.7.4.3.4 Pharmacy / Health & Wellness
1.7.4.3.5 Household Products
1.7.4.3.6 Small Electronics & Accessories
1.7.4.3.7 Fashion & Lifestyle
1.7.4.3.8 Other Product Category
1.7.5 Singapore
1.7.5.1 Segmentation By Delivery
1.7.5.1.1 Instant Delivery
1.7.5.1.2 Scheduled Delivery
1.7.5.2 Segmentation By Delivery Payment
1.7.5.2.1 Online
1.7.5.2.2 Cash
1.7.5.3 Segmentation By Product Category
1.7.5.3.1 Grocery & Staples
1.7.5.3.2 Packaged Food & Snacks
1.7.5.3.3 Personal Care & Beauty
1.7.5.3.4 Pharmacy / Health & Wellness
1.7.5.3.5 Household Products
1.7.5.3.6 Small Electronics & Accessories
1.7.5.3.7 Fashion & Lifestyle
1.7.5.3.8 Other Product Category
1.7.6 Malaysia
1.7.6.1 Segmentation By Delivery
1.7.6.1.1 Instant Delivery
1.7.6.1.2 Scheduled Delivery
1.7.6.2 Segmentation By Delivery Payment
1.7.6.2.1 Online
1.7.6.2.2 Cash
1.7.6.3 Segmentation By Product Category
1.7.6.3.1 Grocery & Staples
1.7.6.3.2 Packaged Food & Snacks
1.7.6.3.3 Personal Care & Beauty
1.7.6.3.4 Pharmacy / Health & Wellness
1.7.6.3.5 Household Products
1.7.6.3.6 Small Electronics & Accessories
1.7.6.3.7 Fashion & Lifestyle
1.7.6.3.8 Other Product Category
1.7.7 Rest of Asia Pacific
1.7.7.1 Segmentation By Delivery
1.7.7.1.1 Instant Delivery
1.7.7.1.2 Scheduled Delivery
1.7.7.2 Segmentation By Delivery Payment
1.7.7.2.1 Online
1.7.7.2.2 Cash
1.7.7.3 Segmentation By Product Category
1.7.7.3.1 Grocery & Staples
1.7.7.3.2 Packaged Food & Snacks
1.7.7.3.3 Personal Care & Beauty
1.7.7.3.4 Pharmacy / Health & Wellness
1.7.7.3.5 Household Products
1.7.7.3.6 Small Electronics & Accessories
1.7.7.3.7 Fashion & Lifestyle
1.7.7.3.8 Other Product Category
Chapter 2. Company Snapshots
2.1 Meituan
2.1.1 Business Overview
2.1.2 Key Information
2.1.3 Company Focus on Quick Commerce Market
2.1.4 Strategic Insights
2.1.5 Strategy Deployed for Quick Commerce Market
2.1.6 Product & Service Portfolio
2.1.7 Representative Products / Services
2.1.8 Capability Overview
2.1.9 Technology & Innovation Focus
2.1.10 SWOT Analysis
2.1.11 Customers / End Users
2.1.12 Competitive Positioning
2.1.13 Key Differentiators
2.1.14 Portfolio Matrix
2.1.15 Analyst View
2.1.16 Future Outlook
2.2 Alibaba Group Holding Limited
2.2.1 Business Overview
2.2.2 Key Information
2.2.3 Company Focus on Quick Commerce Market
2.2.4 Strategic Insights on Quick Commerce Market
2.2.5 Strategy Deployed
2.2.6 Product & Service Portfolio
2.2.7 Representative Products / Services
2.2.8 Technology & Innovation Focus
2.2.9 SWOT Analysis
2.2.10 Customers / End Users
2.2.11 Competitive Positioning
2.2.12 Key Differentiators
2.2.13 Portfolio Matrix
2.2.14 Analyst View
2.2.15 Future Outlook
2.3 JD.com, Inc.
2.3.1 Business Overview
2.3.2 Key Information
2.3.3 Company Focus on Quick Commerce Market
2.3.4 Strategic Insights on Quick Commerce Market
2.3.5 Strategy Deployed for Quick Commerce Market
2.3.6 Product & Service Portfolio
2.3.7 Representative Products / Services
2.3.8 Capability Overview
2.3.9 Technology & Innovation Focus
2.3.10 SWOT Analysis
2.3.11 Customers / End Users
2.3.12 Competitive Positioning
2.3.13 Key Differentiators
2.3.14 Portfolio Matrix
2.3.15 Analyst View
2.3.16 Future Outlook for Quick Commerce Market
2.4 DoorDash, Inc.
2.4.1 Business Overview
2.4.2 Key Information
2.4.3 Company Focus on Quick Commerce Market
2.4.4 Strategic Insights
2.4.5 Strategy Deployed
2.4.6 Product & Service Portfolio
2.4.7 Representative Products / Services
2.4.8 Capability Overview
2.4.9 Technology & Innovation Focus
2.4.10 SWOT Analysis
2.4.11 Customers / End Users
2.4.12 Competitive Positioning
2.4.13 Key Differentiators
2.4.14 Portfolio Matrix
2.4.15 Analyst View
2.4.16 Future Outlook
2.5 Delivery Hero SE
2.5.1 Business Overview
2.5.2 Key Information
2.5.3 Company Focus on Quick Commerce Market
2.5.4 Strategic Insights on Quick Commerce Market
2.5.5 Strategy Deployed
2.5.6 Product & Service Portfolio
2.5.7 Representative Products / Services
2.5.8 Capability Overview
2.5.9 Technology & Innovation Focus
2.5.10 SWOT Analysis
2.5.11 Customers / End Users
2.5.12 Competitive Positioning
2.5.13 Key Differentiators
2.5.14 Portfolio Matrix
2.5.15 Analyst View
2.5.16 Future Outlook for Quick Commerce Market
2.6 Uber Technologies, Inc.
2.6.1 Business Overview
2.6.2 Key Information
2.6.3 Company Focus on Quick Commerce Market
2.6.4 Strategic Insights on Quick Commerce Market
2.6.5 Strategy Deployed for Quick Commerce Market
2.6.6 Product & Service Portfolio
2.6.7 Representative Products / Services
2.6.8 Capability Overview
2.6.9 Technology & Innovation Focus
2.6.10 SWOT Analysis
2.6.11 Customers / End Users
2.6.12 Competitive Positioning
2.6.13 Key Differentiators
2.6.14 Portfolio Matrix
2.6.15 Analyst View
2.6.16 Future Outlook
2.7 Zomato Ltd.
2.7.1 Business Overview 2.7.2 Key Information
2.7.3 Company Focus on Quick Commerce Market
2.7.4 Strategic Insights
2.7.5 Strategy Deployed for Quick Commerce Market
2.7.6 Product & Service Portfolio
2.7.7 Representative Products / Services
2.7.8 Capability Overview
2.7.9 Technology & Innovation Focus
2.7.10 SWOT Analysis
2.7.11 Customers / End Users
2.7.12 Competitive Positioning
2.7.13 Key Differentiators
2.7.14 Portfolio Matrix
2.7.15 Analyst View
2.7.16 Future Outlook for Quick Commerce Market
2.8 Swiggy Ltd.
2.8.1 Business Overview
2.8.2 Key Information
2.8.3 Company Focus on Quick Commerce Market
2.8.4 Strategic Insights on Quick Commerce Market
2.8.5 Strategy Deployed for Quick Commerce Market
2.8.6 Product & Service Portfolio
2.8.7 Representative Products / Services
2.8.8 Capability Overview
2.8.9 Technology & Innovation Focus
2.8.10 SWOT Analysis
2.8.11 Customers / End Users
2.8.12 Competitive Positioning
2.8.13 Key Differentiators
2.8.14 Portfolio Matrix
2.8.15 Analyst View
2.8.16 Future Outlook
2.9 Zepto
2.9.1 Business Overview
2.9.2 Key Information
2.9.3 Company Focus on Quick Commerce Market
2.9.4 Strategic Insights on Quick Commerce Market
2.9.5 Strategy Deployed for Quick Commerce Market
2.9.6 Product & Service Portfolio
2.9.7 Representative Products / Services
2.9.8 Capability Overview
2.9.9 Technology & Innovation Focus
2.9.10 SWOT Analysis
2.9.11 Customers / End Users
2.9.12 Competitive Positioning
2.9.13 Key Differentiators
2.9.14 Portfolio Matrix
2.9.15 Analyst View
2.9.16 Future Outlook
2.10 Grab Holdings Limited
2.10.1 Business Overview
2.10.2 Key Information
2.10.3 Company Focus on Quick Commerce Market
2.10.4 Strategic Insights on Quick Commerce Market
2.10.5 Strategy Deployed for Quick Commerce Market
2.10.6 Product & Service Portfolio
2.10.7 Representative Products / Services
2.10.8 Capability Overview
2.10.9 Technology & Innovation Focus
2.10.10 SWOT Analysis
2.10.11 Customers / End Users
2.10.12 Competitive Positioning
2.10.13 Key Differentiators
2.10.14 Portfolio Matrix
2.10.15 Analyst View
2.10.16 Future Outlook
Table 1 Asia Pacific Quick Commerce Market Market, 2022 - 2033, USD Million
Table 2 Asia Pacific Quick Commerce Market Market by Delivery, 2022 - 2033, USD Million
Table 3 Asia Pacific Instant Market, 2022 - 2033, USD Million
Table 4 Asia Pacific Scheduled Market, 2022 - 2033, USD Million
Table 5 Asia Pacific Quick Commerce Market Market by Delivery Payment, 2022 - 2033, USD Million
Table 6 Asia Pacific Cash Market, 2022 - 2033, USD Million
Table 7 Asia Pacific Online Market, 2022 - 2033, USD Million
Table 8 Asia Pacific Quick Commerce Market Market by Product Category, 2022 - 2033, USD Million
Table 9 Asia Pacific Fashion & Lifestyle Market, 2022 - 2033, USD Million
Table 10 Asia Pacific Grocery & Staples Market, 2022 - 2033, USD Million
Table 11 Asia Pacific Household Products Market, 2022 - 2033, USD Million
Table 12 Asia Pacific Other Product Category Market, 2022 - 2033, USD Million
Table 13 Asia Pacific Packaged Food & Snacks Market, 2022 - 2033, USD Million
Table 14 Asia Pacific Personal Care & Beauty Market, 2022 - 2033, USD Million
Table 15 Asia Pacific Pharmacy / Health & Wellness Market, 2022 - 2033, USD Million
Table 16 Asia Pacific Small Electronics & Accessories Market, 2022 - 2033, USD Million
Table 17 China Quick Commerce Market Market, 2022 - 2033, USD Million
Table 18 China Quick Commerce Market Market by Delivery, 2022 - 2033, USD Million
Table 19 China Instant Market, 2022 - 2033, USD Million
Table 20 China Scheduled Market, 2022 - 2033, USD Million
Table 21 China Quick Commerce Market Market by Delivery Payment, 2022 - 2033, USD Million
Table 22 China Cash Market, 2022 - 2033, USD Million
Table 23 China Online Market, 2022 - 2033, USD Million
Table 24 China Quick Commerce Market Market by Product Category, 2022 - 2033, USD Million
Table 25 China Fashion & Lifestyle Market, 2022 - 2033, USD Million
Table 26 China Grocery & Staples Market, 2022 - 2033, USD Million
Table 27 China Household Products Market, 2022 - 2033, USD Million
Table 28 China Other Product Category Market, 2022 - 2033, USD Million
Table 29 China Packaged Food & Snacks Market, 2022 - 2033, USD Million
Table 30 China Personal Care & Beauty Market, 2022 - 2033, USD Million
Table 31 China Pharmacy / Health & Wellness Market, 2022 - 2033, USD Million
Table 32 China Small Electronics & Accessories Market, 2022 - 2033, USD Million
Table 33 Japan Quick Commerce Market Market, 2022 - 2033, USD Million
Table 34 Japan Quick Commerce Market Market by Delivery, 2022 - 2033, USD Million
Table 35 Japan Instant Market, 2022 - 2033, USD Million
Table 36 Japan Scheduled Market, 2022 - 2033, USD Million
Table 37 Japan Quick Commerce Market Market by Delivery Payment, 2022 - 2033, USD Million
Table 38 Japan Cash Market, 2022 - 2033, USD Million
Table 39 Japan Online Market, 2022 - 2033, USD Million
Table 40 Japan Quick Commerce Market Market by Product Category, 2022 - 2033, USD Million
Table 41 Japan Fashion & Lifestyle Market, 2022 - 2033, USD Million
Table 42 Japan Grocery & Staples Market, 2022 - 2033, USD Million
Table 43 Japan Household Products Market, 2022 - 2033, USD Million
Table 44 Japan Other Product Category Market, 2022 - 2033, USD Million
Table 45 Japan Packaged Food & Snacks Market, 2022 - 2033, USD Million
Table 46 Japan Personal Care & Beauty Market, 2022 - 2033, USD Million
Table 47 Japan Pharmacy / Health & Wellness Market, 2022 - 2033, USD Million
Table 48 Japan Small Electronics & Accessories Market, 2022 - 2033, USD Million
Table 49 India Quick Commerce Market Market, 2022 - 2033, USD Million
Table 50 India Quick Commerce Market Market by Delivery, 2022 - 2033, USD Million
Table 51 India Instant Market, 2022 - 2033, USD Million
Table 52 India Scheduled Market, 2022 - 2033, USD Million
Table 53 India Quick Commerce Market Market by Delivery Payment, 2022 - 2033, USD Million
Table 54 India Cash Market, 2022 - 2033, USD Million
Table 55 India Online Market, 2022 - 2033, USD Million
Table 56 India Quick Commerce Market Market by Product Category, 2022 - 2033, USD Million
Table 57 India Fashion & Lifestyle Market, 2022 - 2033, USD Million
Table 58 India Grocery & Staples Market, 2022 - 2033, USD Million
Table 59 India Household Products Market, 2022 - 2033, USD Million
Table 60 India Other Product Category Market, 2022 - 2033, USD Million
Table 61 India Packaged Food & Snacks Market, 2022 - 2033, USD Million
Table 62 India Personal Care & Beauty Market, 2022 - 2033, USD Million
Table 63 India Pharmacy / Health & Wellness Market, 2022 - 2033, USD Million
Table 64 India Small Electronics & Accessories Market, 2022 - 2033, USD Million
Table 65 South Korea Quick Commerce Market Market, 2022 - 2033, USD Million
Table 66 South Korea Quick Commerce Market Market by Delivery, 2022 - 2033, USD Million
Table 67 South Korea Instant Market, 2022 - 2033, USD Million
Table 68 South Korea Scheduled Market, 2022 - 2033, USD Million
Table 69 South Korea Quick Commerce Market Market by Delivery Payment, 2022 - 2033, USD Million
Table 70 South Korea Cash Market, 2022 - 2033, USD Million
Table 71 South Korea Online Market, 2022 - 2033, USD Million
Table 72 South Korea Quick Commerce Market Market by Product Category, 2022 - 2033, USD Million
Table 73 South Korea Fashion & Lifestyle Market, 2022 - 2033, USD Million
Table 74 South Korea Grocery & Staples Market, 2022 - 2033, USD Million
Table 75 South Korea Household Products Market, 2022 - 2033, USD Million
Table 76 South Korea Other Product Category Market, 2022 - 2033, USD Million
Table 77 South Korea Packaged Food & Snacks Market, 2022 - 2033, USD Million
Table 78 South Korea Personal Care & Beauty Market, 2022 - 2033, USD Million
Table 79 South Korea Pharmacy / Health & Wellness Market, 2022 - 2033, USD Million
Table 80 South Korea Small Electronics & Accessories Market, 2022 - 2033, USD Million
Table 81 Singapore Quick Commerce Market Market, 2022 - 2033, USD Million
Table 82 Singapore Quick Commerce Market Market by Delivery, 2022 - 2033, USD Million
Table 83 Singapore Instant Market, 2022 - 2033, USD Million
Table 84 Singapore Scheduled Market, 2022 - 2033, USD Million
Table 85 Singapore Quick Commerce Market Market by Delivery Payment, 2022 - 2033, USD Million
Table 86 Singapore Cash Market, 2022 - 2033, USD Million
Table 87 Singapore Online Market, 2022 - 2033, USD Million
Table 88 Singapore Quick Commerce Market Market by Product Category, 2022 - 2033, USD Million
Table 89 Singapore Fashion & Lifestyle Market, 2022 - 2033, USD Million
Table 90 Singapore Grocery & Staples Market, 2022 - 2033, USD Million
Table 91 Singapore Household Products Market, 2022 - 2033, USD Million
Table 92 Singapore Other Product Category Market, 2022 - 2033, USD Million
Table 93 Singapore Packaged Food & Snacks Market, 2022 - 2033, USD Million
Table 94 Singapore Personal Care & Beauty Market, 2022 - 2033, USD Million
Table 95 Singapore Pharmacy / Health & Wellness Market, 2022 - 2033, USD Million
Table 96 Singapore Small Electronics & Accessories Market, 2022 - 2033, USD Million
Table 97 Malaysia Quick Commerce Market Market, 2022 - 2033, USD Million
Table 98 Malaysia Quick Commerce Market Market by Delivery, 2022 - 2033, USD Million
Table 99 Malaysia Instant Market, 2022 - 2033, USD Million
Table 100 Malaysia Scheduled Market, 2022 - 2033, USD Million
Table 101 Malaysia Quick Commerce Market Market by Delivery Payment, 2022 - 2033, USD Million
Table 102 Malaysia Cash Market, 2022 - 2033, USD Million
Table 103 Malaysia Online Market, 2022 - 2033, USD Million
Table 104 Malaysia Quick Commerce Market Market by Product Category, 2022 - 2033, USD Million
Table 105 Malaysia Fashion & Lifestyle Market, 2022 - 2033, USD Million
Table 106 Malaysia Grocery & Staples Market, 2022 - 2033, USD Million
Table 107 Malaysia Household Products Market, 2022 - 2033, USD Million
Table 108 Malaysia Other Product Category Market, 2022 - 2033, USD Million
Table 109 Malaysia Packaged Food & Snacks Market, 2022 - 2033, USD Million
Table 110 Malaysia Personal Care & Beauty Market, 2022 - 2033, USD Million
Table 111 Malaysia Pharmacy / Health & Wellness Market, 2022 - 2033, USD Million
Table 112 Malaysia Small Electronics & Accessories Market, 2022 - 2033, USD Million
Table 113 Rest of Asia Pacific Quick Commerce Market Market, 2022 - 2033, USD Million
Table 114 Rest of Asia Pacific Quick Commerce Market Market by Delivery, 2022 - 2033, USD Million
Table 115 Rest of Asia Pacific Instant Market, 2022 - 2033, USD Million
Table 116 Rest of Asia Pacific Scheduled Market, 2022 - 2033, USD Million
Table 117 Rest of Asia Pacific Quick Commerce Market Market by Delivery Payment, 2022 - 2033, USD Million
Table 118 Rest of Asia Pacific Cash Market, 2022 - 2033, USD Million
Table 119 Rest of Asia Pacific Online Market, 2022 - 2033, USD Million
Table 120 Rest of Asia Pacific Quick Commerce Market Market by Product Category, 2022 - 2033, USD Million
Table 121 Rest of Asia Pacific Fashion & Lifestyle Market, 2022 - 2033, USD Million
Table 122 Rest of Asia Pacific Grocery & Staples Market, 2022 - 2033, USD Million
Table 123 Rest of Asia Pacific Household Products Market, 2022 - 2033, USD Million
Table 124 Rest of Asia Pacific Other Product Category Market, 2022 - 2033, USD Million
Table 125 Rest of Asia Pacific Packaged Food & Snacks Market, 2022 - 2033, USD Million
Table 126 Rest of Asia Pacific Personal Care & Beauty Market, 2022 - 2033, USD Million
Table 127 Rest of Asia Pacific Pharmacy / Health & Wellness Market, 2022 - 2033, USD Million
Table 128 Rest of Asia Pacific Small Electronics & Accessories Market, 2022 - 2033, USD Million
List of Figures
FIG 1 Key Factors Impacting Market
FIG 2 Market Consolidation
FIG 3 Key Customer Criteria
FIG 4 Product Life Cycle
FIG 5 Asia Pacific Quick Commerce Market Market, 2022 - 2033, USD Million
FIG 6 Asia Pacific Quick Commerce Market Market by Delivery, 2022 - 2033, USD Million
FIG 7 Asia Pacific Instant Market, 2022 - 2033, USD Million
FIG 8 Asia Pacific Scheduled Market, 2022 - 2033, USD Million
FIG 9 Asia Pacific Quick Commerce Market Market by Delivery Payment, 2022 - 2033, USD Million
FIG 10 Asia Pacific Cash Market, 2022 - 2033, USD Million
FIG 11 Asia Pacific Online Market, 2022 - 2033, USD Million
FIG 12 Asia Pacific Quick Commerce Market Market by Product Category, 2022 - 2033, USD Million
FIG 13 Asia Pacific Fashion & Lifestyle Market, 2022 - 2033, USD Million
FIG 14 Asia Pacific Grocery & Staples Market, 2022 - 2033, USD Million
FIG 15 Asia Pacific Household Products Market, 2022 - 2033, USD Million
FIG 16 Asia Pacific Other Product Category Market, 2022 - 2033, USD Million
FIG 17 Asia Pacific Packaged Food & Snacks Market, 2022 - 2033, USD Million
FIG 18 Asia Pacific Personal Care & Beauty Market, 2022 - 2033, USD Million
FIG 19 Asia Pacific Pharmacy / Health & Wellness Market, 2022 - 2033, USD Million
FIG 20 Asia Pacific Small Electronics & Accessories Market, 2022 - 2033, USD Million
FIG 21 China Quick Commerce Market Market, 2022 - 2033, USD Million
FIG 22 China Quick Commerce Market Market by Delivery, 2022 - 2033, USD Million
FIG 23 China Instant Market, 2022 - 2033, USD Million
FIG 24 China Scheduled Market, 2022 - 2033, USD Million
FIG 25 China Quick Commerce Market Market by Delivery Payment, 2022 - 2033, USD Million
FIG 26 China Cash Market, 2022 - 2033, USD Million
FIG 27 China Online Market, 2022 - 2033, USD Million
FIG 28 China Quick Commerce Market Market by Product Category, 2022 - 2033, USD Million
FIG 29 China Fashion & Lifestyle Market, 2022 - 2033, USD Million
FIG 30 China Grocery & Staples Market, 2022 - 2033, USD Million
FIG 31 China Household Products Market, 2022 - 2033, USD Million
FIG 32 China Other Product Category Market, 2022 - 2033, USD Million
FIG 33 China Packaged Food & Snacks Market, 2022 - 2033, USD Million
FIG 34 China Personal Care & Beauty Market, 2022 - 2033, USD Million
FIG 35 China Pharmacy / Health & Wellness Market, 2022 - 2033, USD Million
FIG 36 China Small Electronics & Accessories Market, 2022 - 2033, USD Million
FIG 37 Japan Quick Commerce Market Market, 2022 - 2033, USD Million
FIG 38 Japan Quick Commerce Market Market by Delivery, 2022 - 2033, USD Million
FIG 39 Japan Instant Market, 2022 - 2033, USD Million
FIG 40 Japan Scheduled Market, 2022 - 2033, USD Million
FIG 41 Japan Quick Commerce Market Market by Delivery Payment, 2022 - 2033, USD Million
FIG 42 Japan Cash Market, 2022 - 2033, USD Million
FIG 43 Japan Online Market, 2022 - 2033, USD Million
FIG 44 Japan Quick Commerce Market Market by Product Category, 2022 - 2033, USD Million
FIG 45 Japan Fashion & Lifestyle Market, 2022 - 2033, USD Million
FIG 46 Japan Grocery & Staples Market, 2022 - 2033, USD Million
FIG 47 Japan Household Products Market, 2022 - 2033, USD Million
FIG 48 Japan Other Product Category Market, 2022 - 2033, USD Million
FIG 49 Japan Packaged Food & Snacks Market, 2022 - 2033, USD Million
FIG 50 Japan Personal Care & Beauty Market, 2022 - 2033, USD Million
FIG 51 Japan Pharmacy / Health & Wellness Market, 2022 - 2033, USD Million
FIG 52 Japan Small Electronics & Accessories Market, 2022 - 2033, USD Million
FIG 53 India Quick Commerce Market Market, 2022 - 2033, USD Million
FIG 54 India Quick Commerce Market Market by Delivery, 2022 - 2033, USD Million
FIG 55 India Instant Market, 2022 - 2033, USD Million
FIG 56 India Scheduled Market, 2022 - 2033, USD Million
FIG 57 India Quick Commerce Market Market by Delivery Payment, 2022 - 2033, USD Million
FIG 58 India Cash Market, 2022 - 2033, USD Million
FIG 59 India Online Market, 2022 - 2033, USD Million
FIG 60 India Quick Commerce Market Market by Product Category, 2022 - 2033, USD Million
FIG 61 India Fashion & Lifestyle Market, 2022 - 2033, USD Million
FIG 62 India Grocery & Staples Market, 2022 - 2033, USD Million
FIG 63 India Household Products Market, 2022 - 2033, USD Million
FIG 64 India Other Product Category Market, 2022 - 2033, USD Million
FIG 65 India Packaged Food & Snacks Market, 2022 - 2033, USD Million
FIG 66 India Personal Care & Beauty Market, 2022 - 2033, USD Million
FIG 67 India Pharmacy / Health & Wellness Market, 2022 - 2033, USD Million
FIG 68 India Small Electronics & Accessories Market, 2022 - 2033, USD Million
FIG 69 South Korea Quick Commerce Market Market, 2022 - 2033, USD Million
FIG 70 South Korea Quick Commerce Market Market by Delivery, 2022 - 2033, USD Million
FIG 71 South Korea Instant Market, 2022 - 2033, USD Million
FIG 72 South Korea Scheduled Market, 2022 - 2033, USD Million
FIG 73 South Korea Quick Commerce Market Market by Delivery Payment, 2022 - 2033, USD Million
FIG 74 South Korea Cash Market, 2022 - 2033, USD Million
FIG 75 South Korea Online Market, 2022 - 2033, USD Million
FIG 76 South Korea Quick Commerce Market Market by Product Category, 2022 - 2033, USD Million
FIG 77 South Korea Fashion & Lifestyle Market, 2022 - 2033, USD Million
FIG 78 South Korea Grocery & Staples Market, 2022 - 2033, USD Million
FIG 79 South Korea Household Products Market, 2022 - 2033, USD Million
FIG 80 South Korea Other Product Category Market, 2022 - 2033, USD Million
FIG 81 South Korea Packaged Food & Snacks Market, 2022 - 2033, USD Million
FIG 82 South Korea Personal Care & Beauty Market, 2022 - 2033, USD Million
FIG 83 South Korea Pharmacy / Health & Wellness Market, 2022 - 2033, USD Million
FIG 84 South Korea Small Electronics & Accessories Market, 2022 - 2033, USD Million
FIG 85 Singapore Quick Commerce Market Market, 2022 - 2033, USD Million
FIG 86 Singapore Quick Commerce Market Market by Delivery, 2022 - 2033, USD Million
FIG 87 Singapore Instant Market, 2022 - 2033, USD Million
FIG 88 Singapore Scheduled Market, 2022 - 2033, USD Million
FIG 89 Singapore Quick Commerce Market Market by Delivery Payment, 2022 - 2033, USD Million
FIG 90 Singapore Cash Market, 2022 - 2033, USD Million
FIG 91 Singapore Online Market, 2022 - 2033, USD Million
FIG 92 Singapore Quick Commerce Market Market by Product Category, 2022 - 2033, USD Million
FIG 93 Singapore Fashion & Lifestyle Market, 2022 - 2033, USD Million
FIG 94 Singapore Grocery & Staples Market, 2022 - 2033, USD Million
FIG 95 Singapore Household Products Market, 2022 - 2033, USD Million
FIG 96 Singapore Other Product Category Market, 2022 - 2033, USD Million
FIG 97 Singapore Packaged Food & Snacks Market, 2022 - 2033, USD Million
FIG 98 Singapore Personal Care & Beauty Market, 2022 - 2033, USD Million
FIG 99 Singapore Pharmacy / Health & Wellness Market, 2022 - 2033, USD Million
FIG 100 Singapore Small Electronics & Accessories Market, 2022 - 2033, USD Million
FIG 101 Malaysia Quick Commerce Market Market, 2022 - 2033, USD Million
FIG 102 Malaysia Quick Commerce Market Market by Delivery, 2022 - 2033, USD Million
FIG 103 Malaysia Instant Market, 2022 - 2033, USD Million
FIG 104 Malaysia Scheduled Market, 2022 - 2033, USD Million
FIG 105 Malaysia Quick Commerce Market Market by Delivery Payment, 2022 - 2033, USD Million
FIG 106 Malaysia Cash Market, 2022 - 2033, USD Million
FIG 107 Malaysia Online Market, 2022 - 2033, USD Million
FIG 108 Malaysia Quick Commerce Market Market by Product Category, 2022 - 2033, USD Million
FIG 109 Malaysia Fashion & Lifestyle Market, 2022 - 2033, USD Million
FIG 110 Malaysia Grocery & Staples Market, 2022 - 2033, USD Million
FIG 111 Malaysia Household Products Market, 2022 - 2033, USD Million
FIG 112 Malaysia Other Product Category Market, 2022 - 2033, USD Million
FIG 113 Malaysia Packaged Food & Snacks Market, 2022 - 2033, USD Million
FIG 114 Malaysia Personal Care & Beauty Market, 2022 - 2033, USD Million FIG 115 Malaysia Pharmacy / Health & Wellness Market, 2022 - 2033, USD Million
FIG 116 Malaysia Small Electronics & Accessories Market, 2022 - 2033, USD Million
FIG 117 Rest of Asia Pacific Quick Commerce Market Market, 2022 - 2033, USD Million
FIG 118 Rest of Asia Pacific Quick Commerce Market Market by Delivery, 2022 - 2033, USD Million
FIG 119 Rest of Asia Pacific Instant Market, 2022 - 2033, USD Million
FIG 120 Rest of Asia Pacific Scheduled Market, 2022 - 2033, USD Million
FIG 121 Rest of Asia Pacific Quick Commerce Market Market by Delivery Payment, 2022 - 2033, USD Million
FIG 122 Rest of Asia Pacific Cash Market, 2022 - 2033, USD Million
FIG 123 Rest of Asia Pacific Online Market, 2022 - 2033, USD Million
FIG 124 Rest of Asia Pacific Quick Commerce Market Market by Product Category, 2022 - 2033, USD Million
FIG 125 Rest of Asia Pacific Fashion & Lifestyle Market, 2022 - 2033, USD Million
FIG 126 Rest of Asia Pacific Grocery & Staples Market, 2022 - 2033, USD Million
FIG 127 Rest of Asia Pacific Household Products Market, 2022 - 2033, USD Million
FIG 128 Rest of Asia Pacific Other Product Category Market, 2022 - 2033, USD Million
FIG 129 Rest of Asia Pacific Packaged Food & Snacks Market, 2022 - 2033, USD Million
FIG 130 Rest of Asia Pacific Personal Care & Beauty Market, 2022 - 2033, USD Million
FIG 131 Rest of Asia Pacific Pharmacy / Health & Wellness Market, 2022 - 2033, USD Million
FIG 132 Rest of Asia Pacific Small Electronics & Accessories Market, 2022 - 2033, USD Million