Asia Pacific Docking Station Market Size, Share & Industry Analysis Report By Connectivity (Wired, and Wireless), By Product (Laptop, and Smartphones & Tablets), By Distribution Channel (Offline, and Online), By Country Outlook and Forecast, 2026 - 2033
Published Date : 02-Sep-2026 |
Pages: 218 |
Report Format: PDF + Excel |
COVID-19 Impact on the Asia Pacific Docking Station Market
The Asia Pacific Docking Station Market is expected to reach USD 587.5 million by 2030, growing at a CAGR of 7% during (2026 – 2033).
The Asia Pacific Docking Station Market originated with the rising adoption of portable computing devices, laptops, tablets, and mobile electronics across professional and consumer environments. Early docking stations mainly served as basic port replicators, helping users connect monitors, keyboards, mice, and external peripherals through simple interfaces. Over time, USB-C, Thunderbolt, DisplayPort, fast charging, wireless communication, and multi-display support transformed docking stations into advanced productivity hubs. The rise of hybrid work and mobile-first workflows further expanded their relevance across offices, homes, education, and creative industries.
The current Asia Pacific Docking Station Market is shaped by remote work, BYOD adoption, USB-C standardization, Thunderbolt integration, wireless docking, smart features, and growing demand for multi-device compatibility. Users increasingly prefer compact docking stations that support fast charging, 4K and 8K video output, high-speed data transfer, Ethernet access, and multiple peripherals through a single hub. Enterprises are using docking stations to improve workstation flexibility, simplify IT deployment, and support diverse device ecosystems. Manufacturers are also integrating biometric security, IoT compatibility, AI-enabled diagnostics, and energy-efficient designs.
Connectivity Outlook
Based on Connectivity, the market is segmented into Wired and Wireless. The Wired market dominated the Asia Pacific Docking Station Market by Connectivity in 2025, and would continue to be a dominant market till 2033; thereby, achieving a market value of USD 437.8 million by 2030, growing at a CAGR of 6.7 % during the forecast period. The Wireless market is expected to witness a CAGR of 7.8% during (2026 - 2033).
Wired docking stations lead due to their reliable connectivity, faster data transfer, stable power delivery, secure network access, and strong support for professional multi-display setups. USB-C, Thunderbolt, USB, HDMI, DisplayPort, and Ethernet-enabled docks remain widely used in enterprises, education, creative studios, government offices, and IT environments. Wireless docking is gaining traction as users prefer cable-free workspaces, flexible desk arrangements, and easier device switching. However, wireless adoption remains comparatively smaller due to bandwidth limits, security concerns, power delivery restrictions, and higher infrastructure dependence.
Product Outlook
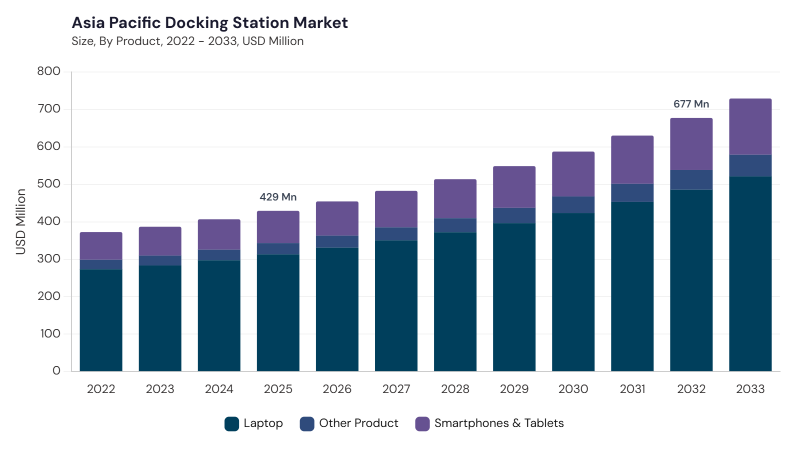
Based on Product, the market is segmented into Laptop, Smartphones & Tablets, and Other Product. The Laptop market dominated the Asia Pacific Docking Station Market by Product in 2025, and would continue to be a dominant market till 2033; thereby, achieving a market value of USD 423.4 million by 2030, growing at a CAGR of 6.7 % during the forecast period. The Smartphones & Tablets market is expected to witness a CAGR of 7.3% during (2026 - 2033).
Laptop docking stations lead due to their strong use in corporate offices, hybrid workspaces, IT services, finance, education, creative industries, and home office environments. These docks allow users to convert laptops into full workstation setups with multiple displays, keyboards, storage devices, Ethernet, charging, and audio peripherals. Smartphones and tablets docking stations are expanding as mobile devices become more useful for presentations, video calls, media workflows, retail operations, and mobile productivity. Other products include multi-device hubs, gaming docks, peripheral docks, USB hubs, video capture docks, and specialized docking platforms for niche applications.
Distribution Channel Outlook
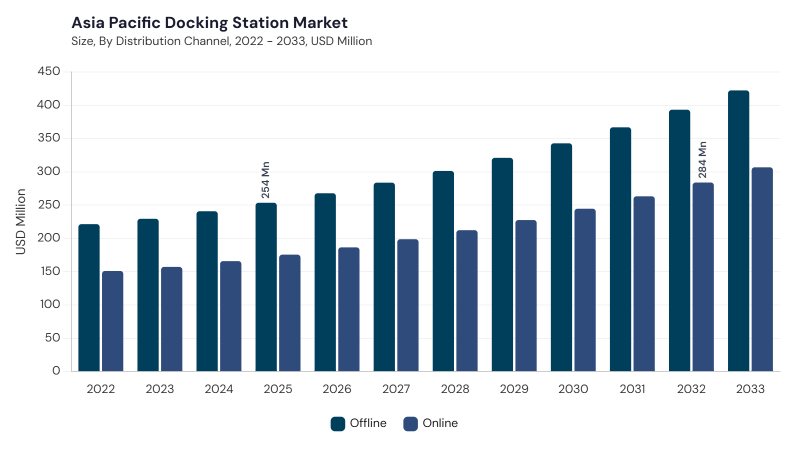
Based on Distribution Channel, the market is segmented into Offline and Online. Offline channels lead due to strong enterprise procurement, electronics specialty stores, IT distributors, system integrators, retail outlets, and business-to-business sales environments. This channel supports product demonstrations, compatibility guidance, immediate availability, customized support, and bulk purchasing for corporate, education, healthcare, and industrial buyers.
Online channels are growing rapidly due to e-commerce platforms, direct-to-consumer websites, regional marketplaces, product reviews, technical comparisons, and competitive pricing. Online sales are especially supported by remote work adoption, rising consumer awareness, and wider access across emerging Asia Pacific markets.
Free Valuable Insights: Docking Station Market is Predicted to reach USD 2.7 Billion billion by 2033, at a CAGR of 6.1%
Country Outlook
Based on Country, the market is segmented into China, Japan, India, South Korea, Singapore, Malaysia, and Rest of Asia Pacific. The China market dominated the Asia Pacific Docking Station Market by Country in 2025, and would continue to be a dominant market till 2033; thereby, achieving a market value of USD 181.6 million by 2030, growing at a CAGR of 5.3 % during the forecast period. The Japan market is expected to witness a CAGR of 6.2% during (2026 - 2033). Additionally, The India market is expected to witness a CAGR of 7.7% during (2026 - 2033).
China leads due to strong electronics manufacturing, large laptop and mobile device usage, USB-C and Thunderbolt adoption, local production capabilities, and growing demand from corporate and consumer technology users. Japan contributes through advanced computing ecosystems, high-quality device adoption, sustainability-focused design, and enterprise demand for reliable multi-functional docks. India supports growth through hybrid work adoption, SME digitization, startup ecosystem expansion, e-commerce growth, and demand for affordable docking solutions. South Korea, Singapore, and Malaysia add demand through advanced electronics ecosystems, smart workspaces, mobile productivity, and wireless docking adoption, while Rest of Asia Pacific benefits from digital transformation and rising portable device usage.
List of Key Companies Profiled
- Dell Technologies Inc.
- HP Inc.
- Lenovo Group Limited
- Kensington
- Targus
- Belkin International, Inc.
- StarTech.com Ltd.
- Plugable Technologies
- CalDigit, Inc.
- Anker Innovations Technology Co., Ltd.
Asia Pacific Docking Station Market Report Segmentation
By Connectivity
- Wired
- Wireless
By Product
- Laptop
- Smartphones & Tablets
- Other Product
By Distribution Channel
- Offline
- Online
By Country
- China
- Japan
- India
- South Korea
- Singapore
- Malaysia
- Rest of Asia Pacific
1.1 Market Overview
1.2 Key Factors Impacting Market
1.2.1 Market Drivers
1.2.2 Market Restraints
1.2.3 Market Opportunities
1.2.4 Market Challenges
1.2.5 Market Trends
1.2.6 State of Competition
1.2.7 Market Consolidation
1.2.8 Key Customer Criteria
1.3 Product Life Cycle
1.4 Segmentation By Category
1.4.1 One-sided
1.4.2 Two-sided
1.5 Segmentation By Projection Type
1.5.1 LED
1.5.2 LCD
1.6 Segmentation By Application
1.6.1 Indoor
1.6.2 Outdoor
1.7 Segmentation By Installation Type
1.7.1 Wall Mounted
1.7.2 Free Standing
1.7.3 Insert
1.8 Segmentation By End User
1.8.1 Residential
1.8.2 Commercial
1.9 Segmentation By Distribution Channel
1.9.1 Offline
1.9.2 Online
1.10 Segmentation By Country
1.10.1 China
1.10.1.1 Segmentation By Category
1.10.1.1.1 One-sided
1.10.1.1.2 Two-sided
1.10.1.2 Segmentation By Projection Type
1.10.1.2.1 LED
1.10.1.2.2 LCD
1.10.1.3 Segmentation By Application
1.10.1.3.1 Indoor
1.10.1.3.2 Outdoor
1.10.1.4 Segmentation By Installation Type
1.10.1.4.1 Wall Mounted
1.10.1.4.2 Free Standing
1.10.1.4.3 Insert
1.10.1.5 Segmentation By End User
1.10.1.5.1 Residential
1.10.1.5.2 Commercial
1.10.1.6 Segmentation By Distribution Channel
1.10.1.6.1 Offline
1.10.1.6.2 Online
1.10.2 Japan
1.10.2.1 Segmentation By Category
1.10.2.1.1 One-sided
1.10.2.1.2 Two-sided
1.10.2.2 Segmentation By Projection Type
1.10.2.2.1 LED
1.10.2.2.2 LCD
1.10.2.3 Segmentation By Application
1.10.2.3.1 Indoor
1.10.2.3.2 Outdoor
1.10.2.4 Segmentation By Installation Type
1.10.2.4.1 Wall Mounted
1.10.2.4.2 Free Standing
1.10.2.4.3 Insert
1.10.2.5 Segmentation By End User
1.10.2.5.1 Residential
1.10.2.5.2 Commercial
1.10.2.6 Segmentation By Distribution Channel
1.10.2.6.1 Offline
1.10.2.6.2 Online
1.10.3 India
1.10.3.1 Segmentation By Category
1.10.3.1.1 One-sided
1.10.3.1.2 Two-sided
1.10.3.2 Segmentation By Projection Type
1.10.3.2.1 LED
1.10.3.2.2 LCD
1.10.3.3 Segmentation By Application
1.10.3.3.1 Indoor
1.10.3.3.2 Outdoor
1.10.3.4 Segmentation By Installation Type
1.10.3.4.1 Wall Mounted
1.10.3.4.2 Free Standing
1.10.3.4.3 Insert
1.10.3.5 Segmentation By End User
1.10.3.5.1 Residential
1.10.3.5.2 Commercial
1.10.3.6 Segmentation By Distribution Channel
1.10.3.6.1 Offline
1.10.3.6.2 Online
1.10.4 South Korea
1.10.4.1 Segmentation By Category
1.10.4.1.1 One-sided
1.10.4.1.2 Two-sided
1.10.4.2 Segmentation By Projection Type
1.10.4.2.1 LED
1.10.4.2.2 LCD
1.10.4.3 Segmentation By Application
1.10.4.3.1 Indoor
1.10.4.3.2 Outdoor
1.10.4.4 Segmentation By Installation Type
1.10.4.4.1 Wall Mounted
1.10.4.4.2 Free Standing
1.10.4.4.3 Insert
1.10.4.5 Segmentation By End User
1.10.4.5.1 Residential
1.10.4.5.2 Commercial
1.10.4.6 Segmentation By Distribution Channel
1.10.4.6.1 Offline
1.10.4.6.2 Online
1.10.5 Singapore
1.10.5.1 Segmentation By Category
1.10.5.1.1 One-sided
1.10.5.1.2 Two-sided
1.10.5.2 Segmentation By Projection Type
1.10.5.2.1 LED
1.10.5.2.2 LCD
1.10.5.3 Segmentation By Application
1.10.5.3.1 Indoor
1.10.5.3.2 Outdoor
1.10.5.4 Segmentation By Installation Type
1.10.5.4.1 Wall Mounted
1.10.5.4.2 Free Standing
1.10.5.4.3 Insert
1.10.5.5 Segmentation By End User
1.10.5.5.1 Residential
1.10.5.5.2 Commercial
1.10.5.6 Segmentation By Distribution Channel
1.10.5.6.1 Offline
1.10.5.6.2 Online
1.10.6 Malaysia
1.10.6.1 Segmentation By Category
1.10.6.1.1 One-sided
1.10.6.1.2 Two-sided
1.10.6.2 Segmentation By Projection Type
1.10.6.2.1 LED
1.10.6.2.2 LCD
1.10.6.3 Segmentation By Application
1.10.6.3.1 Indoor
1.10.6.3.2 Outdoor
1.10.6.4 Segmentation By Installation Type
1.10.6.4.1 Wall Mounted
1.10.6.4.2 Free Standing
1.10.6.4.3 Insert
1.10.6.5 Segmentation By End User
1.10.6.5.1 Residential
1.10.6.5.2 Commercial
1.10.6.6 Segmentation By Distribution Channel
1.10.6.6.1 Offline
1.10.6.6.2 Online
1.10.7 Rest of Asia Pacific
1.10.7.1 Segmentation By Category
1.10.7.1.1 One-sided
1.10.7.1.2 Two-sided
1.10.7.2 Segmentation By Projection Type
1.10.7.2.1 LED
1.10.7.2.2 LCD
1.10.7.3 Segmentation By Application
1.10.7.3.1 Indoor
1.10.7.3.2 Outdoor
1.10.7.4 Segmentation By Installation Type
1.10.7.4.1 Wall Mounted
1.10.7.4.2 Free Standing
1.10.7.4.3 Insert
1.10.7.5 Segmentation By End User
1.10.7.5.1 Residential
1.10.7.5.2 Commercial
1.10.7.6 Segmentation By Distribution Channel
1.10.7.6.1 Offline
1.10.7.6.2 Online
Chapter 2. Company Snapshots
2.1 Glen Dimplex Group
2.1.1 Business Overview
2.1.2 Key Information
2.1.3 Company Focus on Electric Fireplace Market
2.1.4 Strategic Insights
2.1.5 Strategy Deployed
2.1.6 Product & Service Portfolio
2.1.7 Capability Overview
2.1.8 Technology & Innovation Focus
2.1.9 SWOT Analysis
2.1.10 Customers / End Users
2.1.11 Competitive Positioning
2.1.12 Key Differentiators
2.1.13 Portfolio Matrix
2.1.14 Analyst View
2.1.15 Future Outlook
2.2 Twin-Star International, Inc.
2.2.1 Business Overview
2.2.2 Key Information
2.2.3 Company Focus on Electric Fireplace Market
2.2.4 Strategic Insights
2.2.5 Strategy Deployed
2.2.6 Product & Service Portfolio
2.2.7 Representative Brands
2.2.8 Capability Overview
2.2.9 Technology & Innovation Focus
2.2.10 SWOT Analysis
2.2.11 Customers / End Users
2.2.12 Competitive Positioning
2.2.13 Key Differentiators
2.2.14 Portfolio Matrix
2.2.15 Analyst View
2.2.16 Future Outlook
2.3 Wolf Steel Ltd.
2.3.1 Business Overview
2.3.2 Key Information
2.3.3 Company Focus on Electric Fireplace Market
2.3.4 Strategic Insights
2.3.5 Strategy Deployed
2.3.6 Product & Service Portfolio
2.3.7 Representative Products
2.3.8 Capability Overview
2.3.9 Technology & Innovation Focus
2.3.10 SWOT Analysis
2.3.11 Customers / End Users
2.3.12 Competitive Positioning
2.3.13 Key Differentiators
2.3.14 Portfolio Matrix
2.3.15 Analyst View
2.3.16 Future Outlook
2.4 Hearth & Home Technologies, LLC
2.4.1 Business Overview
2.4.2 Key Information
2.4.3 Company Focus on Electric Fireplace Market
2.4.4 Strategic Insights
2.4.5 Strategy Deployed
2.4.6 Product & Service Portfolio
2.4.7 Representative Products
2.4.8 Technology & Innovation Focus
2.4.9 SWOT Analysis
2.4.10 Customers / End Users
2.4.11 Competitive Positioning
2.4.12 Key Differentiators
2.4.13 Analyst View
2.4.14 Future Outlook
2.5 Amantii Electric Fireplaces
2.5.1 Business Overview
2.5.2 Key Information
2.5.3 Company Focus on Electric Fireplace Market
2.5.4 Strategic Insights
2.5.5 Strategy Deployed 2.5.6 Product & Service Portfolio
2.5.7 Representative Brands
2.5.8 Capability Overview
2.5.9 Technology & Innovation Focus
2.5.10 SWOT Analysis
2.5.11 Customers / End Users
2.5.12 Competitive Positioning
2.5.13 Key Differentiators
2.5.14 Portfolio Matrix
2.5.15 Analyst View
2.5.16 Future Outlook
2.6 Stovax Heating Group
2.6.1 Business Overview
2.6.2 Key Information
2.6.3 Company Focus on Electric Fireplace Market
2.6.4 Strategic Insights
2.6.5 Strategy Deployed
2.6.6 Product & Service Portfolio
2.6.7 Representative Brands
2.6.8 Capability Overview
2.6.9 Technology & Innovation Focus
2.6.10 SWOT Analysis
2.6.11 Customers / End Users
2.6.12 Competitive Positioning
2.6.13 Key Differentiators
2.6.14 Portfolio Matrix
2.6.15 Analyst View
2.6.16 Future Outlook
2.7 Modern Flames
2.7.1 Business Overview
2.7.2 Key Information
2.7.3 Company Focus on Electric Fireplace Market
2.7.4 Strategic Insights
2.7.5 Strategy Deployed
2.7.6 Product & Service Portfolio
2.7.7 Representative Products
2.7.8 Capability Overview
2.7.9 Technology & Innovation Focus
2.7.10 SWOT Analysis
2.7.11 Customers / End Users
2.7.12 Competitive Positioning
2.7.13 Key Differentiators
2.7.14 Portfolio Matrix
2.7.15 Analyst View
2.7.16 Future Outlook
2.8 Touchstone Home Products, Inc.
2.8.1 Business Overview
2.8.2 Key Information
2.8.3 Company Focus on Electric Fireplace Market
2.8.4 Strategic Insights
2.8.5 Strategy Deployed
2.8.6 Product & Service Portfolio
2.8.7 Representative Products
2.8.8 Capability Overview
2.8.9 Technology & Innovation Focus
2.8.10 SWOT Analysis
2.8.11 Customers / End Users
2.8.12 Competitive Positioning
2.8.13 Key Differentiators
2.8.14 Portfolio Matrix
2.8.15 Analyst View
2.8.16 Future Outlook
2.9 Real Flame
2.9.1 Business Overview
2.9.2 Key Information
2.9.3 Company Focus on Electric Fireplace Market
2.9.4 Strategic Insights
2.9.5 Strategy Deployed
2.9.6 Product & Service Portfolio
2.9.7 Representative Products
2.9.8 Technology & Innovation Focus
2.9.9 SWOT Analysis
2.9.10 Customers / End Users
2.9.11 Competitive Positioning
2.9.12 Key Differentiators
2.9.13 Portfolio Matrix
2.9.14 Analyst View
2.9.15 Future Outlook
2.10 British Fires Ltd.
2.10.1 Business Overview
2.10.2 Key Information
2.10.3 Company Focus on Electric Fireplace Market
2.10.4 Strategic Insights
2.10.5 Strategy Deployed
2.10.6 Product & Service Portfolio
2.10.7 Representative Products
2.10.8 Capability Overview
2.10.9 Technology & Innovation Focus
2.10.10 SWOT Analysis
2.10.11 Customers / End Users
2.10.12 Competitive Positioning
2.10.13 Key Differentiators
2.10.14 Portfolio Matrix
2.10.15 Analyst View
2.10.16 Future Outlook
Table 1 Asia Pacific Electric Fireplace Market Market, 2022 - 2033, USD Million
Table 2 Asia Pacific Electric Fireplace Market Market by Application, 2022 - 2033, USD Million
Table 3 Asia Pacific Indoor Market, 2022 - 2033, USD Million
Table 4 Asia Pacific Outdoor Market, 2022 - 2033, USD Million
Table 5 Asia Pacific Electric Fireplace Market Market by Category, 2022 - 2033, USD Million
Table 6 Asia Pacific One-sided Market, 2022 - 2033, USD Million
Table 7 Asia Pacific Two-sided Market, 2022 - 2033, USD Million
Table 8 Asia Pacific Electric Fireplace Market Market by Distribution Channel, 2022 - 2033, USD Million
Table 9 Asia Pacific Offline Market, 2022 - 2033, USD Million
Table 10 Asia Pacific Online Market, 2022 - 2033, USD Million
Table 11 Asia Pacific Electric Fireplace Market Market by End User, 2022 - 2033, USD Million
Table 12 Asia Pacific Commercial Market, 2022 - 2033, USD Million
Table 13 Asia Pacific Residential Market, 2022 - 2033, USD Million
Table 14 Asia Pacific Electric Fireplace Market Market by Installation Type, 2022 - 2033, USD Million
Table 15 Asia Pacific Free Standing Market, 2022 - 2033, USD Million
Table 16 Asia Pacific Insert Market, 2022 - 2033, USD Million
Table 17 Asia Pacific Wall Mounted Market, 2022 - 2033, USD Million
Table 18 Asia Pacific Electric Fireplace Market Market by Projection Type, 2022 - 2033, USD Million
Table 19 Asia Pacific LCD Market, 2022 - 2033, USD Million
Table 20 Asia Pacific LED Market, 2022 - 2033, USD Million
Table 21 China Electric Fireplace Market Market, 2022 - 2033, USD Million
Table 22 China Electric Fireplace Market Market by Application, 2022 - 2033, USD Million
Table 23 China Indoor Market, 2022 - 2033, USD Million
Table 24 China Outdoor Market, 2022 - 2033, USD Million
Table 25 China Electric Fireplace Market Market by Category, 2022 - 2033, USD Million
Table 26 China One-sided Market, 2022 - 2033, USD Million
Table 27 China Two-sided Market, 2022 - 2033, USD Million
Table 28 China Electric Fireplace Market Market by Distribution Channel, 2022 - 2033, USD Million
Table 29 China Offline Market, 2022 - 2033, USD Million
Table 30 China Online Market, 2022 - 2033, USD Million
Table 31 China Electric Fireplace Market Market by End User, 2022 - 2033, USD Million
Table 32 China Commercial Market, 2022 - 2033, USD Million
Table 33 China Residential Market, 2022 - 2033, USD Million
Table 34 China Electric Fireplace Market Market by Installation Type, 2022 - 2033, USD Million
Table 35 China Free Standing Market, 2022 - 2033, USD Million
Table 36 China Insert Market, 2022 - 2033, USD Million
Table 37 China Wall Mounted Market, 2022 - 2033, USD Million
Table 38 China Electric Fireplace Market Market by Projection Type, 2022 - 2033, USD Million
Table 39 China LCD Market, 2022 - 2033, USD Million
Table 40 China LED Market, 2022 - 2033, USD Million
Table 41 Japan Electric Fireplace Market Market, 2022 - 2033, USD Million
Table 42 Japan Electric Fireplace Market Market by Application, 2022 - 2033, USD Million
Table 43 Japan Indoor Market, 2022 - 2033, USD Million
Table 44 Japan Outdoor Market, 2022 - 2033, USD Million
Table 45 Japan Electric Fireplace Market Market by Category, 2022 - 2033, USD Million
Table 46 Japan One-sided Market, 2022 - 2033, USD Million
Table 47 Japan Two-sided Market, 2022 - 2033, USD Million
Table 48 Japan Electric Fireplace Market Market by Distribution Channel, 2022 - 2033, USD Million
Table 49 Japan Offline Market, 2022 - 2033, USD Million
Table 50 Japan Online Market, 2022 - 2033, USD Million
Table 51 Japan Electric Fireplace Market Market by End User, 2022 - 2033, USD Million
Table 52 Japan Commercial Market, 2022 - 2033, USD Million
Table 53 Japan Residential Market, 2022 - 2033, USD Million
Table 54 Japan Electric Fireplace Market Market by Installation Type, 2022 - 2033, USD Million
Table 55 Japan Free Standing Market, 2022 - 2033, USD Million
Table 56 Japan Insert Market, 2022 - 2033, USD Million
Table 57 Japan Wall Mounted Market, 2022 - 2033, USD Million
Table 58 Japan Electric Fireplace Market Market by Projection Type, 2022 - 2033, USD Million
Table 59 Japan LCD Market, 2022 - 2033, USD Million
Table 60 Japan LED Market, 2022 - 2033, USD Million
Table 61 India Electric Fireplace Market Market, 2022 - 2033, USD Million
Table 62 India Electric Fireplace Market Market by Application, 2022 - 2033, USD Million
Table 63 India Indoor Market, 2022 - 2033, USD Million
Table 64 India Outdoor Market, 2022 - 2033, USD Million
Table 65 India Electric Fireplace Market Market by Category, 2022 - 2033, USD Million
Table 66 India One-sided Market, 2022 - 2033, USD Million
Table 67 India Two-sided Market, 2022 - 2033, USD Million
Table 68 India Electric Fireplace Market Market by Distribution Channel, 2022 - 2033, USD Million
Table 69 India Offline Market, 2022 - 2033, USD Million
Table 70 India Online Market, 2022 - 2033, USD Million
Table 71 India Electric Fireplace Market Market by End User, 2022 - 2033, USD Million
Table 72 India Commercial Market, 2022 - 2033, USD Million
Table 73 India Residential Market, 2022 - 2033, USD Million
Table 74 India Electric Fireplace Market Market by Installation Type, 2022 - 2033, USD Million
Table 75 India Free Standing Market, 2022 - 2033, USD Million
Table 76 India Insert Market, 2022 - 2033, USD Million
Table 77 India Wall Mounted Market, 2022 - 2033, USD Million
Table 78 India Electric Fireplace Market Market by Projection Type, 2022 - 2033, USD Million
Table 79 India LCD Market, 2022 - 2033, USD Million
Table 80 India LED Market, 2022 - 2033, USD Million
Table 81 South Korea Electric Fireplace Market Market, 2022 - 2033, USD Million
Table 82 South Korea Electric Fireplace Market Market by Application, 2022 - 2033, USD Million
Table 83 South Korea Indoor Market, 2022 - 2033, USD Million
Table 84 South Korea Outdoor Market, 2022 - 2033, USD Million
Table 85 South Korea Electric Fireplace Market Market by Category, 2022 - 2033, USD Million
Table 86 South Korea One-sided Market, 2022 - 2033, USD Million
Table 87 South Korea Two-sided Market, 2022 - 2033, USD Million
Table 88 South Korea Electric Fireplace Market Market by Distribution Channel, 2022 - 2033, USD Million
Table 89 South Korea Offline Market, 2022 - 2033, USD Million
Table 90 South Korea Online Market, 2022 - 2033, USD Million
Table 91 South Korea Electric Fireplace Market Market by End User, 2022 - 2033, USD Million
Table 92 South Korea Commercial Market, 2022 - 2033, USD Million
Table 93 South Korea Residential Market, 2022 - 2033, USD Million
Table 94 South Korea Electric Fireplace Market Market by Installation Type, 2022 - 2033, USD Million
Table 95 South Korea Free Standing Market, 2022 - 2033, USD Million
Table 96 South Korea Insert Market, 2022 - 2033, USD Million
Table 97 South Korea Wall Mounted Market, 2022 - 2033, USD Million
Table 98 South Korea Electric Fireplace Market Market by Projection Type, 2022 - 2033, USD Million
Table 99 South Korea LCD Market, 2022 - 2033, USD Million
Table 100 South Korea LED Market, 2022 - 2033, USD Million
Table 101 Singapore Electric Fireplace Market Market, 2022 - 2033, USD Million
Table 102 Singapore Electric Fireplace Market Market by Application, 2022 - 2033, USD Million
Table 103 Singapore Indoor Market, 2022 - 2033, USD Million
Table 104 Singapore Outdoor Market, 2022 - 2033, USD Million
Table 105 Singapore Electric Fireplace Market Market by Category, 2022 - 2033, USD Million
Table 106 Singapore One-sided Market, 2022 - 2033, USD Million
Table 107 Singapore Two-sided Market, 2022 - 2033, USD Million
Table 108 Singapore Electric Fireplace Market Market by Distribution Channel, 2022 - 2033, USD Million
Table 109 Singapore Offline Market, 2022 - 2033, USD Million
Table 110 Singapore Online Market, 2022 - 2033, USD Million
Table 111 Singapore Electric Fireplace Market Market by End User, 2022 - 2033, USD Million
Table 112 Singapore Commercial Market, 2022 - 2033, USD Million
Table 113 Singapore Residential Market, 2022 - 2033, USD Million
Table 114 Singapore Electric Fireplace Market Market by Installation Type, 2022 - 2033, USD Million
Table 115 Singapore Free Standing Market, 2022 - 2033, USD Million
Table 116 Singapore Insert Market, 2022 - 2033, USD Million
Table 117 Singapore Wall Mounted Market, 2022 - 2033, USD Million
Table 118 Singapore Electric Fireplace Market Market by Projection Type, 2022 - 2033, USD Million
Table 119 Singapore LCD Market, 2022 - 2033, USD Million
Table 120 Singapore LED Market, 2022 - 2033, USD Million
Table 121 Malaysia Electric Fireplace Market Market, 2022 - 2033, USD Million
Table 122 Malaysia Electric Fireplace Market Market by Application, 2022 - 2033, USD Million
Table 123 Malaysia Indoor Market, 2022 - 2033, USD Million
Table 124 Malaysia Outdoor Market, 2022 - 2033, USD Million
Table 125 Malaysia Electric Fireplace Market Market by Category, 2022 - 2033, USD Million
Table 126 Malaysia One-sided Market, 2022 - 2033, USD Million
Table 127 Malaysia Two-sided Market, 2022 - 2033, USD Million
Table 128 Malaysia Electric Fireplace Market Market by Distribution Channel, 2022 - 2033, USD Million
Table 129 Malaysia Offline Market, 2022 - 2033, USD Million
Table 130 Malaysia Online Market, 2022 - 2033, USD Million
Table 131 Malaysia Electric Fireplace Market Market by End User, 2022 - 2033, USD Million
Table 132 Malaysia Commercial Market, 2022 - 2033, USD Million
Table 133 Malaysia Residential Market, 2022 - 2033, USD Million
Table 134 Malaysia Electric Fireplace Market Market by Installation Type, 2022 - 2033, USD Million
Table 135 Malaysia Free Standing Market, 2022 - 2033, USD Million
Table 136 Malaysia Insert Market, 2022 - 2033, USD Million
Table 137 Malaysia Wall Mounted Market, 2022 - 2033, USD Million
Table 138 Malaysia Electric Fireplace Market Market by Projection Type, 2022 - 2033, USD Million
Table 139 Malaysia LCD Market, 2022 - 2033, USD Million
Table 140 Malaysia LED Market, 2022 - 2033, USD Million
Table 141 Rest of Asia Pacific Electric Fireplace Market Market, 2022 - 2033, USD Million
Table 142 Rest of Asia Pacific Electric Fireplace Market Market by Application, 2022 - 2033, USD Million
Table 143 Rest of Asia Pacific Indoor Market, 2022 - 2033, USD Million
Table 144 Rest of Asia Pacific Outdoor Market, 2022 - 2033, USD Million
Table 145 Rest of Asia Pacific Electric Fireplace Market Market by Category, 2022 - 2033, USD Million
Table 146 Rest of Asia Pacific One-sided Market, 2022 - 2033, USD Million
Table 147 Rest of Asia Pacific Two-sided Market, 2022 - 2033, USD Million
Table 148 Rest of Asia Pacific Electric Fireplace Market Market by Distribution Channel, 2022 - 2033, USD Million
Table 149 Rest of Asia Pacific Offline Market, 2022 - 2033, USD Million
Table 150 Rest of Asia Pacific Online Market, 2022 - 2033, USD Million
Table 151 Rest of Asia Pacific Electric Fireplace Market Market by End User, 2022 - 2033, USD Million
Table 152 Rest of Asia Pacific Commercial Market, 2022 - 2033, USD Million
Table 153 Rest of Asia Pacific Residential Market, 2022 - 2033, USD Million
Table 154 Rest of Asia Pacific Electric Fireplace Market Market by Installation Type, 2022 - 2033, USD Million
Table 155 Rest of Asia Pacific Free Standing Market, 2022 - 2033, USD Million
Table 156 Rest of Asia Pacific Insert Market, 2022 - 2033, USD Million
Table 157 Rest of Asia Pacific Wall Mounted Market, 2022 - 2033, USD Million
Table 158 Rest of Asia Pacific Electric Fireplace Market Market by Projection Type, 2022 - 2033, USD Million
Table 159 Rest of Asia Pacific LCD Market, 2022 - 2033, USD Million
Table 160 Rest of Asia Pacific LED Market, 2022 - 2033, USD Million
List of Figures
FIG 1 Key Factors Impacting Market
FIG 2 Market Consolidation
FIG 3 Key Customer Criteria
FIG 4 Product Life Cycle
FIG 5 Asia Pacific Electric Fireplace Market Market, 2022 - 2033, USD Million
FIG 6 Asia Pacific Electric Fireplace Market Market by Application, 2022 - 2033, USD Million
FIG 7 Asia Pacific Indoor Market, 2022 - 2033, USD Million
FIG 8 Asia Pacific Outdoor Market, 2022 - 2033, USD Million
FIG 9 Asia Pacific Electric Fireplace Market Market by Category, 2022 - 2033, USD Million
FIG 10 Asia Pacific One-sided Market, 2022 - 2033, USD Million
FIG 11 Asia Pacific Two-sided Market, 2022 - 2033, USD Million
FIG 12 Asia Pacific Electric Fireplace Market Market by Distribution Channel, 2022 - 2033, USD Million
FIG 13 Asia Pacific Offline Market, 2022 - 2033, USD Million
FIG 14 Asia Pacific Online Market, 2022 - 2033, USD Million
FIG 15 Asia Pacific Electric Fireplace Market Market by End User, 2022 - 2033, USD Million
FIG 16 Asia Pacific Commercial Market, 2022 - 2033, USD Million
FIG 17 Asia Pacific Residential Market, 2022 - 2033, USD Million
FIG 18 Asia Pacific Electric Fireplace Market Market by Installation Type, 2022 - 2033, USD Million
FIG 19 Asia Pacific Free Standing Market, 2022 - 2033, USD Million
FIG 20 Asia Pacific Insert Market, 2022 - 2033, USD Million
FIG 21 Asia Pacific Wall Mounted Market, 2022 - 2033, USD Million
FIG 22 Asia Pacific Electric Fireplace Market Market by Projection Type, 2022 - 2033, USD Million
FIG 23 Asia Pacific LCD Market, 2022 - 2033, USD Million
FIG 24 Asia Pacific LED Market, 2022 - 2033, USD Million
FIG 25 China Electric Fireplace Market Market, 2022 - 2033, USD Million
FIG 26 China Electric Fireplace Market Market by Application, 2022 - 2033, USD Million
FIG 27 China Indoor Market, 2022 - 2033, USD Million
FIG 28 China Outdoor Market, 2022 - 2033, USD Million
FIG 29 China Electric Fireplace Market Market by Category, 2022 - 2033, USD Million
FIG 30 China One-sided Market, 2022 - 2033, USD Million
FIG 31 China Two-sided Market, 2022 - 2033, USD Million
FIG 32 China Electric Fireplace Market Market by Distribution Channel, 2022 - 2033, USD Million
FIG 33 China Offline Market, 2022 - 2033, USD Million
FIG 34 China Online Market, 2022 - 2033, USD Million
FIG 35 China Electric Fireplace Market Market by End User, 2022 - 2033, USD Million
FIG 36 China Commercial Market, 2022 - 2033, USD Million
FIG 37 China Residential Market, 2022 - 2033, USD Million
FIG 38 China Electric Fireplace Market Market by Installation Type, 2022 - 2033, USD Million
FIG 39 China Free Standing Market, 2022 - 2033, USD Million
FIG 40 China Insert Market, 2022 - 2033, USD Million
FIG 41 China Wall Mounted Market, 2022 - 2033, USD Million
FIG 42 China Electric Fireplace Market Market by Projection Type, 2022 - 2033, USD Million
FIG 43 China LCD Market, 2022 - 2033, USD Million
FIG 44 China LED Market, 2022 - 2033, USD Million
FIG 45 Japan Electric Fireplace Market Market, 2022 - 2033, USD Million
FIG 46 Japan Electric Fireplace Market Market by Application, 2022 - 2033, USD Million
FIG 47 Japan Indoor Market, 2022 - 2033, USD Million
FIG 48 Japan Outdoor Market, 2022 - 2033, USD Million
FIG 49 Japan Electric Fireplace Market Market by Category, 2022 - 2033, USD Million
FIG 50 Japan One-sided Market, 2022 - 2033, USD Million
FIG 51 Japan Two-sided Market, 2022 - 2033, USD Million
FIG 52 Japan Electric Fireplace Market Market by Distribution Channel, 2022 - 2033, USD Million
FIG 53 Japan Offline Market, 2022 - 2033, USD Million
FIG 54 Japan Online Market, 2022 - 2033, USD Million
FIG 55 Japan Electric Fireplace Market Market by End User, 2022 - 2033, USD Million
FIG 56 Japan Commercial Market, 2022 - 2033, USD Million
FIG 57 Japan Residential Market, 2022 - 2033, USD Million
FIG 58 Japan Electric Fireplace Market Market by Installation Type, 2022 - 2033, USD Million
FIG 59 Japan Free Standing Market, 2022 - 2033, USD Million
FIG 60 Japan Insert Market, 2022 - 2033, USD Million
FIG 61 Japan Wall Mounted Market, 2022 - 2033, USD Million
FIG 62 Japan Electric Fireplace Market Market by Projection Type, 2022 - 2033, USD Million
FIG 63 Japan LCD Market, 2022 - 2033, USD Million
FIG 64 Japan LED Market, 2022 - 2033, USD Million
FIG 65 India Electric Fireplace Market Market, 2022 - 2033, USD Million
FIG 66 India Electric Fireplace Market Market by Application, 2022 - 2033, USD Million
FIG 67 India Indoor Market, 2022 - 2033, USD Million
FIG 68 India Outdoor Market, 2022 - 2033, USD Million
FIG 69 India Electric Fireplace Market Market by Category, 2022 - 2033, USD Million
FIG 70 India One-sided Market, 2022 - 2033, USD Million
FIG 71 India Two-sided Market, 2022 - 2033, USD Million
FIG 72 India Electric Fireplace Market Market by Distribution Channel, 2022 - 2033, USD Million
FIG 73 India Offline Market, 2022 - 2033, USD Million
FIG 74 India Online Market, 2022 - 2033, USD Million
FIG 75 India Electric Fireplace Market Market by End User, 2022 - 2033, USD Million
FIG 76 India Commercial Market, 2022 - 2033, USD Million
FIG 77 India Residential Market, 2022 - 2033, USD Million
FIG 78 India Electric Fireplace Market Market by Installation Type, 2022 - 2033, USD Million
FIG 79 India Free Standing Market, 2022 - 2033, USD Million
FIG 80 India Insert Market, 2022 - 2033, USD Million
FIG 81 India Wall Mounted Market, 2022 - 2033, USD Million
FIG 82 India Electric Fireplace Market Market by Projection Type, 2022 - 2033, USD Million FIG 83 India LCD Market, 2022 - 2033, USD Million
FIG 84 India LED Market, 2022 - 2033, USD Million
FIG 85 South Korea Electric Fireplace Market Market, 2022 - 2033, USD Million
FIG 86 South Korea Electric Fireplace Market Market by Application, 2022 - 2033, USD Million
FIG 87 South Korea Indoor Market, 2022 - 2033, USD Million
FIG 88 South Korea Outdoor Market, 2022 - 2033, USD Million
FIG 89 South Korea Electric Fireplace Market Market by Category, 2022 - 2033, USD Million
FIG 90 South Korea One-sided Market, 2022 - 2033, USD Million
FIG 91 South Korea Two-sided Market, 2022 - 2033, USD Million
FIG 92 South Korea Electric Fireplace Market Market by Distribution Channel, 2022 - 2033, USD Million
FIG 93 South Korea Offline Market, 2022 - 2033, USD Million
FIG 94 South Korea Online Market, 2022 - 2033, USD Million
FIG 95 South Korea Electric Fireplace Market Market by End User, 2022 - 2033, USD Million
FIG 96 South Korea Commercial Market, 2022 - 2033, USD Million
FIG 97 South Korea Residential Market, 2022 - 2033, USD Million
FIG 98 South Korea Electric Fireplace Market Market by Installation Type, 2022 - 2033, USD Million
FIG 99 South Korea Free Standing Market, 2022 - 2033, USD Million
FIG 100 South Korea Insert Market, 2022 - 2033, USD Million
FIG 101 South Korea Wall Mounted Market, 2022 - 2033, USD Million
FIG 102 South Korea Electric Fireplace Market Market by Projection Type, 2022 - 2033, USD Million
FIG 103 South Korea LCD Market, 2022 - 2033, USD Million
FIG 104 South Korea LED Market, 2022 - 2033, USD Million
FIG 105 Singapore Electric Fireplace Market Market, 2022 - 2033, USD Million
FIG 106 Singapore Electric Fireplace Market Market by Application, 2022 - 2033, USD Million
FIG 107 Singapore Indoor Market, 2022 - 2033, USD Million
FIG 108 Singapore Outdoor Market, 2022 - 2033, USD Million
FIG 109 Singapore Electric Fireplace Market Market by Category, 2022 - 2033, USD Million
FIG 110 Singapore One-sided Market, 2022 - 2033, USD Million
FIG 111 Singapore Two-sided Market, 2022 - 2033, USD Million
FIG 112 Singapore Electric Fireplace Market Market by Distribution Channel, 2022 - 2033, USD Million
FIG 113 Singapore Offline Market, 2022 - 2033, USD Million
FIG 114 Singapore Online Market, 2022 - 2033, USD Million
FIG 115 Singapore Electric Fireplace Market Market by End User, 2022 - 2033, USD Million
FIG 116 Singapore Commercial Market, 2022 - 2033, USD Million
FIG 117 Singapore Residential Market, 2022 - 2033, USD Million
FIG 118 Singapore Electric Fireplace Market Market by Installation Type, 2022 - 2033, USD Million
FIG 119 Singapore Free Standing Market, 2022 - 2033, USD Million
FIG 120 Singapore Insert Market, 2022 - 2033, USD Million
FIG 121 Singapore Wall Mounted Market, 2022 - 2033, USD Million
FIG 122 Singapore Electric Fireplace Market Market by Projection Type, 2022 - 2033, USD Million
FIG 123 Singapore LCD Market, 2022 - 2033, USD Million
FIG 124 Singapore LED Market, 2022 - 2033, USD Million
FIG 125 Malaysia Electric Fireplace Market Market, 2022 - 2033, USD Million
FIG 126 Malaysia Electric Fireplace Market Market by Application, 2022 - 2033, USD Million
FIG 127 Malaysia Indoor Market, 2022 - 2033, USD Million
FIG 128 Malaysia Outdoor Market, 2022 - 2033, USD Million
FIG 129 Malaysia Electric Fireplace Market Market by Category, 2022 - 2033, USD Million
FIG 130 Malaysia One-sided Market, 2022 - 2033, USD Million
FIG 131 Malaysia Two-sided Market, 2022 - 2033, USD Million
FIG 132 Malaysia Electric Fireplace Market Market by Distribution Channel, 2022 - 2033, USD Million
FIG 133 Malaysia Offline Market, 2022 - 2033, USD Million
FIG 134 Malaysia Online Market, 2022 - 2033, USD Million
FIG 135 Malaysia Electric Fireplace Market Market by End User, 2022 - 2033, USD Million
FIG 136 Malaysia Commercial Market, 2022 - 2033, USD Million
FIG 137 Malaysia Residential Market, 2022 - 2033, USD Million
FIG 138 Malaysia Electric Fireplace Market Market by Installation Type, 2022 - 2033, USD Million
FIG 139 Malaysia Free Standing Market, 2022 - 2033, USD Million
FIG 140 Malaysia Insert Market, 2022 - 2033, USD Million
FIG 141 Malaysia Wall Mounted Market, 2022 - 2033, USD Million
FIG 142 Malaysia Electric Fireplace Market Market by Projection Type, 2022 - 2033, USD Million
FIG 143 Malaysia LCD Market, 2022 - 2033, USD Million
FIG 144 Malaysia LED Market, 2022 - 2033, USD Million
FIG 145 Rest of Asia Pacific Electric Fireplace Market Market, 2022 - 2033, USD Million
FIG 146 Rest of Asia Pacific Electric Fireplace Market Market by Application, 2022 - 2033, USD Million
FIG 147 Rest of Asia Pacific Indoor Market, 2022 - 2033, USD Million
FIG 148 Rest of Asia Pacific Outdoor Market, 2022 - 2033, USD Million
FIG 149 Rest of Asia Pacific Electric Fireplace Market Market by Category, 2022 - 2033, USD Million
FIG 150 Rest of Asia Pacific One-sided Market, 2022 - 2033, USD Million
FIG 151 Rest of Asia Pacific Two-sided Market, 2022 - 2033, USD Million
FIG 152 Rest of Asia Pacific Electric Fireplace Market Market by Distribution Channel, 2022 - 2033, USD Million
FIG 153 Rest of Asia Pacific Offline Market, 2022 - 2033, USD Million
FIG 154 Rest of Asia Pacific Online Market, 2022 - 2033, USD Million
FIG 155 Rest of Asia Pacific Electric Fireplace Market Market by End User, 2022 - 2033, USD Million
FIG 156 Rest of Asia Pacific Commercial Market, 2022 - 2033, USD Million
FIG 157 Rest of Asia Pacific Residential Market, 2022 - 2033, USD Million
FIG 158 Rest of Asia Pacific Electric Fireplace Market Market by Installation Type, 2022 - 2033, USD Million
FIG 159 Rest of Asia Pacific Free Standing Market, 2022 - 2033, USD Million
FIG 160 Rest of Asia Pacific Insert Market, 2022 - 2033, USD Million
FIG 161 Rest of Asia Pacific Wall Mounted Market, 2022 - 2033, USD Million
FIG 162 Rest of Asia Pacific Electric Fireplace Market Market by Projection Type, 2022 - 2033, USD Million
FIG 163 Rest of Asia Pacific LCD Market, 2022 - 2033, USD Million
FIG 164 Rest of Asia Pacific LED Market, 2022 - 2033, USD Million