“Global Work Order Management Systems Market to reach a market value of USD 1.35 Billion by 2032 growing at a CAGR of 8%”
The Global Work Order Management Systems Market size is expected to reach $1.35 billion by 2032, rising at a market growth of 8.0% CAGR during the forecast period.
Large enterprises represent a mature and highly strategic segment of the market. These organizations often operate complex and asset-intensive operations across multiple sites and geographies, requiring robust, scalable, and fully integrated WOMS solutions. Large enterprises prioritize advanced functionalities such as enterprise-wide workflow automation, compliance management, and integration with other enterprise systems including ERP, supply chain management, and asset management platforms.


The growing emphasis on predictive maintenance is significantly boosting the adoption of Work Order Management Systems. Modern industries are moving beyond reactive maintenance approaches and are increasingly relying on predictive analytics to forecast potential equipment failures before they occur. Work order systems integrated with IoT and AI enable real-time monitoring and scheduling of maintenance tasks, ensuring optimal performance of machinery.
Additionally, Businesses across the globe are actively seeking technologies that enhance workforce productivity and collaboration—leading to greater demand for Work Order Management Systems. These systems allow teams to assign, manage, and track tasks digitally, ensuring that employees receive clear and timely instructions. Mobile access and user-friendly interfaces enable field workers and technicians to respond swiftly, upload real-time updates, and close tasks efficiently. In conclusion, these systems are key to improving efficiency and communication.
However, one of the most significant restraints hampering the growth of the market is the high upfront cost associated with system implementation. Many organizations, particularly small and medium-sized enterprises (SMEs), find the cost of purchasing licenses, investing in necessary IT infrastructure, and employing skilled personnel to configure the system prohibitively expensive. In conclusion, these financial and integration-related barriers significantly slow down adoption rates and hinder market penetration across cost-sensitive sectors.
")
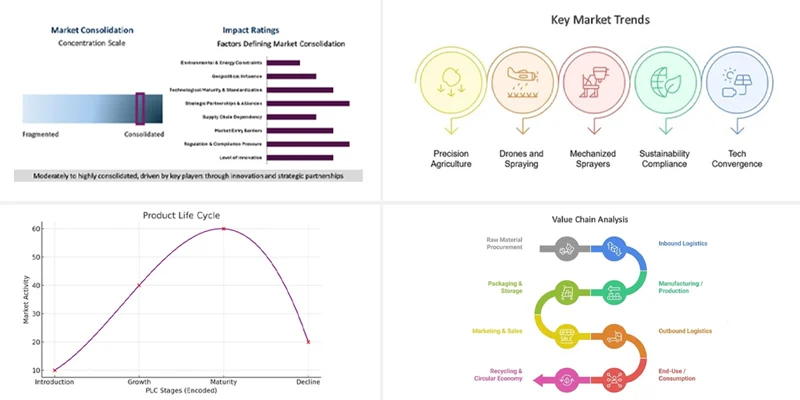
This value chain analysis outlines the comprehensive journey of a product from concept to customer support. It begins with Research & Development (R&D), which drives innovation and new product ideas. Software Development and Customization follows, ensuring tailored solutions for specific needs. Manufacturing and Packaging prepare the product, particularly for on-premise deployment. Distribution and Sales take the product to market, while Installation and Integration ensure it is properly implemented. Post-deployment, Training and Support empower users, and Operations and Maintenance uphold performance. Analytics and Optimization guide improvements, with Customer Feedback and Continuous Improvement feeding insights back into R&D, completing the innovation loop.

The leading players in the market are competing with diverse innovative offerings to remain competitive in the market. The above illustration shows the percentage of revenue shared by some of the leading companies in the market. The leading players of the market are adopting various strategies in order to cater demand coming from the different industries. The key developmental strategies in the market are Acquisitions, and Partnerships & Collaborations.
Based on Organization Size, the market is segmented into Large Enterprise, and Small & Medium Enterprise (SME). The small & medium enterprise (SME) segment garnered 42% revenue share in the market in 2024. Small and medium-sized enterprises are increasingly recognizing the benefits of adopting digital tools to automate and manage their maintenance and service operations efficiently. Cost-effective and user-friendly solutions, particularly those offered via cloud deployment, are enabling SMEs to improve task tracking, resource allocation, and service delivery without requiring extensive IT infrastructure.
Based on Component, the market is segmented into Solution, and Services. The services segment procured 28% revenue share in the market in 2024. The rise in demand for implementation, integration, consulting, and support services has contributed significantly to this segment’s expansion. Organizations adopting work order management systems often seek expert guidance to ensure smooth deployment, proper customization, and system optimization.
Based on Deployment Mode, the market is segmented into Cloud, and On-premises. The on-premise segment recorded 33% revenue share in the market in 2024. This deployment mode remains preferred by organizations that prioritize data security, regulatory compliance, and complete control over system customization. Sectors with stringent security requirements, such as manufacturing, government, and defense, continue to rely on on-premise solutions to manage work orders within their own IT environments.

Based on End Use, the market is segmented into Manufacturing, Transportation & Logistics, Energy & Utilities, Construction & Real Estate, Consumer Goods & Retail, Telecom and IT, Healthcare & Life Sciences, BFSI, and Other End Use. The transportation & logistics segment procured 15% revenue share in the market in 2024. This is supported by the growing emphasis on efficient fleet management and timely maintenance of transport assets. Work order management systems help logistics providers monitor vehicle conditions, plan maintenance schedules, and coordinate repair tasks to reduce downtime.
Free Valuable Insights: Global Work Order Management Systems Market size to reach USD 1.35 Billion Billion by 2032
Region-wise, the market is segmented into North America, Europe, Asia-Pacific, and LAMEA. The North America segment recorded 35% revenue share in the market in 2024. This dominance is driven by the region’s advanced IT infrastructure, high adoption of digital solutions, and strong presence of key market players. Industries across the U.S. and Canada—particularly manufacturing, utilities, and healthcare—are leveraging work order management systems to automate maintenance tasks, reduce downtime, and enhance operational efficiency.
| Report Attribute | Details |
|---|---|
| Market size value in 2024 | USD 745.17 Million |
| Market size forecast in 2032 | USD 1.35 Billion |
| Base Year | 2024 |
| Historical Period | 2021 to 2023 |
| Forecast Period | 2025 to 2032 |
| Revenue Growth Rate | CAGR of 8.0% from 2025 to 2032 |
| Number of Pages | 353 |
| Number of Tables | 474 |
| Report coverage | Market Trends, Revenue Estimation and Forecast, Segmentation Analysis, Regional and Country Breakdown, Market Share Analysis, Porter’s 5 Forces Analysis, Company Profiling, Companies Strategic Developments, SWOT Analysis, Winning Imperatives |
| Segments covered | Organization Size, Component, Deployment Mode, End Use, Region |
| Country scope |
|
| Companies Included | Salesforce, Inc., IBM Corporation, Microsoft Corporation, Oracle Corporation, SAP SE, Infor, Inc. (Koch Industries), ServiceNow, Inc., UpKeep Technologies, Inc., Lula Smarter Property Maintenance, Inc., and PTC, Inc. |
By Organization Size
By Component
By Deployment Mode
By End Use
By Geography
This Market size is expected to reach $1.35 billion by 2032.
Rising Demand for Predictive Maintenance and Asset Optimization are driving the Market in coming years, however, Data Security and Privacy Concerns restraints the growth of the Market.
Salesforce, Inc., IBM Corporation, Microsoft Corporation, Oracle Corporation, SAP SE, Infor, Inc. (Koch Industries), ServiceNow, Inc., UpKeep Technologies, Inc., Lula Smarter Property Maintenance, Inc., and PTC, Inc.
The expected CAGR of this Market is 8.0% from 2023 to 2032.
The Cloud segment led the maximum revenue in the Market by Deployment Mode in 2024, thereby, achieving a market value of $917.2 million by 2032.
The North America region dominated the Market by Region in 2024, thereby, achieving a market value of $453.7 million by 2032.
Our team of dedicated experts can provide you with attractive expansion opportunities for your business.


