North America Underground Cables Market Size, Share & Industry Analysis Report By Type (Low Voltage Cables, High Voltage Cables, and Medium Voltage Cables), By Installation (Direct Buried, Submarine, and Duct), By End Use (Utilities, Industrial, Commercial, and Residential), By Country Outlook and Forecast, 2026 - 2033
Published Date : 02-Sep-2026 |
Pages: 193 |
Report Format: PDF + Excel |
COVID-19 Impact on the North America Underground Cables Market
The North America Underground Cables Market is expected to reach USD 28.8 billion by 2032, growing at a CAGR of 3.3% during (2026 – 2033).
The North America Underground Cables Market developed with the expansion of urban electrification, power distribution networks, and the need for safer infrastructure beneath city streets. Early underground cables were mainly basic insulated copper conductors used for low and moderate voltage applications, but improvements in insulation, sheathing, and armoring gradually increased their reliability. The shift from paper-insulated and lead-sheathed cables to polymer-based insulation, especially XLPE, marked a major advancement in durability and operating life. Over time, underground cabling became more important for dense cities, industrial zones, telecom networks, and utility modernization.
The North America Underground Cables Market is being shaped by grid modernization, storm-resilience planning, fiber optic expansion, renewable energy interconnection, and smart cable monitoring. Utilities are investing in underground systems to reduce outage risks, improve public safety, and support reliable power delivery in urban and suburban areas. Cable manufacturers are focusing on high-voltage XLPE cables, advanced insulation, recyclable materials, predictive diagnostics, and IoT-enabled monitoring to improve asset performance. Demand is also rising from 5G backhaul, data centers, EV charging, offshore wind, smart cities, and urban electrification projects.
Type Outlook
Based on Type, the market is segmented into Low Voltage Cables, Medium Voltage Cables, and High Voltage Cables. The Low Voltage Cables market dominated the North America Underground Cables Market by Type in 2025, and would continue to be a dominant market till 2033; thereby, achieving a market value of USD 13.0 billion by 2032, growing at a CAGR of 2.7 % during the forecast period. The Medium Voltage Cables market is expected to witness a CAGR of 3.6% during (2026 - 2033). Additionally, The High Voltage Cables market is expected to witness highest CAGR of 3.9% during (2026 - 2033).
Low Voltage Cables lead due to broad deployment across residential buildings, commercial spaces, smart neighborhoods, urban distribution networks, and local power connections. These cables support reliable end-user electricity supply while improving safety, aesthetics, and resilience compared to exposed overhead systems. Medium Voltage Cables remain important for distribution feeders, industrial parks, commercial complexes, renewable energy projects, and localized grid modernization. High Voltage Cables serve a smaller but strategic role in long-distance transmission, interconnection upgrades, urban grid reinforcement, and renewable power transfer where high-capacity underground routes are required.
Installation Outlook
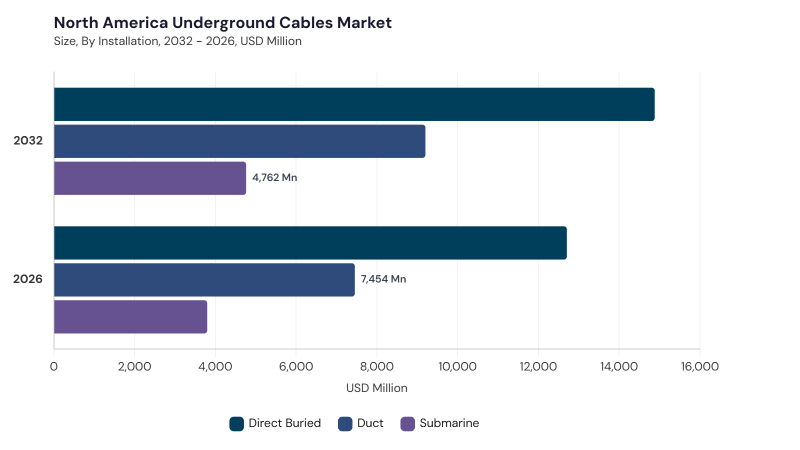
Based on Installation, the market is segmented into Direct Buried, Duct, and Submarine. The Direct Buried market dominated the North America Underground Cables Market by Installation in 2025, and would continue to be a dominant market till 2033; thereby, achieving a market value of USD 14.9 billion by 2032, growing at a CAGR of 2.8 % during the forecast period. The Duct market is expected to witness a CAGR of 3.7% during (2026 - 2033). Additionally, The Submarine market is expected to witness highest CAGR of 3.9% during (2026 - 2033).
Direct Buried installation leads due to its cost efficiency, faster deployment, and suitability for utility distribution, residential expansion, suburban networks, and many urban infrastructure projects. This method reduces above-ground exposure and supports underground electrification where straightforward trench-based installation is feasible. Duct installation remains significant in dense cities, telecom corridors, smart grid projects, and areas requiring cable protection, easier maintenance, and future network expansion. Submarine installation holds a smaller but specialized position, supported by offshore wind links, island interconnections, underwater power transmission, and high-capacity fiber optic communication routes.
End Use Outlook
Based on End Use, the market is segmented into Utilities, Residential, Industrial, and Commercial. Utilities lead due to investments in transmission and distribution upgrades, grid hardening, renewable energy integration, smart grid deployment, and replacement of aging overhead infrastructure. Utility operators require underground cables that deliver high reliability, strong insulation performance, fault tolerance, and long service life across varied soil and climate conditions.
Residential demand is supported by new housing, underground service connections, EV charging, rooftop solar integration, and storm-resilient neighborhood wiring. Industrial and Commercial applications add demand through manufacturing plants, data centers, healthcare facilities, educational campuses, office complexes, malls, and mixed-use developments requiring safe and scalable power networks.
Free Valuable Insights: The Global Underground Cables Market will hit USD 113.4 Billion billion by 2033, at a CAGR of 4.0%
Country Outlook
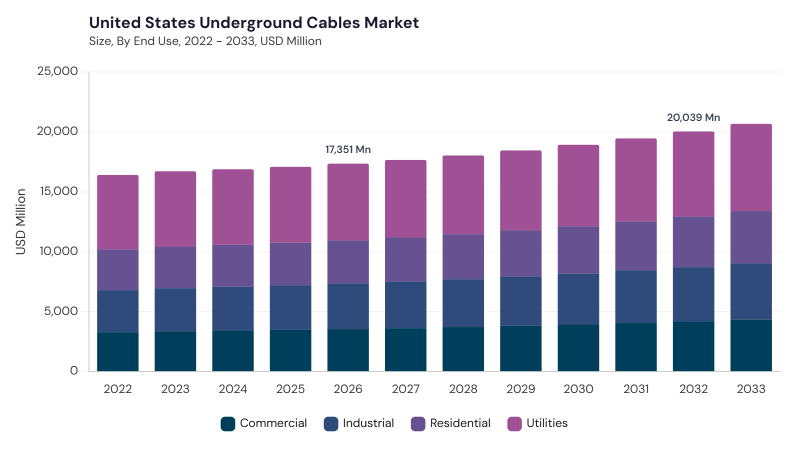
Based on Country, the market is segmented into US, Canada, Mexico, and Rest of North America. The US market dominated the North America Underground Cables Market by Country in 2025, and would continue to be a dominant market till 2033; thereby, achieving a market value of USD 20.0 billion by 2032, growing at a CAGR of 2.5 % during the forecast period. The Canada market is expected to witness a CAGR of 5.1% during (2026 - 2033). Additionally, The Mexico market is expected to witness a CAGR of 4.3% during (2026 - 2033).
The US leads due to mature utility infrastructure, large-scale grid modernization, storm resilience initiatives, data center growth, renewable energy projects, and undergrounding programs in urban and suburban networks. Canada supports market growth through renewable energy integration, smart grid technologies, urban safety priorities, EMF-related planning considerations, and cables designed for diverse climatic conditions. Mexico is advancing through urban infrastructure development, telecom fiber deployment, smart monitoring, transit electrification, and growing demand for reliable power and data networks. Rest of North America benefits from infrastructure resilience, digital connectivity needs, renewable integration, and underground power distribution upgrades.
List of Key Companies Profiled
- Prysmian Group
- Nexans S.A.
- NKT A/S
- Sumitomo Electric Industries, Ltd.
- LS Cable & System Ltd.
- Southwire Company, LLC
- Furukawa Electric Co., Ltd.
- Riyadh Cables Group Company
- Taihan Cable & Solution Co., Ltd.
- Hellenic Cables S.A.
North America Underground Cables Market Report Segmentation
By Type
- Low Voltage Cables
- Medium Voltage Cables
- High Voltage Cables
By Installation
- Direct Buried
- Duct
- Submarine
By End Use
- Utilities
- Residential
- Industrial
- Commercial
By Country
- US
- Canada
- Mexico
- Rest of North America
1.1 Market Overview
1.2 Key Factors Impacting Market
1.2.1 Market Drivers
1.2.2 Market Restraints
1.2.3 Market Opportunities
1.2.4 Market Challenges
1.2.5 Market Trends
1.2.6 State of Competition
1.2.7 Market Consolidation
1.2.8 Key Customer Criteria
1.3 Product Life Cycle
1.4 Segmentation By Application
1.4.1 B2B
1.4.2 B2C
1.5 Segmentation By Source
1.5.1 Cashew
1.5.2 Soy
1.5.3 Coconut
1.5.4 Almond
1.5.5 Other Source
1.6 Segmentation By Product
1.6.1 Mozzarella
1.6.2 Cheddar
1.6.3 Cream Cheese
1.6.4 Parmesan
1.6.5 Ricotta
1.6.6 Other Product
1.7 Segmentation By Country
1.7.1 US
1.7.1.1 Segmentation By Application
1.7.1.1.1 B2B
1.7.1.1.2 B2C
1.7.1.2 Segmentation By Source
1.7.1.2.1 Cashew
1.7.1.2.2 Soy
1.7.1.2.3 Coconut
1.7.1.2.4 Almond
1.7.1.2.5 Other Source
1.7.1.3 Segmentation By Product
1.7.1.3.1 Mozzarella
1.7.1.3.2 Cheddar
1.7.1.3.3 Cream Cheese
1.7.1.3.4 Parmesan
1.7.1.3.5 Ricotta
1.7.1.3.6 Other Product
1.7.2 Canada
1.7.2.1 Segmentation By Application
1.7.2.1.1 B2B
1.7.2.1.2 B2C
1.7.2.2 Segmentation By Source
1.7.2.2.1 Cashew
1.7.2.2.2 Soy
1.7.2.2.3 Coconut
1.7.2.2.4 Almond
1.7.2.2.5 Other Source
1.7.2.3 Segmentation By Product
1.7.2.3.1 Mozzarella
1.7.2.3.2 Cheddar
1.7.2.3.3 Cream Cheese
1.7.2.3.4 Parmesan
1.7.2.3.5 Ricotta
1.7.2.3.6 Other Product
1.7.3 Mexico
1.7.3.1 Segmentation By Application
1.7.3.1.1 B2B
1.7.3.1.2 B2C
1.7.3.2 Segmentation By Source
1.7.3.2.1 Cashew
1.7.3.2.2 Soy
1.7.3.2.3 Coconut
1.7.3.2.4 Almond
1.7.3.2.5 Other Source
1.7.3.3 Segmentation By Product
1.7.3.3.1 Mozzarella
1.7.3.3.2 Cheddar
1.7.3.3.3 Cream Cheese
1.7.3.3.4 Parmesan
1.7.3.3.5 Ricotta
1.7.3.3.6 Other Product
1.7.4 Rest of North America
1.7.4.1 Segmentation By Application
1.7.4.1.1 B2B
1.7.4.1.2 B2C
1.7.4.2 Segmentation By Source
1.7.4.2.1 Cashew
1.7.4.2.2 Soy
1.7.4.2.3 Coconut
1.7.4.2.4 Almond
1.7.4.2.5 Other Source
1.7.4.3 Segmentation By Product
1.7.4.3.1 Mozzarella
1.7.4.3.2 Cheddar
1.7.4.3.3 Cream Cheese
1.7.4.3.4 Parmesan
1.7.4.3.5 Ricotta
1.7.4.3.6 Other Product
Chapter 2. Company Snapshots
2.1 Upfield B.V.
2.1.1 Business Overview
2.1.2 Key Information
2.1.3 Company Focus on Vegan Cheese Market
2.1.4 Strategic Insights
2.1.5 Strategy Deployed
2.1.6 Product & Service Portfolio
2.1.7 Capability Overview
2.1.8 Technology & Innovation Focus
2.1.9 SWOT Analysis
2.1.10 Customers / End Users
2.1.11 Competitive Positioning
2.1.12 Key Differentiators
2.1.13 Portfolio Matrix
2.1.14 Analyst View
2.1.15 Future Outlook
2.2 Otsuka Holdings Co., Ltd.
2.2.1 Business Overview
2.2.2 Key Information
2.2.3 Company Focus on Vegan Cheese Market
2.2.4 Strategic Insights
2.2.5 Strategy Deployed
2.2.6 Product & Service Portfolio
2.2.7 Capability Overview
2.2.8 Technology & Innovation Focus
2.2.9 SWOT Analysis
2.2.10 Customers / End Users
2.2.11 Competitive Positioning
2.2.12 Key Differentiators
2.2.13 Portfolio Matrix
2.2.14 Analyst View
2.2.15 Future Outlook
2.3 Danone S.A.
2.3.1 Business Overview
2.3.2 Key Information
2.3.3 Company Focus on Vegan Cheese Market
2.3.4 Strategic Insights
2.3.5 Strategy Deployed
2.3.6 Product & Service Portfolio
2.3.7 Capability Overview
2.3.8 Technology & Innovation Focus
2.3.9 SWOT Analysis
2.3.10 Customers / End Users
2.3.11 Competitive Positioning
2.3.12 Key Differentiators
2.3.13 Portfolio Matrix
2.3.14 Analyst View
2.3.15 Future Outlook
2.4 Bel Group
2.4.1 Business Overview
2.4.2 Key Information
2.4.3 Company Focus on Vegan Cheese Market
2.4.4 Strategic Insights
2.4.5 Strategy Deployed
2.4.6 Product & Service Portfolio
2.4.7 Capability Overview
2.4.8 Technology & Innovation Focus
2.4.9 SWOT Analysis
2.4.10 Customers / End Users
2.4.11 Competitive Positioning
2.4.12 Key Differentiators
2.4.13 Portfolio Matrix
2.4.14 Analyst View
2.4.15 Future Outlook
2.5 Maple Leaf Foods Inc.
2.5.1 Business Overview
2.5.2 Company Focus on Vegan Cheese Market
2.5.3 Strategic Insights
2.5.4 Strategy Deployed
2.5.5 Product & Service Portfolio
2.5.6 Capability Overview
2.5.7 Technology & Innovation Focus
2.5.8 SWOT Analysis
2.5.9 Customers / End Users
2.5.10 Competitive Positioning
2.5.11 Key Differentiators
2.5.12 Portfolio Matrix
2.5.13 Analyst View
2.5.14 Future Outlook
2.6 Hochland SE
2.6.1 Business Overview
2.6.2 Key Information
2.6.3 Company Focus on Vegan Cheese Market
2.6.4 Strategic Insights
2.6.5 Strategy Deployed
2.6.6 Product & Service Portfolio
2.6.7 Capability Overview
2.6.8 Technology & Innovation Focus
2.6.9 SWOT Analysis
2.6.10 Customers / End Users
2.6.11 Competitive Positioning
2.6.12 Key Differentiators
2.6.13 Portfolio Matrix
2.6.14 Analyst View
2.6.15 Future Outlook
2.7 Saputo Inc.
2.7.1 Business Overview
2.7.2 Key Information
2.7.3 Company Focus on Vegan Cheese Market
2.7.4 Strategic Insights
2.7.5 Strategy Deployed
2.7.6 Product & Service Portfolio
2.7.7 Capability Overview
2.7.8 Technology & Innovation Focus
2.7.9 SWOT Analysis
2.7.10 Customers / End Users
2.7.11 Competitive Positioning
2.7.12 Key Differentiators
2.7.13 Portfolio Matrix
2.7.14 Analyst View
2.7.15 Future Outlook
2.8 Miyoko's Creamery
2.8.1 Business Overview
2.8.2 Key Information
2.8.3 Company Focus on Vegan Cheese Market
2.8.4 Strategic Insights
2.8.5 Strategy Deployed
2.8.6 Product & Service Portfolio
2.8.7 Capability Overview
2.8.8 Technology & Innovation Focus
2.8.9 SWOT Analysis
2.8.10 Customers / End Users
2.8.11 Competitive Positioning
2.8.12 Key Differentiators
2.8.13 Portfolio Matrix
2.8.14 Analyst View
2.8.15 Future Outlook
2.9 Kite Hill
2.9.1 Business Overview
2.9.2 Key Information
2.9.3 Company Focus on Vegan Cheese Market
2.9.4 Strategic Insights
2.9.5 Strategy Deployed
2.9.6 Product & Service Portfolio
2.9.7 Capability Overview
2.9.8 Technology & Innovation Focus
2.9.9 SWOT Analysis
2.9.10 Customers / End Users
2.9.11 Competitive Positioning
2.9.12 Key Differentiators
2.9.13 Portfolio Matrix
2.9.14 Analyst View
2.9.15 Future Outlook
2.10 Tofutti Brands Inc.
2.10.1 Business Overview
2.10.2 Key Information 2.10.3 Company Focus on Vegan Cheese Market
2.10.4 Strategic Insights
2.10.5 Strategy Deployed
2.10.6 Product & Service Portfolio
2.10.7 Capability Overview
2.10.8 Technology & Innovation Focus
2.10.9 SWOT Analysis
2.10.10 Customers / End Users
2.10.11 Competitive Positioning
2.10.12 Key Differentiators
2.10.13 Portfolio Matrix
2.10.14 Analyst View
2.10.15 Future Outlook
Table 1 North America Vegan Cheese Market Market, 2022 - 2033, USD Million
Table 2 North America Vegan Cheese Market Market by Application, 2022 - 2033, USD Million
Table 3 North America B2B Market, 2022 - 2033, USD Million
Table 4 North America B2C Market, 2022 - 2033, USD Million
Table 5 North America Vegan Cheese Market Market by Product, 2022 - 2033, USD Million
Table 6 North America Cheddar Market, 2022 - 2033, USD Million
Table 7 North America Cream Cheese Market, 2022 - 2033, USD Million
Table 8 North America Mozzarella Market, 2022 - 2033, USD Million
Table 9 North America Other Product Market, 2022 - 2033, USD Million
Table 10 North America Parmesan Market, 2022 - 2033, USD Million
Table 11 North America Ricotta Market, 2022 - 2033, USD Million
Table 12 North America Vegan Cheese Market Market by Source, 2022 - 2033, USD Million
Table 13 North America Almond Market, 2022 - 2033, USD Million
Table 14 North America Cashew Market, 2022 - 2033, USD Million
Table 15 North America Coconut Market, 2022 - 2033, USD Million
Table 16 North America Other Source Market, 2022 - 2033, USD Million
Table 17 North America Soy Market, 2022 - 2033, USD Million
Table 18 United States Vegan Cheese Market Market, 2022 - 2033, USD Million
Table 19 United States Vegan Cheese Market Market by Application, 2022 - 2033, USD Million
Table 20 United States B2B Market, 2022 - 2033, USD Million
Table 21 United States B2C Market, 2022 - 2033, USD Million
Table 22 United States Vegan Cheese Market Market by Product, 2022 - 2033, USD Million
Table 23 United States Cheddar Market, 2022 - 2033, USD Million
Table 24 United States Cream Cheese Market, 2022 - 2033, USD Million
Table 25 United States Mozzarella Market, 2022 - 2033, USD Million
Table 26 United States Other Product Market, 2022 - 2033, USD Million
Table 27 United States Parmesan Market, 2022 - 2033, USD Million
Table 28 United States Ricotta Market, 2022 - 2033, USD Million
Table 29 United States Vegan Cheese Market Market by Source, 2022 - 2033, USD Million
Table 30 United States Almond Market, 2022 - 2033, USD Million
Table 31 United States Cashew Market, 2022 - 2033, USD Million
Table 32 United States Coconut Market, 2022 - 2033, USD Million
Table 33 United States Other Source Market, 2022 - 2033, USD Million
Table 34 United States Soy Market, 2022 - 2033, USD Million
Table 35 Canada Vegan Cheese Market Market, 2022 - 2033, USD Million
Table 36 Canada Vegan Cheese Market Market by Application, 2022 - 2033, USD Million
Table 37 Canada B2B Market, 2022 - 2033, USD Million
Table 38 Canada B2C Market, 2022 - 2033, USD Million
Table 39 Canada Vegan Cheese Market Market by Product, 2022 - 2033, USD Million
Table 40 Canada Cheddar Market, 2022 - 2033, USD Million
Table 41 Canada Cream Cheese Market, 2022 - 2033, USD Million
Table 42 Canada Mozzarella Market, 2022 - 2033, USD Million
Table 43 Canada Other Product Market, 2022 - 2033, USD Million
Table 44 Canada Parmesan Market, 2022 - 2033, USD Million
Table 45 Canada Ricotta Market, 2022 - 2033, USD Million
Table 46 Canada Vegan Cheese Market Market by Source, 2022 - 2033, USD Million
Table 47 Canada Almond Market, 2022 - 2033, USD Million
Table 48 Canada Cashew Market, 2022 - 2033, USD Million
Table 49 Canada Coconut Market, 2022 - 2033, USD Million
Table 50 Canada Other Source Market, 2022 - 2033, USD Million
Table 51 Canada Soy Market, 2022 - 2033, USD Million
Table 52 Mexico Vegan Cheese Market Market, 2022 - 2033, USD Million
Table 53 Mexico Vegan Cheese Market Market by Application, 2022 - 2033, USD Million
Table 54 Mexico B2B Market, 2022 - 2033, USD Million
Table 55 Mexico B2C Market, 2022 - 2033, USD Million
Table 56 Mexico Vegan Cheese Market Market by Product, 2022 - 2033, USD Million
Table 57 Mexico Cheddar Market, 2022 - 2033, USD Million
Table 58 Mexico Cream Cheese Market, 2022 - 2033, USD Million
Table 59 Mexico Mozzarella Market, 2022 - 2033, USD Million
Table 60 Mexico Other Product Market, 2022 - 2033, USD Million
Table 61 Mexico Parmesan Market, 2022 - 2033, USD Million
Table 62 Mexico Ricotta Market, 2022 - 2033, USD Million
Table 63 Mexico Vegan Cheese Market Market by Source, 2022 - 2033, USD Million
Table 64 Mexico Almond Market, 2022 - 2033, USD Million
Table 65 Mexico Cashew Market, 2022 - 2033, USD Million
Table 66 Mexico Coconut Market, 2022 - 2033, USD Million
Table 67 Mexico Other Source Market, 2022 - 2033, USD Million
Table 68 Mexico Soy Market, 2022 - 2033, USD Million
Table 69 Rest of North America Vegan Cheese Market Market, 2022 - 2033, USD Million
Table 70 Rest of North America Vegan Cheese Market Market by Application, 2022 - 2033, USD Million
Table 71 Rest of North America B2B Market, 2022 - 2033, USD Million
Table 72 Rest of North America B2C Market, 2022 - 2033, USD Million
Table 73 Rest of North America Vegan Cheese Market Market by Product, 2022 - 2033, USD Million
Table 74 Rest of North America Cheddar Market, 2022 - 2033, USD Million
Table 75 Rest of North America Cream Cheese Market, 2022 - 2033, USD Million
Table 76 Rest of North America Mozzarella Market, 2022 - 2033, USD Million
Table 77 Rest of North America Other Product Market, 2022 - 2033, USD Million
Table 78 Rest of North America Parmesan Market, 2022 - 2033, USD Million
Table 79 Rest of North America Ricotta Market, 2022 - 2033, USD Million
Table 80 Rest of North America Vegan Cheese Market Market by Source, 2022 - 2033, USD Million
Table 81 Rest of North America Almond Market, 2022 - 2033, USD Million
Table 82 Rest of North America Cashew Market, 2022 - 2033, USD Million
Table 83 Rest of North America Coconut Market, 2022 - 2033, USD Million
Table 84 Rest of North America Other Source Market, 2022 - 2033, USD Million
Table 85 Rest of North America Soy Market, 2022 - 2033, USD Million
List of Figures
FIG 1 Key Factors Impacting Market
FIG 2 Market Consolidation
FIG 3 Key Customer Criteria
FIG 4 Product Life Cycle
FIG 5 North America Vegan Cheese Market Market, 2022 - 2033, USD Million
FIG 6 North America Vegan Cheese Market Market by Application, 2022 - 2033, USD Million
FIG 7 North America B2B Market, 2022 - 2033, USD Million
FIG 8 North America B2C Market, 2022 - 2033, USD Million
FIG 9 North America Vegan Cheese Market Market by Product, 2022 - 2033, USD Million
FIG 10 North America Cheddar Market, 2022 - 2033, USD Million
FIG 11 North America Cream Cheese Market, 2022 - 2033, USD Million
FIG 12 North America Mozzarella Market, 2022 - 2033, USD Million
FIG 13 North America Other Product Market, 2022 - 2033, USD Million
FIG 14 North America Parmesan Market, 2022 - 2033, USD Million
FIG 15 North America Ricotta Market, 2022 - 2033, USD Million
FIG 16 North America Vegan Cheese Market Market by Source, 2022 - 2033, USD Million
FIG 17 North America Almond Market, 2022 - 2033, USD Million
FIG 18 North America Cashew Market, 2022 - 2033, USD Million
FIG 19 North America Coconut Market, 2022 - 2033, USD Million
FIG 20 North America Other Source Market, 2022 - 2033, USD Million
FIG 21 North America Soy Market, 2022 - 2033, USD Million
FIG 22 United States Vegan Cheese Market Market, 2022 - 2033, USD Million
FIG 23 United States Vegan Cheese Market Market by Application, 2022 - 2033, USD Million
FIG 24 United States B2B Market, 2022 - 2033, USD Million
FIG 25 United States B2C Market, 2022 - 2033, USD Million
FIG 26 United States Vegan Cheese Market Market by Product, 2022 - 2033, USD Million
FIG 27 United States Cheddar Market, 2022 - 2033, USD Million
FIG 28 United States Cream Cheese Market, 2022 - 2033, USD Million
FIG 29 United States Mozzarella Market, 2022 - 2033, USD Million
FIG 30 United States Other Product Market, 2022 - 2033, USD Million
FIG 31 United States Parmesan Market, 2022 - 2033, USD Million
FIG 32 United States Ricotta Market, 2022 - 2033, USD Million
FIG 33 United States Vegan Cheese Market Market by Source, 2022 - 2033, USD Million
FIG 34 United States Almond Market, 2022 - 2033, USD Million
FIG 35 United States Cashew Market, 2022 - 2033, USD Million
FIG 36 United States Coconut Market, 2022 - 2033, USD Million
FIG 37 United States Other Source Market, 2022 - 2033, USD Million
FIG 38 United States Soy Market, 2022 - 2033, USD Million
FIG 39 Canada Vegan Cheese Market Market, 2022 - 2033, USD Million
FIG 40 Canada Vegan Cheese Market Market by Application, 2022 - 2033, USD Million
FIG 41 Canada B2B Market, 2022 - 2033, USD Million
FIG 42 Canada B2C Market, 2022 - 2033, USD Million
FIG 43 Canada Vegan Cheese Market Market by Product, 2022 - 2033, USD Million
FIG 44 Canada Cheddar Market, 2022 - 2033, USD Million
FIG 45 Canada Cream Cheese Market, 2022 - 2033, USD Million
FIG 46 Canada Mozzarella Market, 2022 - 2033, USD Million
FIG 47 Canada Other Product Market, 2022 - 2033, USD Million
FIG 48 Canada Parmesan Market, 2022 - 2033, USD Million
FIG 49 Canada Ricotta Market, 2022 - 2033, USD Million
FIG 50 Canada Vegan Cheese Market Market by Source, 2022 - 2033, USD Million
FIG 51 Canada Almond Market, 2022 - 2033, USD Million
FIG 52 Canada Cashew Market, 2022 - 2033, USD Million
FIG 53 Canada Coconut Market, 2022 - 2033, USD Million
FIG 54 Canada Other Source Market, 2022 - 2033, USD Million
FIG 55 Canada Soy Market, 2022 - 2033, USD Million
FIG 56 Mexico Vegan Cheese Market Market, 2022 - 2033, USD Million
FIG 57 Mexico Vegan Cheese Market Market by Application, 2022 - 2033, USD Million
FIG 58 Mexico B2B Market, 2022 - 2033, USD Million
FIG 59 Mexico B2C Market, 2022 - 2033, USD Million
FIG 60 Mexico Vegan Cheese Market Market by Product, 2022 - 2033, USD Million
FIG 61 Mexico Cheddar Market, 2022 - 2033, USD Million
FIG 62 Mexico Cream Cheese Market, 2022 - 2033, USD Million
FIG 63 Mexico Mozzarella Market, 2022 - 2033, USD Million
FIG 64 Mexico Other Product Market, 2022 - 2033, USD Million
FIG 65 Mexico Parmesan Market, 2022 - 2033, USD Million
FIG 66 Mexico Ricotta Market, 2022 - 2033, USD Million
FIG 67 Mexico Vegan Cheese Market Market by Source, 2022 - 2033, USD Million
FIG 68 Mexico Almond Market, 2022 - 2033, USD Million
FIG 69 Mexico Cashew Market, 2022 - 2033, USD Million
FIG 70 Mexico Coconut Market, 2022 - 2033, USD Million
FIG 71 Mexico Other Source Market, 2022 - 2033, USD Million
FIG 72 Mexico Soy Market, 2022 - 2033, USD Million
FIG 73 Rest of North America Vegan Cheese Market Market, 2022 - 2033, USD Million
FIG 74 Rest of North America Vegan Cheese Market Market by Application, 2022 - 2033, USD Million
FIG 75 Rest of North America B2B Market, 2022 - 2033, USD Million
FIG 76 Rest of North America B2C Market, 2022 - 2033, USD Million
FIG 77 Rest of North America Vegan Cheese Market Market by Product, 2022 - 2033, USD Million
FIG 78 Rest of North America Cheddar Market, 2022 - 2033, USD Million
FIG 79 Rest of North America Cream Cheese Market, 2022 - 2033, USD Million
FIG 80 Rest of North America Mozzarella Market, 2022 - 2033, USD Million
FIG 81 Rest of North America Other Product Market, 2022 - 2033, USD Million
FIG 82 Rest of North America Parmesan Market, 2022 - 2033, USD Million
FIG 83 Rest of North America Ricotta Market, 2022 - 2033, USD Million
FIG 84 Rest of North America Vegan Cheese Market Market by Source, 2022 - 2033, USD Million
FIG 85 Rest of North America Almond Market, 2022 - 2033, USD Million
FIG 86 Rest of North America Cashew Market, 2022 - 2033, USD Million
FIG 87 Rest of North America Coconut Market, 2022 - 2033, USD Million
FIG 88 Rest of North America Other Source Market, 2022 - 2033, USD Million
FIG 89 Rest of North America Soy Market, 2022 - 2033, USD Million