North America Moringa Ingredients Market Size, Share & Industry Analysis Report By Origin (Conventional and Organic), By Application (Food & Beverages, Cosmetics & Personal Care, Accessories, and Other Application), By Source (Leaves, Seed, Roots, Flowers, and Other Source), By Country and Forecast, 2026 - 2033
Published Date : 22-Sep-2026 |
Pages: 203 |
Report Format: PDF + Excel |
COVID-19 Impact on the North America Moringa Ingredients Market
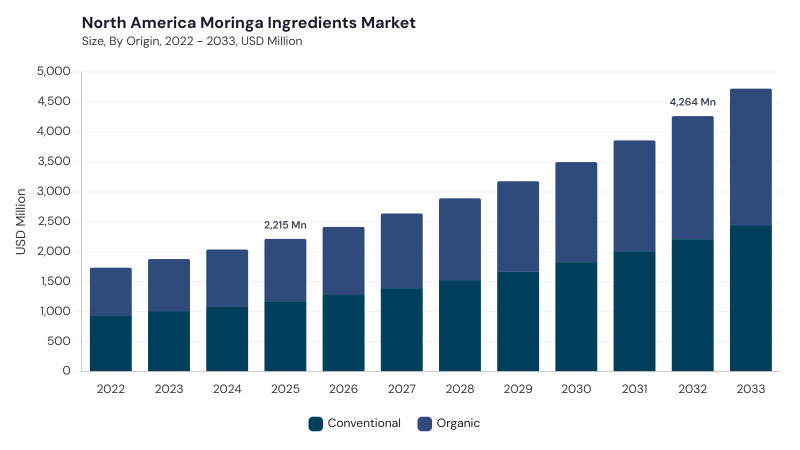
The North America Moringa Ingredients Market is expected to reach USD 4.2 billion by 2032, growing at a CAGR of 10.1% during (2026 – 2033).
Moringa ingredients across North America evolved from niche nutritional and ethnobotanical applications toward a broader commercial ingredient category serving food, beverages, nutraceuticals, cosmetics, and wellness products. Early market development centered on small-scale cultivation and minimally processed moringa leaves and seeds, while improvements in drying, extraction, standardization, and preservation technologies enabled powders, oils, and extracts with greater stability and consistency. Growing awareness of moringa’s nutrient density, antioxidant properties, and plant-based positioning gradually expanded its use in mainstream functional formulations.
Plant-based wellness, clean-label formulation, sustainable sourcing, and improved extraction technologies are increasingly shaping regional market development. Consumers are showing stronger interest in botanical ingredients associated with holistic nutrition, functional foods, natural beauty, and preventive wellness, encouraging manufacturers to incorporate moringa into a wider range of formulations. Organic certification, ethical sourcing, and traceable agricultural practices are gaining importance as buyers seek greater transparency and environmental responsibility.
Origin Outlook
Based on Origin, the market is segmented into Conventional and Organic. The Conventional market dominated the North America Moringa Ingredients Market by Origin in 2025, and would continue to be a dominant market till 2033; thereby, achieving a market value of USD 2.2 billion by 2032, growing at a CAGR of 9.7 % during the forecast period. The Organic market is expected to witness a CAGR of 10.5% during (2026 - 2033).
Conventional moringa ingredients remain important for manufacturers seeking reliable supply, scalable production, and price-efficient formulations across dietary supplements, functional foods, beverages, and other mass-market applications. Established cultivation practices and supply networks support availability of conventional powders, extracts, and oils, while improved processing technologies enhance ingredient stability and functionality. Organic moringa represents a premium segment supported by rising demand for certified, clean-label, chemical-free, and sustainably produced ingredients. Organic cultivation, traceability, fair-trade practices, and environmental positioning strengthen its appeal across premium supplements, natural cosmetics, and specialized wellness products, although certification requirements and higher production costs can limit broader adoption.
Application Outlook
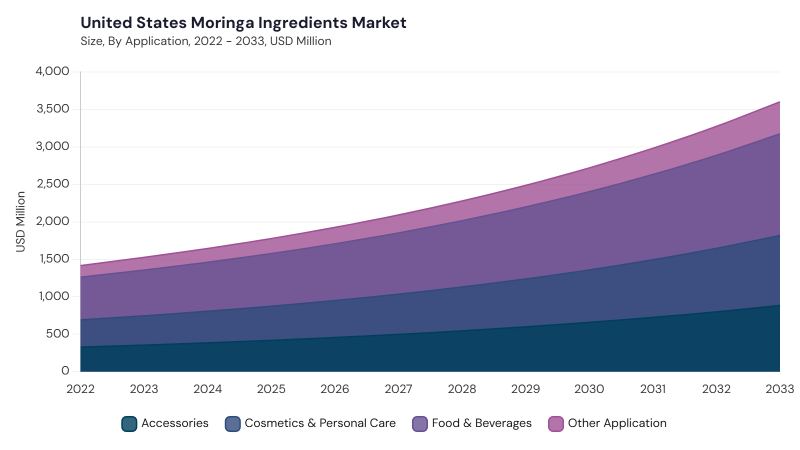
Based on Application, the market is segmented into Food & Beverages, Cosmetics & Personal Care, Accessories, and Other Application. The Food & Beverages market dominated the North America Moringa Ingredients Market by Application in 2025, and would continue to be a dominant market till 2033; thereby, achieving a market value of USD 1.6 billion by 2032, growing at a CAGR of 9.4 % during the forecast period. The Cosmetics & Personal Care market is expected to witness a CAGR of 10.2% during (2026 - 2033). The Other Application market is expected to witness a CAGR of 10.7% during (2026 - 2033).
Food & Beverages utilize moringa powders, extracts, and other ingredient forms in teas, smoothies, fortified snacks, health drinks, supplements, and functional formulations designed around plant-based nutrition and wellness. Cosmetics & Personal Care increasingly uses moringa seed oil and botanical extracts in skincare, facial oils, haircare, anti-aging products, and natural beauty formulations because of their emollient, antioxidant, and nourishing characteristics. Accessories includes moringa-based wellness and lifestyle offerings such as herbal kits, aromatherapy products, botanical-care accessories, infused compresses, and related self-care formats. Other Application encompasses pharmaceutical formulations, animal nutrition, agricultural uses, and specialized functional applications where moringa’s nutritional and bioactive characteristics support product development.
Source Outlook
Based on Source, the market is segmented into Leaves, Seed, Roots, Flowers, and Other Source. Leaves represent the primary source for moringa powders and extracts used in nutraceuticals, functional foods, beverages, and wellness products due to their concentration of vitamins, antioxidants, proteins, and other nutrients. Seed-derived ingredients, particularly moringa oil, are increasingly used in edible applications, cosmetics, skincare, and specialized functional products, while seed derivatives also support water purification and other uses.
Roots remain a more specialized source associated with traditional herbal formulations and selected wellness applications, with adoption influenced by safety and regulatory considerations. Flowers are gaining attention in teas, specialty beverages, natural food products, and premium cosmetic formulations, while Other Source includes bark, pods, husks, and other plant components explored for niche nutritional, agricultural, industrial, and sustainability-oriented applications.
Free Valuable Insights: The Global Moringa Ingredients Market will hit USD 19.3 Billion billion by 2033, at a CAGR of 10.9%
Country Outlook
Based on Country, the market is segmented into US, Canada, Mexico, and Rest of North America. The US market dominated the North America Moringa Ingredients Market by Country in 2025, and would continue to be a dominant market till 2033; thereby, achieving a market value of USD 3.2 billion by 2032, growing at a CAGR of 9.4 % during the forecast period. The Canada market is expected to witness a CAGR of 12.8% during (2026 - 2033). Additionally, The Mexico market is expected to witness a CAGR of 11.6% during (2026 - 2033).
Across North America, moringa ingredient adoption is increasingly influenced by plant-based nutrition, clean-label preferences, sustainable sourcing, ingredient traceability, and improved processing capabilities. The US is advancing moringa adoption through functional foods, supplements, natural wellness products, cold-press extraction, microencapsulation, and stronger certification practices, while Canada is emphasizing plant-based formulations, nutrient preservation, ethical sourcing, regulatory compliance, and diversified ingredient formats. Mexico combines traditional familiarity with moringa and modern agribusiness through organic cultivation, advanced extraction, value-added formulations, traceable supply chains, and export-oriented processing, whereas Rest of North America is strengthening standardized production, sustainable agriculture, high-purity extracts, and broader use across food, beverages, supplements, and wellness products.
List of Key Companies Profiled
- Grenera Nutrients Pvt. Ltd.
- Tata Consumer Products Ltd.
- Kuli Kuli Foods Inc.
- Ancient Greenfields Pvt. Ltd.
- Earth Expo Company
- Herbs & Crops Overseas
- Himalaya Global Holdings Ltd.
- Saipro Biotech Pvt. Ltd.
- Santan International
- Green Era Foods & Nutraceutics
North America Moringa Ingredients Market Report Segmentation
By Origin
- Conventional
- Organic
By Application
- Food & Beverages
- Cosmetics & Personal Care
- Accessories
- Other Application
By Source
- Leaves
- Seed
- Roots
- Flowers
- Other Source
By Country
- US
- Canada
- Mexico
- Rest of North America
1.1 Market Overview
1.2 Key Factors Impacting Market
1.2.1 Market Drivers
1.2.2 Market Restraints
1.2.3 Market Opportunities
1.2.4 Market Challenges
1.2.5 Market Trends
1.2.6 State of Competition
1.2.7 Market Consolidation
1.2.8 Key Customer Criteria
1.3 Product Life Cycle
1.4 Segmentation By Origin
1.4.1 Conventional
1.4.2 Organic
1.5 Segmentation By Application
1.5.1 Food & Beverages
1.5.2 Cosmetics & Personal Care
1.5.3 Accessories
1.5.4 Other Applications
1.6 Segmentation By Source
1.6.1 Leaves
1.6.2 Seed
1.6.3 Roots
1.6.4 Flowers
1.6.5 Other Source
1.7 Segmentation By Country
1.7.1 US
1.7.1.1 Segmentation By Origin
1.7.1.1.1 Conventional
1.7.1.1.2 Organic
1.7.1.2 Segmentation By Application
1.7.1.2.1 Food & Beverages
1.7.1.2.2 Cosmetics & Personal Care
1.7.1.2.3 Accessories
1.7.1.2.4 Other Application
1.7.1.3 Segmentation By Source
1.7.1.3.1 Leaves
1.7.1.3.2 Seed
1.7.1.3.3 Roots
1.7.1.3.4 Flowers
1.7.1.3.5 Other Source
1.7.2 Canada
1.7.2.1 Segmentation By Origin
1.7.2.1.1 Conventional
1.7.2.1.2 Organic
1.7.2.2 Segmentation By Application
1.7.2.2.1 Food & Beverages
1.7.2.2.2 Cosmetics & Personal Care
1.7.2.2.3 Accessories
1.7.2.2.4 Other Application
1.7.2.3 Segmentation By Source
1.7.2.3.1 Leaves
1.7.2.3.2 Seed
1.7.2.3.3 Roots
1.7.2.3.4 Flowers
1.7.2.3.5 Other Source
1.7.3 Mexico
1.7.3.1 Segmentation By Origin
1.7.3.1.1 Conventional
1.7.3.1.2 Organic
1.7.3.2 Segmentation By Application
1.7.3.2.1 Food & Beverages
1.7.3.2.2 Cosmetics & Personal Care
1.7.3.2.3 Accessories
1.7.3.2.4 Other Application
1.7.3.3 Segmentation By Source
1.7.3.3.1 Leaves
1.7.3.3.2 Seed
1.7.3.3.3 Roots
1.7.3.3.4 Flowers
1.7.3.3.5 Other Source
1.7.4 Rest of North America
1.7.4.1 Segmentation By Origin
1.7.4.1.1 Conventional
1.7.4.1.2 Organic
1.7.4.2 Segmentation By Application
1.7.4.2.1 Food & Beverages
1.7.4.2.2 Cosmetics & Personal Care
1.7.4.2.3 Accessories
1.7.4.2.4 Other Application
1.7.4.3 Segmentation By Source
1.7.4.3.1 Leaves
1.7.4.3.2 Seed
1.7.4.3.3 Roots
1.7.4.3.4 Flowers
1.7.4.3.5 Other Source
Chapter 2. Company Snapshots
2.1 Grenera Nutrients Pvt. Ltd.
2.1.1 Business Overview
2.1.2 Key Information
2.1.3 Company Focus on Moringa Ingredients Market
2.1.4 Strategic Insights
2.1.5 Strategy Deployed
2.1.6 Product & Service Portfolio
2.1.7 Capability Overview
2.1.8 Technology & Innovation Focus
2.1.9 SWOT Analysis
2.1.10 Customers / End Users
2.1.11 Competitive Positioning
2.1.12 Key Differentiators
2.1.13 Portfolio Matrix
2.1.14 Analyst View
2.1.15 Future Outlook
2.2 Tata Consumer Products Ltd.
2.2.1 Business Overview
2.2.2 Key Information
2.2.3 Company Focus on Moringa Ingredients Market
2.2.4 Strategic Insights
2.2.5 Strategy Deployed
2.2.6 Product & Service Portfolio
2.2.7 Capability Overview
2.2.8 Technology & Innovation Focus
2.2.9 SWOT Analysis
2.2.10 Customers / End Users
2.2.11 Competitive Positioning
2.2.12 Key Differentiators
2.2.13 Portfolio Matrix
2.2.14 Analyst View
2.2.15 Future Outlook
2.3 Kuli Kuli Foods Inc.
2.3.1 Business Overview
2.3.2 Key Information
2.3.3 Company Focus on Moringa Ingredients Market
2.3.4 Strategic Insights
2.3.5 Strategy Deployed
2.3.6 Product & Service Portfolio
2.3.7 Capability Overview
2.3.8 Technology & Innovation Focus
2.3.9 SWOT Analysis
2.3.10 Customers / End Users
2.3.11 Competitive Positioning
2.3.12 Key Differentiators
2.3.13 Portfolio Matrix
2.3.14 Analyst View
2.3.15 Future Outlook
2.4 Ancient Greenfields Pvt. Ltd.
2.4.1 Business Overview
2.4.2 Company Profile
2.4.3 Company Focus on Moringa Ingredients Market
2.4.4 Strategic Insights
2.4.5 Strategy Deployed
2.4.6 Product & Service Portfolio
2.4.7 Capability Overview
2.4.8 Technology & Innovation Focus
2.4.9 SWOT Analysis
2.4.10 Customers / End Users
2.4.11 Competitive Positioning
2.4.12 Key Differentiators
2.4.13 Portfolio Matrix
2.4.14 Analyst View
2.4.15 Future Outlook
2.5 Earth Expo Company
2.5.1 Business Overview
2.5.2 Company Profile
2.5.3 Company Focus on Moringa Ingredients Market
2.5.4 Strategic Insights
2.5.5 Strategy Deployed
2.5.6 Product & Service Portfolio
2.5.7 Capability Overview
2.5.8 Technology & Innovation Focus
2.5.9 SWOT Analysis
2.5.10 Customers / End Users
2.5.11 Competitive Positioning
2.5.12 Key Differentiators
2.5.13 Portfolio Matrix
2.5.14 Analyst View
2.5.15 Future Outlook
2.6 Herbs & Crops Overseas
2.6.1 Business Overview
2.6.2 Key Information
2.6.3 Company Focus on Moringa Ingredients Market
2.6.4 Strategic Insights
2.6.5 Strategy Deployed
2.6.6 Product & Service Portfolio
2.6.7 Capability Overview
2.6.8 Technology & Innovation Focus
2.6.9 SWOT Analysis
2.6.10 Customers / End Users
2.6.11 Competitive Positioning
2.6.12 Key Differentiators
2.6.13 Portfolio Matrix
2.6.14 Analyst View
2.6.15 Future Outlook
2.7 Himalaya Global Holdings Ltd.
2.7.1 Business Overview
2.7.2 Key Information
2.7.3 Company Focus on Moringa Ingredients Market
2.7.4 Strategic Insights
2.7.5 Strategy Deployed
2.7.6 Product & Service Portfolio
2.7.7 Capability Overview
2.7.8 Technology & Innovation Focus
2.7.9 SWOT Analysis
2.7.10 Customers / End Users
2.7.11 Competitive Positioning
2.7.12 Key Differentiators
2.7.13 Portfolio Matrix
2.7.14 Analyst View
2.7.15 Future Outlook
2.8 Saipro Biotech Pvt. Ltd.
2.8.1 Business Overview
2.8.2 Key Information
2.8.3 Company Focus on Moringa Ingredients Market
2.8.4 Strategic Insights
2.8.5 Strategy Deployed
2.8.6 Product & Service Portfolio
2.8.7 Capability Overview
2.8.8 Technology & Innovation Focus
2.8.9 SWOT Analysis
2.8.10 Customers / End Users
2.8.11 Competitive Positioning
2.8.12 Key Differentiators
2.8.13 Portfolio Matrix
2.8.14 Analyst View
2.8.15 Future Outlook
2.9 Santan International
2.9.1 Business Overview
2.9.2 Key Information
2.9.3 Company Focus on Moringa Ingredients Market
2.9.4 Strategic Insights
2.9.5 Strategy Deployed
2.9.6 Product & Service Portfolio
2.9.7 Capability Overview
2.9.8 Technology & Innovation Focus
2.9.9 SWOT Analysis
2.9.10 Customers / End Users
2.9.11 Competitive Positioning
2.9.12 Key Differentiators
2.9.13 Portfolio Matrix
2.9.14 Analyst View
2.9.15 Future Outlook
2.10 Green Era Foods & Nutraceutics
2.10.1 Business Overview
2.10.2 Key Information
2.10.3 Company Focus on Moringa Ingredients Market
2.10.4 Strategic Insights
2.10.5 Strategy Deployed
2.10.6 Product & Service Portfolio
2.10.7 Capability Overview
2.10.8 Technology & Innovation Focus
2.10.9 SWOT Analysis
2.10.10 Customers / End Users
2.10.11 Competitive Positioning 2.10.12 Key Differentiators
2.10.13 Portfolio Matrix
2.10.14 Analyst View
2.10.15 Future Outlook
Table 1 North America Moringa Ingredients Market Market, 2022 - 2033, USD Million
Table 2 North America Moringa Ingredients Market Market by Application, 2022 - 2033, USD Million
Table 3 North America Accessories Market, 2022 - 2033, USD Million
Table 4 North America Cosmetics & Personal Care Market, 2022 - 2033, USD Million
Table 5 North America Food & Beverages Market, 2022 - 2033, USD Million
Table 6 North America Other Application Market, 2022 - 2033, USD Million
Table 7 North America Moringa Ingredients Market Market by Origin, 2022 - 2033, USD Million
Table 8 North America Conventional Market, 2022 - 2033, USD Million
Table 9 North America Organic Market, 2022 - 2033, USD Million
Table 10 North America Moringa Ingredients Market Market by Source, 2022 - 2033, USD Million
Table 11 North America Flowers Market, 2022 - 2033, USD Million
Table 12 North America Leaves Market, 2022 - 2033, USD Million
Table 13 North America Other Source Market, 2022 - 2033, USD Million
Table 14 North America Roots Market, 2022 - 2033, USD Million
Table 15 North America Seed Market, 2022 - 2033, USD Million
Table 16 United States Moringa Ingredients Market Market, 2022 - 2033, USD Million
Table 17 United States Moringa Ingredients Market Market by Application, 2022 - 2033, USD Million
Table 18 United States Accessories Market, 2022 - 2033, USD Million
Table 19 United States Cosmetics & Personal Care Market, 2022 - 2033, USD Million
Table 20 United States Food & Beverages Market, 2022 - 2033, USD Million
Table 21 United States Other Application Market, 2022 - 2033, USD Million
Table 22 United States Moringa Ingredients Market Market by Origin, 2022 - 2033, USD Million
Table 23 United States Conventional Market, 2022 - 2033, USD Million
Table 24 United States Organic Market, 2022 - 2033, USD Million
Table 25 United States Moringa Ingredients Market Market by Source, 2022 - 2033, USD Million
Table 26 United States Flowers Market, 2022 - 2033, USD Million
Table 27 United States Leaves Market, 2022 - 2033, USD Million
Table 28 United States Other Source Market, 2022 - 2033, USD Million
Table 29 United States Roots Market, 2022 - 2033, USD Million
Table 30 United States Seed Market, 2022 - 2033, USD Million
Table 31 Canada Moringa Ingredients Market Market, 2022 - 2033, USD Million
Table 32 Canada Moringa Ingredients Market Market by Application, 2022 - 2033, USD Million
Table 33 Canada Accessories Market, 2022 - 2033, USD Million
Table 34 Canada Cosmetics & Personal Care Market, 2022 - 2033, USD Million
Table 35 Canada Food & Beverages Market, 2022 - 2033, USD Million
Table 36 Canada Other Application Market, 2022 - 2033, USD Million
Table 37 Canada Moringa Ingredients Market Market by Origin, 2022 - 2033, USD Million
Table 38 Canada Conventional Market, 2022 - 2033, USD Million
Table 39 Canada Organic Market, 2022 - 2033, USD Million
Table 40 Canada Moringa Ingredients Market Market by Source, 2022 - 2033, USD Million
Table 41 Canada Flowers Market, 2022 - 2033, USD Million
Table 42 Canada Leaves Market, 2022 - 2033, USD Million
Table 43 Canada Other Source Market, 2022 - 2033, USD Million
Table 44 Canada Roots Market, 2022 - 2033, USD Million
Table 45 Canada Seed Market, 2022 - 2033, USD Million
Table 46 Mexico Moringa Ingredients Market Market, 2022 - 2033, USD Million
Table 47 Mexico Moringa Ingredients Market Market by Application, 2022 - 2033, USD Million
Table 48 Mexico Accessories Market, 2022 - 2033, USD Million
Table 49 Mexico Cosmetics & Personal Care Market, 2022 - 2033, USD Million
Table 50 Mexico Food & Beverages Market, 2022 - 2033, USD Million
Table 51 Mexico Other Application Market, 2022 - 2033, USD Million
Table 52 Mexico Moringa Ingredients Market Market by Origin, 2022 - 2033, USD Million
Table 53 Mexico Conventional Market, 2022 - 2033, USD Million
Table 54 Mexico Organic Market, 2022 - 2033, USD Million
Table 55 Mexico Moringa Ingredients Market Market by Source, 2022 - 2033, USD Million
Table 56 Mexico Flowers Market, 2022 - 2033, USD Million
Table 57 Mexico Leaves Market, 2022 - 2033, USD Million
Table 58 Mexico Other Source Market, 2022 - 2033, USD Million
Table 59 Mexico Roots Market, 2022 - 2033, USD Million
Table 60 Mexico Seed Market, 2022 - 2033, USD Million
Table 61 Rest of North America Moringa Ingredients Market Market, 2022 - 2033, USD Million
Table 62 Rest of North America Moringa Ingredients Market Market by Application, 2022 - 2033, USD Million
Table 63 Rest of North America Accessories Market, 2022 - 2033, USD Million
Table 64 Rest of North America Cosmetics & Personal Care Market, 2022 - 2033, USD Million
Table 65 Rest of North America Food & Beverages Market, 2022 - 2033, USD Million
Table 66 Rest of North America Other Application Market, 2022 - 2033, USD Million
Table 67 Rest of North America Moringa Ingredients Market Market by Origin, 2022 - 2033, USD Million
Table 68 Rest of North America Conventional Market, 2022 - 2033, USD Million
Table 69 Rest of North America Organic Market, 2022 - 2033, USD Million
Table 70 Rest of North America Moringa Ingredients Market Market by Source, 2022 - 2033, USD Million
Table 71 Rest of North America Flowers Market, 2022 - 2033, USD Million
Table 72 Rest of North America Leaves Market, 2022 - 2033, USD Million
Table 73 Rest of North America Other Source Market, 2022 - 2033, USD Million
Table 74 Rest of North America Roots Market, 2022 - 2033, USD Million
Table 75 Rest of North America Seed Market, 2022 - 2033, USD Million
List of Figures
FIG 1 Key Factors Impacting Market
FIG 2 Market Consolidation
FIG 3 Key Customer Criteria
FIG 4 Product Life Cycle
FIG 5 North America Moringa Ingredients Market Market, 2022 - 2033, USD Million
FIG 6 North America Moringa Ingredients Market Market by Application, 2022 - 2033, USD Million
FIG 7 North America Accessories Market, 2022 - 2033, USD Million
FIG 8 North America Cosmetics & Personal Care Market, 2022 - 2033, USD Million
FIG 9 North America Food & Beverages Market, 2022 - 2033, USD Million
FIG 10 North America Other Application Market, 2022 - 2033, USD Million
FIG 11 North America Moringa Ingredients Market Market by Origin, 2022 - 2033, USD Million
FIG 12 North America Conventional Market, 2022 - 2033, USD Million
FIG 13 North America Organic Market, 2022 - 2033, USD Million
FIG 14 North America Moringa Ingredients Market Market by Source, 2022 - 2033, USD Million
FIG 15 North America Flowers Market, 2022 - 2033, USD Million
FIG 16 North America Leaves Market, 2022 - 2033, USD Million
FIG 17 North America Other Source Market, 2022 - 2033, USD Million
FIG 18 North America Roots Market, 2022 - 2033, USD Million
FIG 19 North America Seed Market, 2022 - 2033, USD Million
FIG 20 United States Moringa Ingredients Market Market, 2022 - 2033, USD Million
FIG 21 United States Moringa Ingredients Market Market by Application, 2022 - 2033, USD Million
FIG 22 United States Accessories Market, 2022 - 2033, USD Million
FIG 23 United States Cosmetics & Personal Care Market, 2022 - 2033, USD Million
FIG 24 United States Food & Beverages Market, 2022 - 2033, USD Million
FIG 25 United States Other Application Market, 2022 - 2033, USD Million
FIG 26 United States Moringa Ingredients Market Market by Origin, 2022 - 2033, USD Million
FIG 27 United States Conventional Market, 2022 - 2033, USD Million
FIG 28 United States Organic Market, 2022 - 2033, USD Million
FIG 29 United States Moringa Ingredients Market Market by Source, 2022 - 2033, USD Million
FIG 30 United States Flowers Market, 2022 - 2033, USD Million
FIG 31 United States Leaves Market, 2022 - 2033, USD Million
FIG 32 United States Other Source Market, 2022 - 2033, USD Million
FIG 33 United States Roots Market, 2022 - 2033, USD Million
FIG 34 United States Seed Market, 2022 - 2033, USD Million
FIG 35 Canada Moringa Ingredients Market Market, 2022 - 2033, USD Million
FIG 36 Canada Moringa Ingredients Market Market by Application, 2022 - 2033, USD Million
FIG 37 Canada Accessories Market, 2022 - 2033, USD Million
FIG 38 Canada Cosmetics & Personal Care Market, 2022 - 2033, USD Million
FIG 39 Canada Food & Beverages Market, 2022 - 2033, USD Million
FIG 40 Canada Other Application Market, 2022 - 2033, USD Million
FIG 41 Canada Moringa Ingredients Market Market by Origin, 2022 - 2033, USD Million
FIG 42 Canada Conventional Market, 2022 - 2033, USD Million
FIG 43 Canada Organic Market, 2022 - 2033, USD Million
FIG 44 Canada Moringa Ingredients Market Market by Source, 2022 - 2033, USD Million
FIG 45 Canada Flowers Market, 2022 - 2033, USD Million
FIG 46 Canada Leaves Market, 2022 - 2033, USD Million
FIG 47 Canada Other Source Market, 2022 - 2033, USD Million
FIG 48 Canada Roots Market, 2022 - 2033, USD Million
FIG 49 Canada Seed Market, 2022 - 2033, USD Million
FIG 50 Mexico Moringa Ingredients Market Market, 2022 - 2033, USD Million
FIG 51 Mexico Moringa Ingredients Market Market by Application, 2022 - 2033, USD Million
FIG 52 Mexico Accessories Market, 2022 - 2033, USD Million
FIG 53 Mexico Cosmetics & Personal Care Market, 2022 - 2033, USD Million
FIG 54 Mexico Food & Beverages Market, 2022 - 2033, USD Million
FIG 55 Mexico Other Application Market, 2022 - 2033, USD Million
FIG 56 Mexico Moringa Ingredients Market Market by Origin, 2022 - 2033, USD Million
FIG 57 Mexico Conventional Market, 2022 - 2033, USD Million
FIG 58 Mexico Organic Market, 2022 - 2033, USD Million
FIG 59 Mexico Moringa Ingredients Market Market by Source, 2022 - 2033, USD Million
FIG 60 Mexico Flowers Market, 2022 - 2033, USD Million
FIG 61 Mexico Leaves Market, 2022 - 2033, USD Million
FIG 62 Mexico Other Source Market, 2022 - 2033, USD Million
FIG 63 Mexico Roots Market, 2022 - 2033, USD Million
FIG 64 Mexico Seed Market, 2022 - 2033, USD Million
FIG 65 Rest of North America Moringa Ingredients Market Market, 2022 - 2033, USD Million
FIG 66 Rest of North America Moringa Ingredients Market Market by Application, 2022 - 2033, USD Million
FIG 67 Rest of North America Accessories Market, 2022 - 2033, USD Million
FIG 68 Rest of North America Cosmetics & Personal Care Market, 2022 - 2033, USD Million
FIG 69 Rest of North America Food & Beverages Market, 2022 - 2033, USD Million
FIG 70 Rest of North America Other Application Market, 2022 - 2033, USD Million
FIG 71 Rest of North America Moringa Ingredients Market Market by Origin, 2022 - 2033, USD Million
FIG 72 Rest of North America Conventional Market, 2022 - 2033, USD Million
FIG 73 Rest of North America Organic Market, 2022 - 2033, USD Million
FIG 74 Rest of North America Moringa Ingredients Market Market by Source, 2022 - 2033, USD Million
FIG 75 Rest of North America Flowers Market, 2022 - 2033, USD Million
FIG 76 Rest of North America Leaves Market, 2022 - 2033, USD Million
FIG 77 Rest of North America Other Source Market, 2022 - 2033, USD Million
FIG 78 Rest of North America Roots Market, 2022 - 2033, USD Million
FIG 79 Rest of North America Seed Market, 2022 - 2033, USD Million