LAMEA Social Networking App Market Size, Share & Industry Analysis Report By Device Type (Smartphones, and Other Device Type), By Revenue Source (Advertising, and In-App Purchase), By Marketplace (Google Play Store, and Apple App Store), By Country Outlook and Forecast, 2026 - 2033
Published Date : 25-Oct-2026 |
Pages: 244 |
Report Format: PDF + Excel |
COVID-19 Impact on the LAMEA Social Networking App Market
The LAMEA Social Networking App Market is expected to reach USD 14.1 billion by 2029, growing at a CAGR of 29.9% during (2026 - 2033).
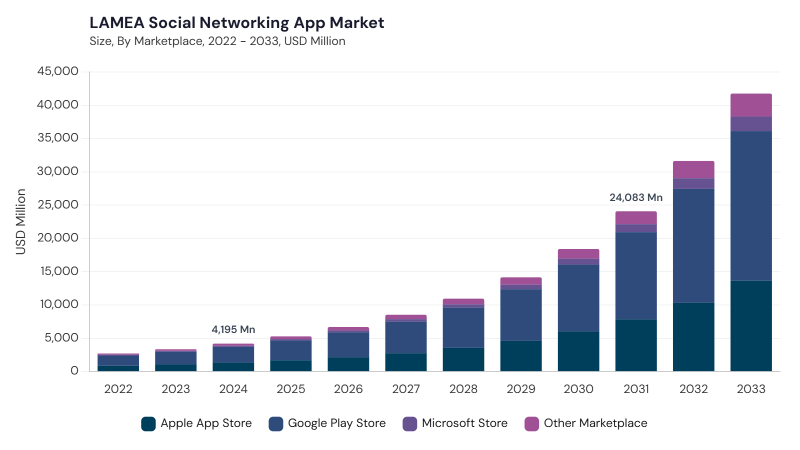
The LAMEA Social Networking App Market originated from the broader evolution of mobile communication and internet penetration across Latin America, the Middle East, and Africa. Early development was marked by the gradual adoption of smartphones and expanding mobile internet access, which shifted social networking platforms from web-based interfaces to mobile-first applications suited to diverse linguistic and cultural settings. Over time, affordable smartphones, 4G and emerging 5G infrastructure, multimedia sharing, live streaming, advanced privacy controls, localized content, vernacular features, indigenous platforms, and AI-driven moderation transformed the market into a diversified ecosystem of global and regional platforms.
Current market growth is shaped by mobile-first adoption, privacy and data sovereignty concerns, cultural customization, local-language support, digital payments, gamified social experiences, AI-powered personalization, and social commerce. Platforms are increasingly developing lightweight applications, low-bandwidth optimization, localized interfaces, creator tools, video-sharing features, transparent data controls, and region-specific moderation capabilities. Demand is also rising for apps that support community interaction, entertainment, digital content consumption, targeted advertising, e-commerce extensions, local business engagement, and culturally relevant user experiences across LAMEA.
Device Type Outlook
Based on Device Type, the market is segmented into Smartphones and Other Device Type. The Smartphones market dominated the LAMEA Social Networking App Market by Device Type in 2025, and would continue to be a dominant market till 2033; thereby, achieving a market value of USD 12.9 billion by 2029, growing at a CAGR of 29.6 % during the forecast period. The Other Device Type market is expected to witness a CAGR of 33% during (2026 - 2033).
Smartphones remain the leading device type as they support instant messaging, video calls, stories, live streaming, mobile payments, AI-driven content curation, localized interfaces, region-specific language support, 4G and 5G access, real-time interaction, and multimedia sharing across urban and rural communities. Other Device Type maintains an emerging presence through tablets, computers, laptops, smart televisions, internet-enabled equipment, professional usage, content creation, larger-screen experiences, family entertainment, education, workplace communication, and extended browsing sessions.
Revenue Source Outlook
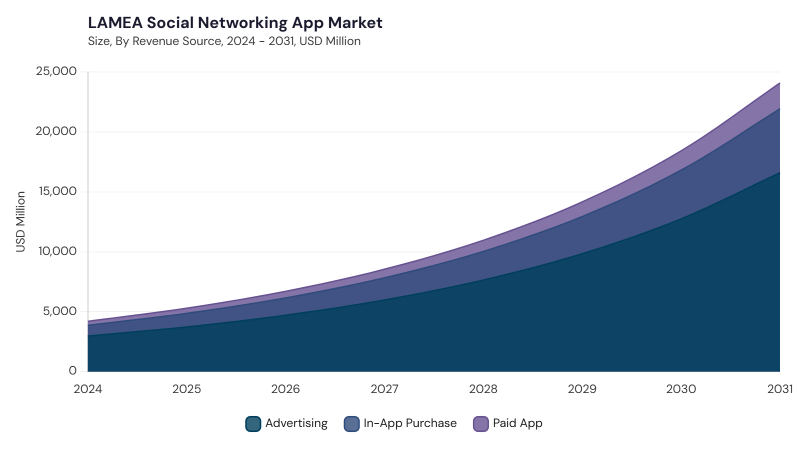
Based on Revenue Source, the market is segmented into Advertising, In-App Purchase, and Paid App. Advertising remains the leading revenue source as it supports display ads, video ads, sponsored content, native advertising, programmatic advertising, influencer marketing, targeted promotions, small and medium-sized enterprise digitalization, personalized offers, and free-access app models.
In-App Purchase develops a significant foothold through virtual gifting, optional subscriptions, premium features, creator-oriented transactions, virtual currencies, digital enhancements, gamified interactions, exclusive content, event tickets, and social commerce-linked spending. Paid App represents a promising outlook through subscription-based models, one-time purchase fees, exclusive communities, professional capabilities, enhanced privacy functions, ad-free experiences, specialized networking tools, and differentiated social platforms serving committed user groups.
Marketplace Outlook
Based on Marketplace, the market is segmented into Google Play Store, Apple App Store, Microsoft Store, and Other Marketplace. Google Play Store remains the leading marketplace as it supports Android-based social apps, affordable device users, mass-market reach, local-language applications, niche community platforms, in-app purchases, advertising, rapid updates, analytics tools, secure payments, and localized content adoption. Apple App Store maintains a substantial presence through premium-device users, affluent urban consumers, curated app quality, secure transactions, Apple Pay integration, sophisticated communication apps, creator applications, advanced social features, and privacy-focused user experiences.
Other Marketplace establishes a considerable standing through alternative application stores, third-party Android stores, local carrier shops, manufacturer ecosystems, direct distribution, decentralized marketplaces, lightweight apps, offline functions, and remote or underserved user access. Microsoft Store constitutes a promising presence through Windows-based access, professional networking, communication apps, community platforms, entertainment applications, collaboration tools, education users, corporate environments, productivity integration, and desktop-oriented social networking.
Free Valuable Insights: Social Networking App Market Size Worth USD 680.0 Billion billion by 2033
Country Outlook
Based on Country, the market is segmented into Brazil, Argentina, UAE, Saudi Arabia, South Africa, Nigeria, and Rest of LAMEA. The Brazil market dominated the LAMEA Social Networking App Market by Country in 2025, and would continue to be a dominant market till 2033; thereby, achieving a market value of USD 4.0 billion by 2029, growing at a CAGR of 28.4 % during the forecast period. The Argentina market is expected to witness a CAGR of 30.9% during (2026 - 2033). Additionally, The UAE market is expected to witness a CAGR of 27.7% during (2026 - 2033).
Brazil is shaped by video-centric content, live streaming, AR filters, privacy-first design, social commerce, fintech partnerships, and localized Brazilian engagement, while Argentina reflects privacy demand, hyper-localized content, AR, live streaming, AI personalization, telecom partnerships, and culturally adapted user experiences. The UAE is supported by Arabic-language localization, e-commerce integration, privacy and data security, AI-driven personalization, AR functionality, 5G, cloud infrastructure, and regional fintech collaboration, whereas Saudi Arabia is driven by hyper-localization, AR and VR, data privacy, youth engagement, Vision-linked digital infrastructure, AI-powered moderation, and native language support. South Africa is advancing through fintech integration, localized content governance, AI-powered feeds, multilingual support, telecom partnerships, mobile-optimized interfaces, and cloud-based scalability. Nigeria is influenced by mobile-first access, low-data optimization, localized content, vernacular languages, AI moderation, mobile financial services, and partnerships with telecom, creator, and payment providers, while Rest of LAMEA is shaped by social commerce, niche communities, privacy protocols, AI moderation, hyper-local content, payment gateways, backend infrastructure, and culturally coherent digital engagement.
List of Key Companies Profiled
- Meta Platforms, Inc.
- ByteDance Ltd.
- Alphabet Inc.
- Tencent Holdings Ltd.
- Kuaishou Technology
- Microsoft Corporation
- Snap Inc.
- Pinterest, Inc.
- Reddit, Inc.
- X Corp.
LAMEA Social Networking App Market Report Segmentation
By Device Type
- Smartphones
- Other Device Type
By Revenue Source
- Advertising
- In-App Purchase
- Paid App
By Marketplace
- Google Play Store
- Apple App Store
- Microsoft Store
- Other Marketplace
By Country
- Brazil
- Argentina
- UAE
- Saudi Arabia
- South Africa
- Nigeria
- Rest of LAMEA
1.1 Market Overview
1.2 Key Factors Impacting Market
1.2.1 Market Drivers
1.2.2 Market Restraints
1.2.3 Market Opportunities
1.2.4 Market Challenges
1.2.5 Market Trends
1.2.6 State of Competition
1.2.7 Market Consolidation
1.2.8 Key Customer Criteria
1.3 Product Life Cycle
1.4 Segmentation By Device Type
1.4.1 Smartphones
1.4.2 Tablets
1.4.3 Other Device Types
1.5 Segmentation By Revenue Source
1.5.1 Advertising
1.5.2 In-App Purchase
1.5.3 Paid App
1.6 Segmentation By Marketplace
1.6.1 Google Play Store
1.6.2 Apple App Store
1.6.3 Microsoft Store
1.6.4 Other Marketplace
1.7 Segmentation By Country
1.7.1 Brazil
1.7.1.1 Segmentation By Device Type
1.7.1.1.1 Smartphones
1.7.1.1.2 Other Device Type
1.7.1.2 Segmentation By Revenue Source
1.7.1.2.1 Advertising
1.7.1.2.2 In-App Purchase
1.7.1.2.3 Paid App
1.7.1.3 Segmentation By Marketplace
1.7.1.3.1 Google Play Store
1.7.1.3.2 Apple App Store
1.7.1.3.3 Microsoft Store
1.7.1.3.4 Other Marketplace
1.7.2 Argentina
1.7.2.1 Segmentation By Device Type
1.7.2.1.1 Smartphones
1.7.2.1.2 Other Device Type
1.7.2.2 Segmentation By Revenue Source
1.7.2.2.1 Advertising
1.7.2.2.2 In-App Purchase
1.7.2.2.3 Paid App
1.7.2.3 Segmentation By Marketplace
1.7.2.3.1 Google Play Store
1.7.2.3.2 Apple App Store
1.7.2.3.3 Microsoft Store
1.7.2.3.4 Other Marketplace
1.7.3 UAE
1.7.3.1 Segmentation By Device Type
1.7.3.1.1 Smartphones
1.7.3.1.2 Other Device Type
1.7.3.2 Segmentation By Revenue Source
1.7.3.2.1 Advertising
1.7.3.2.2 In-App Purchase
1.7.3.2.3 Paid App
1.7.3.3 Segmentation By Marketplace
1.7.3.3.1 Google Play Store
1.7.3.3.2 Apple App Store
1.7.3.3.3 Microsoft Store
1.7.3.3.4 Other Marketplace
1.7.4 Saudi Arabia
1.7.4.1 Segmentation By Device Type
1.7.4.1.1 Smartphones
1.7.4.1.2 Other Device Type
1.7.4.2 Segmentation By Revenue Source
1.7.4.2.1 Advertising
1.7.4.2.2 In-App Purchase
1.7.4.2.3 Paid App
1.7.4.3 Segmentation By Marketplace
1.7.4.3.1 Google Play Store
1.7.4.3.2 Apple App Store
1.7.4.3.3 Microsoft Store
1.7.4.3.4 Other Marketplace
1.7.5 South Africa
1.7.5.1 Segmentation By Device Type
1.7.5.1.1 Smartphones
1.7.5.1.2 Other Device Type
1.7.5.2 Segmentation By Revenue Source
1.7.5.2.1 Advertising
1.7.5.2.2 In-App Purchase
1.7.5.2.3 Paid App
1.7.5.3 Segmentation By Marketplace
1.7.5.3.1 Google Play Store
1.7.5.3.2 Apple App Store
1.7.5.3.3 Microsoft Store
1.7.5.3.4 Other Marketplace
1.7.6 Nigeria
1.7.6.1 Segmentation By Device Type
1.7.6.1.1 Smartphones
1.7.6.1.2 Other Device Type
1.7.6.2 Segmentation By Revenue Source
1.7.6.2.1 Advertising
1.7.6.2.2 In-App Purchase
1.7.6.2.3 Paid App
1.7.6.3 Segmentation By Marketplace
1.7.6.3.1 Google Play Store
1.7.6.3.2 Apple App Store
1.7.6.3.3 Microsoft Store
1.7.6.3.4 Other Marketplace
1.7.7 Rest of LAMEA
1.7.7.1 Segmentation By Device Type
1.7.7.1.1 Smartphones
1.7.7.1.2 Other Device Type
1.7.7.2 Segmentation By Revenue Source
1.7.7.2.1 Advertising
1.7.7.2.2 In-App Purchase
1.7.7.2.3 Paid App
1.7.7.3 Segmentation By Marketplace
1.7.7.3.1 Google Play Store
1.7.7.3.2 Apple App Store
1.7.7.3.3 Microsoft Store
1.7.7.3.4 Other Marketplace
Chapter 2. Company Snapshots
2.1 Meta Platforms
2.1.1 Business Overview
2.1.2 Key Information
2.1.3 Company Focus on Social Networking App Market
2.1.4 Strategic Insights
2.1.5 Strategy Deployed
2.1.6 Product & Service Portfolio
2.1.7 Capability Overview
2.1.8 Technology & Innovation Focus
2.1.9 SWOT Analysis
2.1.10 Customers / End Users
2.1.11 Competitive Positioning
2.1.12 Key Differentiators
2.1.13 Portfolio Matrix
2.1.14 Analyst View
2.1.15 Future Outlook
2.2 ByteDance
2.2.1 Business Overview
2.2.2 Key Information
2.2.3 Company Focus on Social Networking App Market
2.2.4 Strategic Insights
2.2.5 Strategy Deployed
2.2.6 Product & Service Portfolio
2.2.7 Capability Overview
2.2.8 Technology & Innovation Focus
2.2.9 SWOT Analysis
2.2.10 Customers / End Users
2.2.11 Competitive Positioning
2.2.12 Key Differentiators
2.2.13 Portfolio Matrix
2.2.14 Analyst View
2.2.15 Future Outlook
2.3 Alphabet
2.3.1 Business Overview
2.3.2 Key Information
2.3.3 Company Focus on Social Networking App Market
2.3.4 Strategic Insights
2.3.5 Strategy Deployed
2.3.6 Product & Service Portfolio
2.3.7 Capability Overview
2.3.8 Technology & Innovation Focus
2.3.9 SWOT Analysis
2.3.10 Customers / End Users
2.3.11 Competitive Positioning
2.3.12 Key Differentiators
2.3.13 Portfolio Matrix
2.3.14 Analyst View
2.3.15 Future Outlook
2.4 Tencent
2.4.1 Business Overview
2.4.2 Key Information
2.4.3 Company Focus on Social Networking App Market
2.4.4 Strategic Insights
2.4.5 Strategy Deployed
2.4.6 Product & Service Portfolio
2.4.7 Capability Overview
2.4.8 Technology & Innovation Focus
2.4.9 SWOT Analysis
2.4.10 Customers / End Users
2.4.11 Competitive Positioning
2.4.12 Key Differentiators
2.4.13 Portfolio Matrix
2.4.14 Analyst View
2.4.15 Future Outlook
2.5 Kuaishou Technology
2.5.1 Business Overview
2.5.2 Key Information
2.5.3 Company Focus on Social Networking App Market
2.5.4 Strategic Insights
2.5.5 Strategy Deployed
2.5.6 Product & Service Portfolio
2.5.7 Capability Overview
2.5.8 Technology & Innovation Focus
2.5.9 SWOT Analysis
2.5.10 Customers / End Users
2.5.11 Competitive Positioning
2.5.12 Portfolio Matrix
2.5.13 Analyst View
2.5.14 Future Outlook
2.6 Microsoft
2.6.1 Business Overview
2.6.2 Key Information
2.6.3 Company Focus on Social Networking App Market
2.6.4 Strategic Insights
2.6.5 Strategy Deployed
2.6.6 Product & Service Portfolio
2.6.7 Capability Overview
2.6.8 Technology & Innovation Focus
2.6.9 SWOT Analysis
2.6.10 Customers / End Users
2.6.11 Competitive Positioning
2.6.12 Key Differentiators
2.6.13 Portfolio Matrix
2.6.14 Analyst View
2.6.15 Future Outlook
2.7 Snap Inc.
2.7.1 Business Overview
2.7.2 Key Information
2.7.3 Company Focus on Social Networking App Market
2.7.4 Strategic Insights
2.7.5 Strategy Deployed
2.7.6 Product & Service Portfolio
2.7.7 Capability Overview
2.7.8 Technology & Innovation Focus
2.7.9 SWOT Analysis
2.7.10 Customers / End Users
2.7.11 Competitive Positioning
2.7.12 Key Differentiators
2.7.13 Portfolio Matrix
2.7.14 Analyst View
2.7.15 Future Outlook
2.8 Pinterest
2.8.1 Business Overview
2.8.2 Key Information
2.8.3 Company Focus on Social Networking App Market
2.8.4 Strategic Insights
2.8.5 Strategy Deployed
2.8.6 Product & Service Portfolio
2.8.7 Capability Overview
2.8.8 Technology & Innovation Focus
2.8.9 SWOT Analysis
2.8.10 Customers / End Users
2.8.11 Competitive Positioning
2.8.12 Key Differentiators
2.8.13 Portfolio Matrix
2.8.14 Analyst View 2.8.15 Future Outlook
2.9 Reddit
2.9.1 Business Overview
2.9.2 Key Information
2.9.3 Company Focus on Social Networking App Market
2.9.4 Strategic Insights
2.9.5 Strategy Deployed
2.9.6 Product & Service Portfolio
2.9.7 Capability Overview
2.9.8 Technology & Innovation Focus
2.9.9 SWOT Analysis
2.9.10 Customers / End Users
2.9.11 Competitive Positioning
2.9.12 Key Differentiators
2.9.13 Portfolio Matrix
2.9.14 Analyst View
2.9.15 Future Outlook
2.10 X Corp.
2.10.1 Business Overview
2.10.2 Key Information
2.10.3 Company Focus on Social Networking App Market
2.10.4 Strategic Insights
2.10.5 Strategy Deployed
2.10.6 Product & Service Portfolio
2.10.7 Capability Overview
2.10.8 Technology & Innovation Focus
2.10.9 SWOT Analysis
2.10.10 Customers / End Users
2.10.11 Competitive Positioning
2.10.12 Key Differentiators
2.10.13 Portfolio Matrix
2.10.14 Analyst View
2.10.15 Future Outlook
Table 1 LAMEA Social Networking App Market Market, 2022 - 2033, USD Million
Table 2 LAMEA Social Networking App Market Market by Device Type, 2022 - 2033, USD Million
Table 3 LAMEA Other Device Type Market, 2022 - 2033, USD Million
Table 4 LAMEA Smartphones Market, 2022 - 2033, USD Million
Table 5 LAMEA Social Networking App Market Market by Marketplace, 2022 - 2033, USD Million
Table 6 LAMEA Apple App Store Market, 2022 - 2033, USD Million
Table 7 LAMEA Google Play Store Market, 2022 - 2033, USD Million
Table 8 LAMEA Microsoft Store Market, 2022 - 2033, USD Million
Table 9 LAMEA Other Marketplace Market, 2022 - 2033, USD Million
Table 10 LAMEA Social Networking App Market Market by Revenue Source, 2022 - 2033, USD Million
Table 11 LAMEA Advertising Market, 2022 - 2033, USD Million
Table 12 LAMEA In-App Purchase Market, 2022 - 2033, USD Million
Table 13 LAMEA Paid App Market, 2022 - 2033, USD Million
Table 14 Brazil Social Networking App Market Market, 2022 - 2033, USD Million
Table 15 Brazil Social Networking App Market Market by Device Type, 2022 - 2033, USD Million
Table 16 Brazil Other Device Type Market, 2022 - 2033, USD Million
Table 17 Brazil Smartphones Market, 2022 - 2033, USD Million
Table 18 Brazil Social Networking App Market Market by Marketplace, 2022 - 2033, USD Million
Table 19 Brazil Apple App Store Market, 2022 - 2033, USD Million
Table 20 Brazil Google Play Store Market, 2022 - 2033, USD Million
Table 21 Brazil Microsoft Store Market, 2022 - 2033, USD Million
Table 22 Brazil Other Marketplace Market, 2022 - 2033, USD Million
Table 23 Brazil Social Networking App Market Market by Revenue Source, 2022 - 2033, USD Million
Table 24 Brazil Advertising Market, 2022 - 2033, USD Million
Table 25 Brazil In-App Purchase Market, 2022 - 2033, USD Million
Table 26 Brazil Paid App Market, 2022 - 2033, USD Million
Table 27 Argentina Social Networking App Market Market, 2022 - 2033, USD Million
Table 28 Argentina Social Networking App Market Market by Device Type, 2022 - 2033, USD Million
Table 29 Argentina Other Device Type Market, 2022 - 2033, USD Million
Table 30 Argentina Smartphones Market, 2022 - 2033, USD Million
Table 31 Argentina Social Networking App Market Market by Marketplace, 2022 - 2033, USD Million
Table 32 Argentina Apple App Store Market, 2022 - 2033, USD Million
Table 33 Argentina Google Play Store Market, 2022 - 2033, USD Million
Table 34 Argentina Microsoft Store Market, 2022 - 2033, USD Million
Table 35 Argentina Other Marketplace Market, 2022 - 2033, USD Million
Table 36 Argentina Social Networking App Market Market by Revenue Source, 2022 - 2033, USD Million
Table 37 Argentina Advertising Market, 2022 - 2033, USD Million
Table 38 Argentina In-App Purchase Market, 2022 - 2033, USD Million
Table 39 Argentina Paid App Market, 2022 - 2033, USD Million
Table 40 United Arab Emirates Social Networking App Market Market, 2022 - 2033, USD Million
Table 41 United Arab Emirates Social Networking App Market Market by Device Type, 2022 - 2033, USD Million
Table 42 United Arab Emirates Other Device Type Market, 2022 - 2033, USD Million
Table 43 United Arab Emirates Smartphones Market, 2022 - 2033, USD Million
Table 44 United Arab Emirates Social Networking App Market Market by Marketplace, 2022 - 2033, USD Million
Table 45 United Arab Emirates Apple App Store Market, 2022 - 2033, USD Million
Table 46 United Arab Emirates Google Play Store Market, 2022 - 2033, USD Million
Table 47 United Arab Emirates Microsoft Store Market, 2022 - 2033, USD Million
Table 48 United Arab Emirates Other Marketplace Market, 2022 - 2033, USD Million
Table 49 United Arab Emirates Social Networking App Market Market by Revenue Source, 2022 - 2033, USD Million
Table 50 United Arab Emirates Advertising Market, 2022 - 2033, USD Million
Table 51 United Arab Emirates In-App Purchase Market, 2022 - 2033, USD Million
Table 52 United Arab Emirates Paid App Market, 2022 - 2033, USD Million
Table 53 Saudi Arabia Social Networking App Market Market, 2022 - 2033, USD Million
Table 54 Saudi Arabia Social Networking App Market Market by Device Type, 2022 - 2033, USD Million
Table 55 Saudi Arabia Other Device Type Market, 2022 - 2033, USD Million
Table 56 Saudi Arabia Smartphones Market, 2022 - 2033, USD Million
Table 57 Saudi Arabia Social Networking App Market Market by Marketplace, 2022 - 2033, USD Million
Table 58 Saudi Arabia Apple App Store Market, 2022 - 2033, USD Million
Table 59 Saudi Arabia Google Play Store Market, 2022 - 2033, USD Million
Table 60 Saudi Arabia Microsoft Store Market, 2022 - 2033, USD Million
Table 61 Saudi Arabia Other Marketplace Market, 2022 - 2033, USD Million
Table 62 Saudi Arabia Social Networking App Market Market by Revenue Source, 2022 - 2033, USD Million
Table 63 Saudi Arabia Advertising Market, 2022 - 2033, USD Million
Table 64 Saudi Arabia In-App Purchase Market, 2022 - 2033, USD Million
Table 65 Saudi Arabia Paid App Market, 2022 - 2033, USD Million
Table 66 South Africa Social Networking App Market Market, 2022 - 2033, USD Million
Table 67 South Africa Social Networking App Market Market by Device Type, 2022 - 2033, USD Million
Table 68 South Africa Other Device Type Market, 2022 - 2033, USD Million
Table 69 South Africa Smartphones Market, 2022 - 2033, USD Million
Table 70 South Africa Social Networking App Market Market by Marketplace, 2022 - 2033, USD Million
Table 71 South Africa Apple App Store Market, 2022 - 2033, USD Million
Table 72 South Africa Google Play Store Market, 2022 - 2033, USD Million
Table 73 South Africa Microsoft Store Market, 2022 - 2033, USD Million
Table 74 South Africa Other Marketplace Market, 2022 - 2033, USD Million
Table 75 South Africa Social Networking App Market Market by Revenue Source, 2022 - 2033, USD Million
Table 76 South Africa Advertising Market, 2022 - 2033, USD Million
Table 77 South Africa In-App Purchase Market, 2022 - 2033, USD Million
Table 78 South Africa Paid App Market, 2022 - 2033, USD Million
Table 79 Nigeria Social Networking App Market Market, 2022 - 2033, USD Million
Table 80 Nigeria Social Networking App Market Market by Device Type, 2022 - 2033, USD Million
Table 81 Nigeria Other Device Type Market, 2022 - 2033, USD Million
Table 82 Nigeria Smartphones Market, 2022 - 2033, USD Million
Table 83 Nigeria Social Networking App Market Market by Marketplace, 2022 - 2033, USD Million
Table 84 Nigeria Apple App Store Market, 2022 - 2033, USD Million
Table 85 Nigeria Google Play Store Market, 2022 - 2033, USD Million
Table 86 Nigeria Microsoft Store Market, 2022 - 2033, USD Million
Table 87 Nigeria Other Marketplace Market, 2022 - 2033, USD Million
Table 88 Nigeria Social Networking App Market Market by Revenue Source, 2022 - 2033, USD Million
Table 89 Nigeria Advertising Market, 2022 - 2033, USD Million
Table 90 Nigeria In-App Purchase Market, 2022 - 2033, USD Million
Table 91 Nigeria Paid App Market, 2022 - 2033, USD Million
Table 92 Rest of LAMEA Social Networking App Market Market, 2022 - 2033, USD Million
Table 93 Rest of LAMEA Social Networking App Market Market by Device Type, 2022 - 2033, USD Million
Table 94 Rest of LAMEA Other Device Type Market, 2022 - 2033, USD Million
Table 95 Rest of LAMEA Smartphones Market, 2022 - 2033, USD Million
Table 96 Rest of LAMEA Social Networking App Market Market by Marketplace, 2022 - 2033, USD Million
Table 97 Rest of LAMEA Apple App Store Market, 2022 - 2033, USD Million
Table 98 Rest of LAMEA Google Play Store Market, 2022 - 2033, USD Million
Table 99 Rest of LAMEA Microsoft Store Market, 2022 - 2033, USD Million
Table 100 Rest of LAMEA Other Marketplace Market, 2022 - 2033, USD Million
Table 101 Rest of LAMEA Social Networking App Market Market by Revenue Source, 2022 - 2033, USD Million
Table 102 Rest of LAMEA Advertising Market, 2022 - 2033, USD Million
Table 103 Rest of LAMEA In-App Purchase Market, 2022 - 2033, USD Million
Table 104 Rest of LAMEA Paid App Market, 2022 - 2033, USD Million
List of Figures
FIG 1 Key Factors Impacting Market
FIG 2 Market Consolidation
FIG 3 Key Customer Criteria
FIG 4 Product Life Cycle
FIG 5 LAMEA Social Networking App Market Market, 2022 - 2033, USD Million
FIG 6 LAMEA Social Networking App Market Market by Device Type, 2022 - 2033, USD Million
FIG 7 LAMEA Other Device Type Market, 2022 - 2033, USD Million
FIG 8 LAMEA Smartphones Market, 2022 - 2033, USD Million
FIG 9 LAMEA Social Networking App Market Market by Marketplace, 2022 - 2033, USD Million
FIG 10 LAMEA Apple App Store Market, 2022 - 2033, USD Million
FIG 11 LAMEA Google Play Store Market, 2022 - 2033, USD Million
FIG 12 LAMEA Microsoft Store Market, 2022 - 2033, USD Million
FIG 13 LAMEA Other Marketplace Market, 2022 - 2033, USD Million
FIG 14 LAMEA Social Networking App Market Market by Revenue Source, 2022 - 2033, USD Million
FIG 15 LAMEA Advertising Market, 2022 - 2033, USD Million
FIG 16 LAMEA In-App Purchase Market, 2022 - 2033, USD Million
FIG 17 LAMEA Paid App Market, 2022 - 2033, USD Million
FIG 18 Brazil Social Networking App Market Market, 2022 - 2033, USD Million
FIG 19 Brazil Social Networking App Market Market by Device Type, 2022 - 2033, USD Million
FIG 20 Brazil Other Device Type Market, 2022 - 2033, USD Million
FIG 21 Brazil Smartphones Market, 2022 - 2033, USD Million
FIG 22 Brazil Social Networking App Market Market by Marketplace, 2022 - 2033, USD Million
FIG 23 Brazil Apple App Store Market, 2022 - 2033, USD Million
FIG 24 Brazil Google Play Store Market, 2022 - 2033, USD Million
FIG 25 Brazil Microsoft Store Market, 2022 - 2033, USD Million
FIG 26 Brazil Other Marketplace Market, 2022 - 2033, USD Million
FIG 27 Brazil Social Networking App Market Market by Revenue Source, 2022 - 2033, USD Million
FIG 28 Brazil Advertising Market, 2022 - 2033, USD Million
FIG 29 Brazil In-App Purchase Market, 2022 - 2033, USD Million
FIG 30 Brazil Paid App Market, 2022 - 2033, USD Million
FIG 31 Argentina Social Networking App Market Market, 2022 - 2033, USD Million
FIG 32 Argentina Social Networking App Market Market by Device Type, 2022 - 2033, USD Million
FIG 33 Argentina Other Device Type Market, 2022 - 2033, USD Million
FIG 34 Argentina Smartphones Market, 2022 - 2033, USD Million
FIG 35 Argentina Social Networking App Market Market by Marketplace, 2022 - 2033, USD Million
FIG 36 Argentina Apple App Store Market, 2022 - 2033, USD Million
FIG 37 Argentina Google Play Store Market, 2022 - 2033, USD Million
FIG 38 Argentina Microsoft Store Market, 2022 - 2033, USD Million
FIG 39 Argentina Other Marketplace Market, 2022 - 2033, USD Million
FIG 40 Argentina Social Networking App Market Market by Revenue Source, 2022 - 2033, USD Million
FIG 41 Argentina Advertising Market, 2022 - 2033, USD Million
FIG 42 Argentina In-App Purchase Market, 2022 - 2033, USD Million
FIG 43 Argentina Paid App Market, 2022 - 2033, USD Million
FIG 44 United Arab Emirates Social Networking App Market Market, 2022 - 2033, USD Million
FIG 45 United Arab Emirates Social Networking App Market Market by Device Type, 2022 - 2033, USD Million
FIG 46 United Arab Emirates Other Device Type Market, 2022 - 2033, USD Million
FIG 47 United Arab Emirates Smartphones Market, 2022 - 2033, USD Million
FIG 48 United Arab Emirates Social Networking App Market Market by Marketplace, 2022 - 2033, USD Million
FIG 49 United Arab Emirates Apple App Store Market, 2022 - 2033, USD Million
FIG 50 United Arab Emirates Google Play Store Market, 2022 - 2033, USD Million
FIG 51 United Arab Emirates Microsoft Store Market, 2022 - 2033, USD Million
FIG 52 United Arab Emirates Other Marketplace Market, 2022 - 2033, USD Million
FIG 53 United Arab Emirates Social Networking App Market Market by Revenue Source, 2022 - 2033, USD Million
FIG 54 United Arab Emirates Advertising Market, 2022 - 2033, USD Million
FIG 55 United Arab Emirates In-App Purchase Market, 2022 - 2033, USD Million
FIG 56 United Arab Emirates Paid App Market, 2022 - 2033, USD Million
FIG 57 Saudi Arabia Social Networking App Market Market, 2022 - 2033, USD Million
FIG 58 Saudi Arabia Social Networking App Market Market by Device Type, 2022 - 2033, USD Million
FIG 59 Saudi Arabia Other Device Type Market, 2022 - 2033, USD Million
FIG 60 Saudi Arabia Smartphones Market, 2022 - 2033, USD Million
FIG 61 Saudi Arabia Social Networking App Market Market by Marketplace, 2022 - 2033, USD Million
FIG 62 Saudi Arabia Apple App Store Market, 2022 - 2033, USD Million
FIG 63 Saudi Arabia Google Play Store Market, 2022 - 2033, USD Million
FIG 64 Saudi Arabia Microsoft Store Market, 2022 - 2033, USD Million
FIG 65 Saudi Arabia Other Marketplace Market, 2022 - 2033, USD Million
FIG 66 Saudi Arabia Social Networking App Market Market by Revenue Source, 2022 - 2033, USD Million
FIG 67 Saudi Arabia Advertising Market, 2022 - 2033, USD Million
FIG 68 Saudi Arabia In-App Purchase Market, 2022 - 2033, USD Million
FIG 69 Saudi Arabia Paid App Market, 2022 - 2033, USD Million
FIG 70 South Africa Social Networking App Market Market, 2022 - 2033, USD Million
FIG 71 South Africa Social Networking App Market Market by Device Type, 2022 - 2033, USD Million
FIG 72 South Africa Other Device Type Market, 2022 - 2033, USD Million
FIG 73 South Africa Smartphones Market, 2022 - 2033, USD Million
FIG 74 South Africa Social Networking App Market Market by Marketplace, 2022 - 2033, USD Million
FIG 75 South Africa Apple App Store Market, 2022 - 2033, USD Million
FIG 76 South Africa Google Play Store Market, 2022 - 2033, USD Million
FIG 77 South Africa Microsoft Store Market, 2022 - 2033, USD Million
FIG 78 South Africa Other Marketplace Market, 2022 - 2033, USD Million
FIG 79 South Africa Social Networking App Market Market by Revenue Source, 2022 - 2033, USD Million
FIG 80 South Africa Advertising Market, 2022 - 2033, USD Million
FIG 81 South Africa In-App Purchase Market, 2022 - 2033, USD Million
FIG 82 South Africa Paid App Market, 2022 - 2033, USD Million
FIG 83 Nigeria Social Networking App Market Market, 2022 - 2033, USD Million
FIG 84 Nigeria Social Networking App Market Market by Device Type, 2022 - 2033, USD Million
FIG 85 Nigeria Other Device Type Market, 2022 - 2033, USD Million
FIG 86 Nigeria Smartphones Market, 2022 - 2033, USD Million
FIG 87 Nigeria Social Networking App Market Market by Marketplace, 2022 - 2033, USD Million
FIG 88 Nigeria Apple App Store Market, 2022 - 2033, USD Million
FIG 89 Nigeria Google Play Store Market, 2022 - 2033, USD Million
FIG 90 Nigeria Microsoft Store Market, 2022 - 2033, USD Million
FIG 91 Nigeria Other Marketplace Market, 2022 - 2033, USD Million
FIG 92 Nigeria Social Networking App Market Market by Revenue Source, 2022 - 2033, USD Million
FIG 93 Nigeria Advertising Market, 2022 - 2033, USD Million
FIG 94 Nigeria In-App Purchase Market, 2022 - 2033, USD Million
FIG 95 Nigeria Paid App Market, 2022 - 2033, USD Million
FIG 96 Rest of LAMEA Social Networking App Market Market, 2022 - 2033, USD Million
FIG 97 Rest of LAMEA Social Networking App Market Market by Device Type, 2022 - 2033, USD Million
FIG 98 Rest of LAMEA Other Device Type Market, 2022 - 2033, USD Million
FIG 99 Rest of LAMEA Smartphones Market, 2022 - 2033, USD Million
FIG 100 Rest of LAMEA Social Networking App Market Market by Marketplace, 2022 - 2033, USD Million
FIG 101 Rest of LAMEA Apple App Store Market, 2022 - 2033, USD Million
FIG 102 Rest of LAMEA Google Play Store Market, 2022 - 2033, USD Million
FIG 103 Rest of LAMEA Microsoft Store Market, 2022 - 2033, USD Million
FIG 104 Rest of LAMEA Other Marketplace Market, 2022 - 2033, USD Million
FIG 105 Rest of LAMEA Social Networking App Market Market by Revenue Source, 2022 - 2033, USD Million
FIG 106 Rest of LAMEA Advertising Market, 2022 - 2033, USD Million
FIG 107 Rest of LAMEA In-App Purchase Market, 2022 - 2033, USD Million
FIG 108 Rest of LAMEA Paid App Market, 2022 - 2033, USD Million