Europe Underground Cables Market Size, Share & Industry Analysis Report By Type (Low Voltage Cables, High Voltage Cables, and Medium Voltage Cables), By Installation (Direct Buried, Submarine, and Duct), By End Use (Utilities, Industrial, Commercial, and Residential), By Country Outlook and Forecast, 2026 - 2033
Published Date : 02-Sep-2026 |
Pages: 255 |
Report Format: PDF + Excel |
COVID-19 Impact on the Europe Underground Cables Market
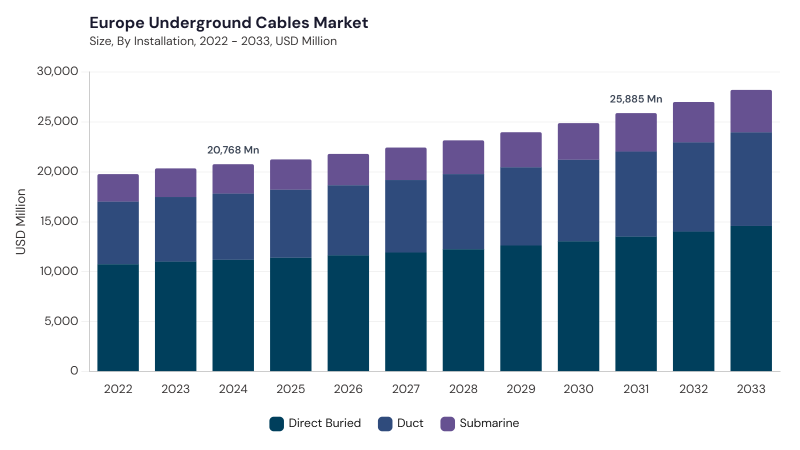
The Europe Underground Cables Market is expected to reach USD 25.9 billion by 2031, growing at a CAGR of 3.8% during (2026 – 2033).
The Europe Underground Cables Market developed alongside the expansion of power transmission systems, urban infrastructure, and industrial electrification across the continent. Early underground cabling was limited to dense cities where overhead lines were unsuitable due to space, safety, or visual concerns. Over time, improvements in insulation materials, jointing systems, accessories, and installation practices enabled underground cables to support higher voltage and more demanding grid applications. The transition from older rubber, lead, and paper-based insulation toward XLPE and EPR technologies improved durability, thermal performance, and reliability.
The Europe Underground Cables Market is being shaped by renewable energy integration, HVDC deployment, smart grid digitalization, urban planning policies, and demand for secure energy infrastructure. Offshore wind projects, decentralized power generation, and cross-border electricity exchange are increasing the need for high-capacity underground and submarine cable systems. Utilities are adopting real-time monitoring, digital diagnostics, AI-enabled mapping, and predictive maintenance to reduce outages and improve lifecycle management. Regulatory support for sustainability, safety, landscape protection, and resilient infrastructure is also encouraging replacement of overhead lines with underground alternatives.
Type Outlook
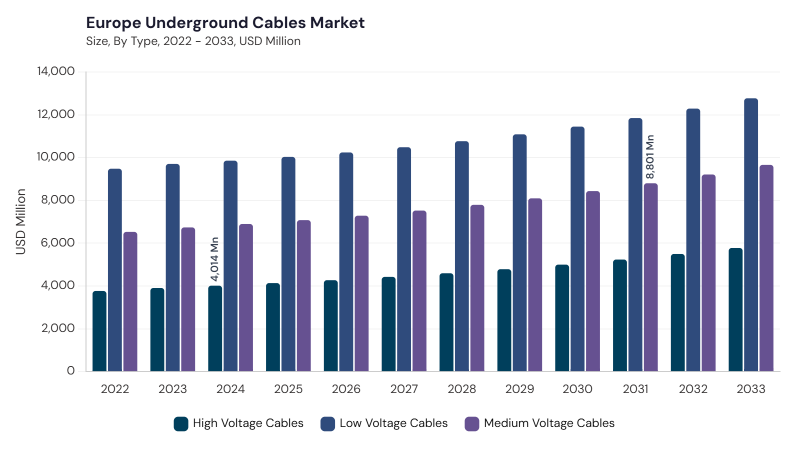
Based on Type, the market is segmented into Low Voltage Cables, Medium Voltage Cables, and High Voltage Cables. The Low Voltage Cables market dominated the Europe Underground Cables Market by Type in 2025, and would continue to be a dominant market till 2033; thereby, achieving a market value of USD 11.8 billion by 2031, growing at a CAGR of 3.2 % during the forecast period. The Medium Voltage Cables market is expected to witness a CAGR of 4.1% during (2026 - 2033). Additionally, The High Voltage Cables market is expected to witness highest CAGR of 4.4% during (2026 - 2033).
Low Voltage Cables lead due to broad use in residential electrification, urban infrastructure, smart buildings, public spaces, commercial facilities, and local power distribution. These cables support safe end-user power delivery while reducing visual impact and improving reliability in dense European cities. Medium Voltage Cables remain important for distribution grids, substations, industrial parks, hospitals, airports, rail systems, and renewable energy connections. High Voltage Cables hold a smaller but strategic role in cross-border interconnections, offshore wind transmission, long-distance grid reinforcement, and high-capacity HVDC projects.
Installation Outlook
Based on Installation, the market is segmented into Direct Buried, Duct, and Submarine. The Direct Buried market dominated the Europe Underground Cables Market by Installation in 2025, and would continue to be a dominant market till 2033; thereby, achieving a market value of USD 13.5 billion by 2031, growing at a CAGR of 3.3 % during the forecast period. The Duct market is expected to witness a CAGR of 4.2% during (2026 - 2033). Additionally, The Submarine market is expected to witness highest CAGR of 4.4% during (2026 - 2033).
Direct Buried installation leads due to its suitability for utility modernization, urban distribution networks, transport corridors, renewable links, and areas where efficient trench-based deployment is feasible. This method remains attractive where lower upfront infrastructure complexity and faster installation are priorities. Duct installation is gaining importance in metropolitan areas because it provides cable protection, easier replacement, future expansion capability, and improved long-term maintenance flexibility. Submarine installation represents a specialized segment, supported by offshore wind farms, subsea interconnectors, electricity exchange projects, and cross-border energy security initiatives.
End Use Outlook
Based on End Use, the market is segmented into Utilities, Residential, Industrial, and Commercial. Utilities lead due to grid modernization, transmission upgrades, renewable energy integration, smart grid deployment, energy security priorities, and replacement of aging overhead infrastructure. Utility operators require durable cables with strong insulation integrity, thermal resistance, fault tolerance, and compatibility with monitoring technologies.
Residential demand is supported by sustainable housing, smart meters, EV charging, rooftop solar, urban redevelopment, and underground distribution in new communities. Industrial and Commercial applications add demand through manufacturing sites, data centers, hospitals, transport terminals, offices, retail complexes, hotels, and smart commercial buildings requiring reliable underground power infrastructure.
Free Valuable Insights: The Worldwide Underground Cables Market is projected to reach USD 113.4 Billion billion by 2033, at a CAGR of 4.0%
Country Outlook
Based on Country, the market is segmented into Germany, UK, France, Russia, Spain, Italy, and Rest of Europe. The Germany market dominated the Europe Underground Cables Market by Country in 2025, and would continue to be a dominant market till 2033; thereby, achieving a market value of USD 4.9 billion by 2031, growing at a CAGR of 2.3 % during the forecast period. The UK market is expected to witness a CAGR of 2.8% during (2026 - 2033). Additionally, The France market is expected to witness a CAGR of 4.4% during (2026 - 2033).
Germany leads due to major HVDC corridors, offshore wind integration, XLPE cable deployment, renewable energy transmission needs, and strong grid modernization programs. The UK supports growth through renewable grid connections, smart cable monitoring, HVDC adoption, grid connection reforms, and undergrounding in urban and sensitive areas. France contributes through smart grid integration, underground fiber and power infrastructure, regulatory support, and demand for sustainable cable materials. Russia, Spain, and Italy add demand through smart grid modernization, renewable energy links, urban undergrounding, high-voltage cable adoption, and infrastructure security needs, while Rest of Europe benefits from cross-border interconnections and regional grid reinforcement.
List of Key Companies Profiled
- Prysmian Group
- Nexans S.A.
- NKT A/S
- Sumitomo Electric Industries, Ltd.
- LS Cable & System Ltd.
- Southwire Company, LLC
- Furukawa Electric Co., Ltd.
- Riyadh Cables Group Company
- Taihan Cable & Solution Co., Ltd.
- Hellenic Cables S.A.
Europe Underground Cables Market Report Segmentation
By Type
- Low Voltage Cables
- Medium Voltage Cables
- High Voltage Cables
By Installation
- Direct Buried
- Duct
- Submarine
By End Use
- Utilities
- Residential
- Industrial
- Commercial
By Country
- Germany
- UK
- France
- Russia
- Spain
- Italy
- Rest of Europe
1.1 Market Overview
1.2 Key Factors Impacting Market
1.2.1 Market Drivers
1.2.2 Market Restraints
1.2.3 Market Opportunities
1.2.4 Market Challenges
1.2.5 Market Trends
1.2.6 State of Competition
1.2.7 Market Consolidation
1.2.8 Key Customer Criteria
1.3 Product Life Cycle
1.4 Segmentation By Application
1.4.1 B2B
1.4.2 B2C
1.5 Segmentation By Source
1.5.1 Cashew
1.5.2 Soy
1.5.3 Coconut
1.5.4 Almond
1.5.5 Other Source
1.6 Segmentation By Product
1.6.1 Mozzarella
1.6.2 Cheddar
1.6.3 Cream Cheese
1.6.4 Parmesan
1.6.5 Ricotta
1.6.6 Other Product
1.7 Segmentation By Country
1.7.1 Germany
1.7.1.1 Segmentation By Application
1.7.1.1.1 B2B
1.7.1.1.2 B2C
1.7.1.2 Segmentation By Source
1.7.1.2.1 Cashew
1.7.1.2.2 Soy
1.7.1.2.3 Coconut
1.7.1.2.4 Almond
1.7.1.2.5 Other Source
1.7.1.3 Segmentation By Product
1.7.1.3.1 Mozzarella
1.7.1.3.2 Cheddar
1.7.1.3.3 Cream Cheese
1.7.1.3.4 Parmesan
1.7.1.3.5 Ricotta
1.7.1.3.6 Other Product
1.7.2 UK
1.7.2.1 Segmentation By Application
1.7.2.1.1 B2B
1.7.2.1.2 B2C
1.7.2.2 Segmentation By Source
1.7.2.2.1 Cashew
1.7.2.2.2 Soy
1.7.2.2.3 Coconut
1.7.2.2.4 Almond
1.7.2.2.5 Other Source
1.7.2.3 Segmentation By Product
1.7.2.3.1 Mozzarella
1.7.2.3.2 Cheddar
1.7.2.3.3 Cream Cheese
1.7.2.3.4 Parmesan
1.7.2.3.5 Ricotta
1.7.2.3.6 Other Product
1.7.3 France
1.7.3.1 Segmentation By Application
1.7.3.1.1 B2B
1.7.3.1.2 B2C
1.7.3.2 Segmentation By Source
1.7.3.2.1 Cashew
1.7.3.2.2 Soy
1.7.3.2.3 Coconut
1.7.3.2.4 Almond
1.7.3.2.5 Other Source
1.7.3.3 Segmentation By Product
1.7.3.3.1 Mozzarella
1.7.3.3.2 Cheddar
1.7.3.3.3 Cream Cheese
1.7.3.3.4 Parmesan
1.7.3.3.5 Ricotta
1.7.3.3.6 Other Product
1.7.4 Russia
1.7.4.1 Segmentation By Application
1.7.4.1.1 B2B
1.7.4.1.2 B2C
1.7.4.2 Segmentation By Source
1.7.4.2.1 Cashew
1.7.4.2.2 Soy
1.7.4.2.3 Coconut
1.7.4.2.4 Almond
1.7.4.2.5 Other Source
1.7.4.3 Segmentation By Product
1.7.4.3.1 Mozzarella
1.7.4.3.2 Cheddar
1.7.4.3.3 Cream Cheese
1.7.4.3.4 Parmesan
1.7.4.3.5 Ricotta
1.7.4.3.6 Other Product
1.7.5 Spain
1.7.5.1 Segmentation By Application
1.7.5.1.1 B2B
1.7.5.1.2 B2C
1.7.5.2 Segmentation By Source
1.7.5.2.1 Cashew
1.7.5.2.2 Soy
1.7.5.2.3 Coconut
1.7.5.2.4 Almond
1.7.5.2.5 Other Source
1.7.5.3 Segmentation By Product
1.7.5.3.1 Mozzarella
1.7.5.3.2 Cheddar
1.7.5.3.3 Cream Cheese
1.7.5.3.4 Parmesan
1.7.5.3.5 Ricotta
1.7.5.3.6 Other Product
1.7.6 Italy
1.7.6.1 Segmentation By Application
1.7.6.1.1 B2B
1.7.6.1.2 B2C
1.7.6.2 Segmentation By Source
1.7.6.2.1 Cashew
1.7.6.2.2 Soy
1.7.6.2.3 Coconut
1.7.6.2.4 Almond
1.7.6.2.5 Other Source
1.7.6.3 Segmentation By Product
1.7.6.3.1 Mozzarella
1.7.6.3.2 Cheddar
1.7.6.3.3 Cream Cheese
1.7.6.3.4 Parmesan
1.7.6.3.5 Ricotta
1.7.6.3.6 Other Product
1.7.7 Rest of Europe
1.7.7.1 Segmentation By Application
1.7.7.1.1 B2B
1.7.7.1.2 B2C
1.7.7.2 Segmentation By Source
1.7.7.2.1 Cashew
1.7.7.2.2 Soy
1.7.7.2.3 Coconut
1.7.7.2.4 Almond
1.7.7.2.5 Other Source
1.7.7.3 Segmentation By Product
1.7.7.3.1 Mozzarella
1.7.7.3.2 Cheddar
1.7.7.3.3 Cream Cheese
1.7.7.3.4 Parmesan
1.7.7.3.5 Ricotta
1.7.7.3.6 Other Product
Chapter 2. Company Snapshots
2.1 Upfield B.V.
2.1.1 Business Overview
2.1.2 Key Information
2.1.3 Company Focus on Vegan Cheese Market
2.1.4 Strategic Insights
2.1.5 Strategy Deployed
2.1.6 Product & Service Portfolio
2.1.7 Capability Overview
2.1.8 Technology & Innovation Focus
2.1.9 SWOT Analysis
2.1.10 Customers / End Users
2.1.11 Competitive Positioning
2.1.12 Key Differentiators
2.1.13 Portfolio Matrix
2.1.14 Analyst View
2.1.15 Future Outlook
2.2 Otsuka Holdings Co., Ltd.
2.2.1 Business Overview
2.2.2 Key Information
2.2.3 Company Focus on Vegan Cheese Market
2.2.4 Strategic Insights
2.2.5 Strategy Deployed
2.2.6 Product & Service Portfolio
2.2.7 Capability Overview
2.2.8 Technology & Innovation Focus
2.2.9 SWOT Analysis
2.2.10 Customers / End Users
2.2.11 Competitive Positioning
2.2.12 Key Differentiators
2.2.13 Portfolio Matrix
2.2.14 Analyst View
2.2.15 Future Outlook
2.3 Danone S.A.
2.3.1 Business Overview
2.3.2 Key Information
2.3.3 Company Focus on Vegan Cheese Market
2.3.4 Strategic Insights
2.3.5 Strategy Deployed
2.3.6 Product & Service Portfolio
2.3.7 Capability Overview
2.3.8 Technology & Innovation Focus
2.3.9 SWOT Analysis
2.3.10 Customers / End Users
2.3.11 Competitive Positioning
2.3.12 Key Differentiators
2.3.13 Portfolio Matrix
2.3.14 Analyst View
2.3.15 Future Outlook
2.4 Bel Group
2.4.1 Business Overview
2.4.2 Key Information
2.4.3 Company Focus on Vegan Cheese Market
2.4.4 Strategic Insights
2.4.5 Strategy Deployed
2.4.6 Product & Service Portfolio
2.4.7 Capability Overview
2.4.8 Technology & Innovation Focus
2.4.9 SWOT Analysis
2.4.10 Customers / End Users
2.4.11 Competitive Positioning
2.4.12 Key Differentiators
2.4.13 Portfolio Matrix
2.4.14 Analyst View
2.4.15 Future Outlook
2.5 Maple Leaf Foods Inc.
2.5.1 Business Overview
2.5.2 Company Focus on Vegan Cheese Market
2.5.3 Strategic Insights
2.5.4 Strategy Deployed
2.5.5 Product & Service Portfolio
2.5.6 Capability Overview
2.5.7 Technology & Innovation Focus
2.5.8 SWOT Analysis
2.5.9 Customers / End Users
2.5.10 Competitive Positioning
2.5.11 Key Differentiators
2.5.12 Portfolio Matrix
2.5.13 Analyst View
2.5.14 Future Outlook
2.6 Hochland SE
2.6.1 Business Overview
2.6.2 Key Information
2.6.3 Company Focus on Vegan Cheese Market
2.6.4 Strategic Insights
2.6.5 Strategy Deployed
2.6.6 Product & Service Portfolio
2.6.7 Capability Overview
2.6.8 Technology & Innovation Focus
2.6.9 SWOT Analysis
2.6.10 Customers / End Users
2.6.11 Competitive Positioning
2.6.12 Key Differentiators
2.6.13 Portfolio Matrix
2.6.14 Analyst View
2.6.15 Future Outlook 2.7 Saputo Inc.
2.7.1 Business Overview
2.7.2 Key Information
2.7.3 Company Focus on Vegan Cheese Market
2.7.4 Strategic Insights
2.7.5 Strategy Deployed
2.7.6 Product & Service Portfolio
2.7.7 Capability Overview
2.7.8 Technology & Innovation Focus
2.7.9 SWOT Analysis
2.7.10 Customers / End Users
2.7.11 Competitive Positioning
2.7.12 Key Differentiators
2.7.13 Portfolio Matrix
2.7.14 Analyst View
2.7.15 Future Outlook
2.8 Miyoko's Creamery
2.8.1 Business Overview
2.8.2 Key Information
2.8.3 Company Focus on Vegan Cheese Market
2.8.4 Strategic Insights
2.8.5 Strategy Deployed
2.8.6 Product & Service Portfolio
2.8.7 Capability Overview
2.8.8 Technology & Innovation Focus
2.8.9 SWOT Analysis
2.8.10 Customers / End Users
2.8.11 Competitive Positioning
2.8.12 Key Differentiators
2.8.13 Portfolio Matrix
2.8.14 Analyst View
2.8.15 Future Outlook
2.9 Kite Hill
2.9.1 Business Overview
2.9.2 Key Information
2.9.3 Company Focus on Vegan Cheese Market
2.9.4 Strategic Insights
2.9.5 Strategy Deployed
2.9.6 Product & Service Portfolio
2.9.7 Capability Overview
2.9.8 Technology & Innovation Focus
2.9.9 SWOT Analysis
2.9.10 Customers / End Users
2.9.11 Competitive Positioning
2.9.12 Key Differentiators
2.9.13 Portfolio Matrix
2.9.14 Analyst View
2.9.15 Future Outlook
2.10 Tofutti Brands Inc.
2.10.1 Business Overview
2.10.2 Key Information
2.10.3 Company Focus on Vegan Cheese Market
2.10.4 Strategic Insights
2.10.5 Strategy Deployed
2.10.6 Product & Service Portfolio
2.10.7 Capability Overview
2.10.8 Technology & Innovation Focus
2.10.9 SWOT Analysis
2.10.10 Customers / End Users
2.10.11 Competitive Positioning
2.10.12 Key Differentiators
2.10.13 Portfolio Matrix
2.10.14 Analyst View
2.10.15 Future Outlook
Table 1 Europe Vegan Cheese Market Market, 2022 - 2033, USD Million
Table 2 Europe Vegan Cheese Market Market by Application, 2022 - 2033, USD Million
Table 3 Europe B2B Market, 2022 - 2033, USD Million
Table 4 Europe B2C Market, 2022 - 2033, USD Million
Table 5 Europe Vegan Cheese Market Market by Product, 2022 - 2033, USD Million
Table 6 Europe Cheddar Market, 2022 - 2033, USD Million
Table 7 Europe Cream Cheese Market, 2022 - 2033, USD Million
Table 8 Europe Mozzarella Market, 2022 - 2033, USD Million
Table 9 Europe Other Product Market, 2022 - 2033, USD Million
Table 10 Europe Parmesan Market, 2022 - 2033, USD Million
Table 11 Europe Ricotta Market, 2022 - 2033, USD Million
Table 12 Europe Vegan Cheese Market Market by Source, 2022 - 2033, USD Million
Table 13 Europe Almond Market, 2022 - 2033, USD Million
Table 14 Europe Cashew Market, 2022 - 2033, USD Million
Table 15 Europe Coconut Market, 2022 - 2033, USD Million
Table 16 Europe Other Source Market, 2022 - 2033, USD Million
Table 17 Europe Soy Market, 2022 - 2033, USD Million
Table 18 Germany Vegan Cheese Market Market, 2022 - 2033, USD Million
Table 19 Germany Vegan Cheese Market Market by Application, 2022 - 2033, USD Million
Table 20 Germany B2B Market, 2022 - 2033, USD Million
Table 21 Germany B2C Market, 2022 - 2033, USD Million
Table 22 Germany Vegan Cheese Market Market by Product, 2022 - 2033, USD Million
Table 23 Germany Cheddar Market, 2022 - 2033, USD Million
Table 24 Germany Cream Cheese Market, 2022 - 2033, USD Million
Table 25 Germany Mozzarella Market, 2022 - 2033, USD Million
Table 26 Germany Other Product Market, 2022 - 2033, USD Million
Table 27 Germany Parmesan Market, 2022 - 2033, USD Million
Table 28 Germany Ricotta Market, 2022 - 2033, USD Million
Table 29 Germany Vegan Cheese Market Market by Source, 2022 - 2033, USD Million
Table 30 Germany Almond Market, 2022 - 2033, USD Million
Table 31 Germany Cashew Market, 2022 - 2033, USD Million
Table 32 Germany Coconut Market, 2022 - 2033, USD Million
Table 33 Germany Other Source Market, 2022 - 2033, USD Million
Table 34 Germany Soy Market, 2022 - 2033, USD Million
Table 35 United Kingdom Vegan Cheese Market Market, 2022 - 2033, USD Million
Table 36 United Kingdom Vegan Cheese Market Market by Application, 2022 - 2033, USD Million
Table 37 United Kingdom B2B Market, 2022 - 2033, USD Million
Table 38 United Kingdom B2C Market, 2022 - 2033, USD Million
Table 39 United Kingdom Vegan Cheese Market Market by Product, 2022 - 2033, USD Million
Table 40 United Kingdom Cheddar Market, 2022 - 2033, USD Million
Table 41 United Kingdom Cream Cheese Market, 2022 - 2033, USD Million
Table 42 United Kingdom Mozzarella Market, 2022 - 2033, USD Million
Table 43 United Kingdom Other Product Market, 2022 - 2033, USD Million
Table 44 United Kingdom Parmesan Market, 2022 - 2033, USD Million
Table 45 United Kingdom Ricotta Market, 2022 - 2033, USD Million
Table 46 United Kingdom Vegan Cheese Market Market by Source, 2022 - 2033, USD Million
Table 47 United Kingdom Almond Market, 2022 - 2033, USD Million
Table 48 United Kingdom Cashew Market, 2022 - 2033, USD Million
Table 49 United Kingdom Coconut Market, 2022 - 2033, USD Million
Table 50 United Kingdom Other Source Market, 2022 - 2033, USD Million
Table 51 United Kingdom Soy Market, 2022 - 2033, USD Million
Table 52 France Vegan Cheese Market Market, 2022 - 2033, USD Million
Table 53 France Vegan Cheese Market Market by Application, 2022 - 2033, USD Million
Table 54 France B2B Market, 2022 - 2033, USD Million
Table 55 France B2C Market, 2022 - 2033, USD Million
Table 56 France Vegan Cheese Market Market by Product, 2022 - 2033, USD Million
Table 57 France Cheddar Market, 2022 - 2033, USD Million
Table 58 France Cream Cheese Market, 2022 - 2033, USD Million
Table 59 France Mozzarella Market, 2022 - 2033, USD Million
Table 60 France Other Product Market, 2022 - 2033, USD Million
Table 61 France Parmesan Market, 2022 - 2033, USD Million
Table 62 France Ricotta Market, 2022 - 2033, USD Million
Table 63 France Vegan Cheese Market Market by Source, 2022 - 2033, USD Million
Table 64 France Almond Market, 2022 - 2033, USD Million
Table 65 France Cashew Market, 2022 - 2033, USD Million
Table 66 France Coconut Market, 2022 - 2033, USD Million
Table 67 France Other Source Market, 2022 - 2033, USD Million
Table 68 France Soy Market, 2022 - 2033, USD Million
Table 69 Russia Vegan Cheese Market Market, 2022 - 2033, USD Million
Table 70 Russia Vegan Cheese Market Market by Application, 2022 - 2033, USD Million
Table 71 Russia B2B Market, 2022 - 2033, USD Million
Table 72 Russia B2C Market, 2022 - 2033, USD Million
Table 73 Russia Vegan Cheese Market Market by Product, 2022 - 2033, USD Million
Table 74 Russia Cheddar Market, 2022 - 2033, USD Million
Table 75 Russia Cream Cheese Market, 2022 - 2033, USD Million
Table 76 Russia Mozzarella Market, 2022 - 2033, USD Million
Table 77 Russia Other Product Market, 2022 - 2033, USD Million
Table 78 Russia Parmesan Market, 2022 - 2033, USD Million
Table 79 Russia Ricotta Market, 2022 - 2033, USD Million
Table 80 Russia Vegan Cheese Market Market by Source, 2022 - 2033, USD Million
Table 81 Russia Almond Market, 2022 - 2033, USD Million
Table 82 Russia Cashew Market, 2022 - 2033, USD Million
Table 83 Russia Coconut Market, 2022 - 2033, USD Million
Table 84 Russia Other Source Market, 2022 - 2033, USD Million
Table 85 Russia Soy Market, 2022 - 2033, USD Million
Table 86 Spain Vegan Cheese Market Market, 2022 - 2033, USD Million
Table 87 Spain Vegan Cheese Market Market by Application, 2022 - 2033, USD Million
Table 88 Spain B2B Market, 2022 - 2033, USD Million
Table 89 Spain B2C Market, 2022 - 2033, USD Million
Table 90 Spain Vegan Cheese Market Market by Product, 2022 - 2033, USD Million
Table 91 Spain Cheddar Market, 2022 - 2033, USD Million
Table 92 Spain Cream Cheese Market, 2022 - 2033, USD Million
Table 93 Spain Mozzarella Market, 2022 - 2033, USD Million
Table 94 Spain Other Product Market, 2022 - 2033, USD Million
Table 95 Spain Parmesan Market, 2022 - 2033, USD Million
Table 96 Spain Ricotta Market, 2022 - 2033, USD Million
Table 97 Spain Vegan Cheese Market Market by Source, 2022 - 2033, USD Million
Table 98 Spain Almond Market, 2022 - 2033, USD Million
Table 99 Spain Cashew Market, 2022 - 2033, USD Million
Table 100 Spain Coconut Market, 2022 - 2033, USD Million
Table 101 Spain Other Source Market, 2022 - 2033, USD Million
Table 102 Spain Soy Market, 2022 - 2033, USD Million
Table 103 Italy Vegan Cheese Market Market, 2022 - 2033, USD Million
Table 104 Italy Vegan Cheese Market Market by Application, 2022 - 2033, USD Million
Table 105 Italy B2B Market, 2022 - 2033, USD Million
Table 106 Italy B2C Market, 2022 - 2033, USD Million
Table 107 Italy Vegan Cheese Market Market by Product, 2022 - 2033, USD Million
Table 108 Italy Cheddar Market, 2022 - 2033, USD Million
Table 109 Italy Cream Cheese Market, 2022 - 2033, USD Million
Table 110 Italy Mozzarella Market, 2022 - 2033, USD Million
Table 111 Italy Other Product Market, 2022 - 2033, USD Million
Table 112 Italy Parmesan Market, 2022 - 2033, USD Million
Table 113 Italy Ricotta Market, 2022 - 2033, USD Million
Table 114 Italy Vegan Cheese Market Market by Source, 2022 - 2033, USD Million
Table 115 Italy Almond Market, 2022 - 2033, USD Million
Table 116 Italy Cashew Market, 2022 - 2033, USD Million
Table 117 Italy Coconut Market, 2022 - 2033, USD Million
Table 118 Italy Other Source Market, 2022 - 2033, USD Million
Table 119 Italy Soy Market, 2022 - 2033, USD Million
Table 120 Rest of Europe Vegan Cheese Market Market, 2022 - 2033, USD Million
Table 121 Rest of Europe Vegan Cheese Market Market by Application, 2022 - 2033, USD Million
Table 122 Rest of Europe B2B Market, 2022 - 2033, USD Million
Table 123 Rest of Europe B2C Market, 2022 - 2033, USD Million
Table 124 Rest of Europe Vegan Cheese Market Market by Product, 2022 - 2033, USD Million
Table 125 Rest of Europe Cheddar Market, 2022 - 2033, USD Million
Table 126 Rest of Europe Cream Cheese Market, 2022 - 2033, USD Million
Table 127 Rest of Europe Mozzarella Market, 2022 - 2033, USD Million
Table 128 Rest of Europe Other Product Market, 2022 - 2033, USD Million
Table 129 Rest of Europe Parmesan Market, 2022 - 2033, USD Million
Table 130 Rest of Europe Ricotta Market, 2022 - 2033, USD Million
Table 131 Rest of Europe Vegan Cheese Market Market by Source, 2022 - 2033, USD Million
Table 132 Rest of Europe Almond Market, 2022 - 2033, USD Million
Table 133 Rest of Europe Cashew Market, 2022 - 2033, USD Million
Table 134 Rest of Europe Coconut Market, 2022 - 2033, USD Million
Table 135 Rest of Europe Other Source Market, 2022 - 2033, USD Million
Table 136 Rest of Europe Soy Market, 2022 - 2033, USD Million
List of Figures
FIG 1 Key Factors Impacting Market
FIG 2 Market Consolidation
FIG 3 Key Customer Criteria
FIG 4 Product Life Cycle
FIG 5 Europe Vegan Cheese Market Market, 2022 - 2033, USD Million
FIG 6 Europe Vegan Cheese Market Market by Application, 2022 - 2033, USD Million
FIG 7 Europe B2B Market, 2022 - 2033, USD Million
FIG 8 Europe B2C Market, 2022 - 2033, USD Million
FIG 9 Europe Vegan Cheese Market Market by Product, 2022 - 2033, USD Million
FIG 10 Europe Cheddar Market, 2022 - 2033, USD Million
FIG 11 Europe Cream Cheese Market, 2022 - 2033, USD Million
FIG 12 Europe Mozzarella Market, 2022 - 2033, USD Million
FIG 13 Europe Other Product Market, 2022 - 2033, USD Million
FIG 14 Europe Parmesan Market, 2022 - 2033, USD Million
FIG 15 Europe Ricotta Market, 2022 - 2033, USD Million
FIG 16 Europe Vegan Cheese Market Market by Source, 2022 - 2033, USD Million
FIG 17 Europe Almond Market, 2022 - 2033, USD Million
FIG 18 Europe Cashew Market, 2022 - 2033, USD Million
FIG 19 Europe Coconut Market, 2022 - 2033, USD Million
FIG 20 Europe Other Source Market, 2022 - 2033, USD Million
FIG 21 Europe Soy Market, 2022 - 2033, USD Million
FIG 22 Germany Vegan Cheese Market Market, 2022 - 2033, USD Million
FIG 23 Germany Vegan Cheese Market Market by Application, 2022 - 2033, USD Million
FIG 24 Germany B2B Market, 2022 - 2033, USD Million
FIG 25 Germany B2C Market, 2022 - 2033, USD Million
FIG 26 Germany Vegan Cheese Market Market by Product, 2022 - 2033, USD Million
FIG 27 Germany Cheddar Market, 2022 - 2033, USD Million
FIG 28 Germany Cream Cheese Market, 2022 - 2033, USD Million
FIG 29 Germany Mozzarella Market, 2022 - 2033, USD Million
FIG 30 Germany Other Product Market, 2022 - 2033, USD Million
FIG 31 Germany Parmesan Market, 2022 - 2033, USD Million
FIG 32 Germany Ricotta Market, 2022 - 2033, USD Million
FIG 33 Germany Vegan Cheese Market Market by Source, 2022 - 2033, USD Million
FIG 34 Germany Almond Market, 2022 - 2033, USD Million
FIG 35 Germany Cashew Market, 2022 - 2033, USD Million
FIG 36 Germany Coconut Market, 2022 - 2033, USD Million
FIG 37 Germany Other Source Market, 2022 - 2033, USD Million
FIG 38 Germany Soy Market, 2022 - 2033, USD Million
FIG 39 United Kingdom Vegan Cheese Market Market, 2022 - 2033, USD Million
FIG 40 United Kingdom Vegan Cheese Market Market by Application, 2022 - 2033, USD Million
FIG 41 United Kingdom B2B Market, 2022 - 2033, USD Million
FIG 42 United Kingdom B2C Market, 2022 - 2033, USD Million
FIG 43 United Kingdom Vegan Cheese Market Market by Product, 2022 - 2033, USD Million
FIG 44 United Kingdom Cheddar Market, 2022 - 2033, USD Million
FIG 45 United Kingdom Cream Cheese Market, 2022 - 2033, USD Million
FIG 46 United Kingdom Mozzarella Market, 2022 - 2033, USD Million
FIG 47 United Kingdom Other Product Market, 2022 - 2033, USD Million
FIG 48 United Kingdom Parmesan Market, 2022 - 2033, USD Million
FIG 49 United Kingdom Ricotta Market, 2022 - 2033, USD Million
FIG 50 United Kingdom Vegan Cheese Market Market by Source, 2022 - 2033, USD Million
FIG 51 United Kingdom Almond Market, 2022 - 2033, USD Million
FIG 52 United Kingdom Cashew Market, 2022 - 2033, USD Million
FIG 53 United Kingdom Coconut Market, 2022 - 2033, USD Million
FIG 54 United Kingdom Other Source Market, 2022 - 2033, USD Million
FIG 55 United Kingdom Soy Market, 2022 - 2033, USD Million
FIG 56 France Vegan Cheese Market Market, 2022 - 2033, USD Million
FIG 57 France Vegan Cheese Market Market by Application, 2022 - 2033, USD Million
FIG 58 France B2B Market, 2022 - 2033, USD Million
FIG 59 France B2C Market, 2022 - 2033, USD Million
FIG 60 France Vegan Cheese Market Market by Product, 2022 - 2033, USD Million
FIG 61 France Cheddar Market, 2022 - 2033, USD Million
FIG 62 France Cream Cheese Market, 2022 - 2033, USD Million
FIG 63 France Mozzarella Market, 2022 - 2033, USD Million
FIG 64 France Other Product Market, 2022 - 2033, USD Million
FIG 65 France Parmesan Market, 2022 - 2033, USD Million
FIG 66 France Ricotta Market, 2022 - 2033, USD Million
FIG 67 France Vegan Cheese Market Market by Source, 2022 - 2033, USD Million
FIG 68 France Almond Market, 2022 - 2033, USD Million
FIG 69 France Cashew Market, 2022 - 2033, USD Million
FIG 70 France Coconut Market, 2022 - 2033, USD Million
FIG 71 France Other Source Market, 2022 - 2033, USD Million
FIG 72 France Soy Market, 2022 - 2033, USD Million
FIG 73 Russia Vegan Cheese Market Market, 2022 - 2033, USD Million
FIG 74 Russia Vegan Cheese Market Market by Application, 2022 - 2033, USD Million
FIG 75 Russia B2B Market, 2022 - 2033, USD Million
FIG 76 Russia B2C Market, 2022 - 2033, USD Million
FIG 77 Russia Vegan Cheese Market Market by Product, 2022 - 2033, USD Million
FIG 78 Russia Cheddar Market, 2022 - 2033, USD Million
FIG 79 Russia Cream Cheese Market, 2022 - 2033, USD Million
FIG 80 Russia Mozzarella Market, 2022 - 2033, USD Million
FIG 81 Russia Other Product Market, 2022 - 2033, USD Million
FIG 82 Russia Parmesan Market, 2022 - 2033, USD Million
FIG 83 Russia Ricotta Market, 2022 - 2033, USD Million
FIG 84 Russia Vegan Cheese Market Market by Source, 2022 - 2033, USD Million
FIG 85 Russia Almond Market, 2022 - 2033, USD Million
FIG 86 Russia Cashew Market, 2022 - 2033, USD Million
FIG 87 Russia Coconut Market, 2022 - 2033, USD Million
FIG 88 Russia Other Source Market, 2022 - 2033, USD Million
FIG 89 Russia Soy Market, 2022 - 2033, USD Million
FIG 90 Spain Vegan Cheese Market Market, 2022 - 2033, USD Million
FIG 91 Spain Vegan Cheese Market Market by Application, 2022 - 2033, USD Million
FIG 92 Spain B2B Market, 2022 - 2033, USD Million
FIG 93 Spain B2C Market, 2022 - 2033, USD Million
FIG 94 Spain Vegan Cheese Market Market by Product, 2022 - 2033, USD Million
FIG 95 Spain Cheddar Market, 2022 - 2033, USD Million
FIG 96 Spain Cream Cheese Market, 2022 - 2033, USD Million
FIG 97 Spain Mozzarella Market, 2022 - 2033, USD Million
FIG 98 Spain Other Product Market, 2022 - 2033, USD Million
FIG 99 Spain Parmesan Market, 2022 - 2033, USD Million
FIG 100 Spain Ricotta Market, 2022 - 2033, USD Million
FIG 101 Spain Vegan Cheese Market Market by Source, 2022 - 2033, USD Million
FIG 102 Spain Almond Market, 2022 - 2033, USD Million
FIG 103 Spain Cashew Market, 2022 - 2033, USD Million
FIG 104 Spain Coconut Market, 2022 - 2033, USD Million
FIG 105 Spain Other Source Market, 2022 - 2033, USD Million
FIG 106 Spain Soy Market, 2022 - 2033, USD Million FIG 107 Italy Vegan Cheese Market Market, 2022 - 2033, USD Million
FIG 108 Italy Vegan Cheese Market Market by Application, 2022 - 2033, USD Million
FIG 109 Italy B2B Market, 2022 - 2033, USD Million
FIG 110 Italy B2C Market, 2022 - 2033, USD Million
FIG 111 Italy Vegan Cheese Market Market by Product, 2022 - 2033, USD Million
FIG 112 Italy Cheddar Market, 2022 - 2033, USD Million
FIG 113 Italy Cream Cheese Market, 2022 - 2033, USD Million
FIG 114 Italy Mozzarella Market, 2022 - 2033, USD Million
FIG 115 Italy Other Product Market, 2022 - 2033, USD Million
FIG 116 Italy Parmesan Market, 2022 - 2033, USD Million
FIG 117 Italy Ricotta Market, 2022 - 2033, USD Million
FIG 118 Italy Vegan Cheese Market Market by Source, 2022 - 2033, USD Million
FIG 119 Italy Almond Market, 2022 - 2033, USD Million
FIG 120 Italy Cashew Market, 2022 - 2033, USD Million
FIG 121 Italy Coconut Market, 2022 - 2033, USD Million
FIG 122 Italy Other Source Market, 2022 - 2033, USD Million
FIG 123 Italy Soy Market, 2022 - 2033, USD Million
FIG 124 Rest of Europe Vegan Cheese Market Market, 2022 - 2033, USD Million
FIG 125 Rest of Europe Vegan Cheese Market Market by Application, 2022 - 2033, USD Million
FIG 126 Rest of Europe B2B Market, 2022 - 2033, USD Million
FIG 127 Rest of Europe B2C Market, 2022 - 2033, USD Million
FIG 128 Rest of Europe Vegan Cheese Market Market by Product, 2022 - 2033, USD Million
FIG 129 Rest of Europe Cheddar Market, 2022 - 2033, USD Million
FIG 130 Rest of Europe Cream Cheese Market, 2022 - 2033, USD Million
FIG 131 Rest of Europe Mozzarella Market, 2022 - 2033, USD Million
FIG 132 Rest of Europe Other Product Market, 2022 - 2033, USD Million
FIG 133 Rest of Europe Parmesan Market, 2022 - 2033, USD Million
FIG 134 Rest of Europe Ricotta Market, 2022 - 2033, USD Million
FIG 135 Rest of Europe Vegan Cheese Market Market by Source, 2022 - 2033, USD Million
FIG 136 Rest of Europe Almond Market, 2022 - 2033, USD Million
FIG 137 Rest of Europe Cashew Market, 2022 - 2033, USD Million
FIG 138 Rest of Europe Coconut Market, 2022 - 2033, USD Million
FIG 139 Rest of Europe Other Source Market, 2022 - 2033, USD Million
FIG 140 Rest of Europe Soy Market, 2022 - 2033, USD Million