Asia Pacific Voice User Interface Market Size, Share & Industry Analysis Report By Offering (Solution, and Services), By Application (Smartphones & Tablets, Voice-controlled Devices, Interactive Voice Response, and Smart Speakers), By Vertical (Consumer Electronics, and Retail & E-commerce), By Country Outlook and Forecast, 2026 - 2033
Published Date : 02-Sep-2026 |
Pages: 309 |
Report Format: PDF + Excel |
COVID-19 Impact on the Asia Pacific Voice User Interface Market
The Asia Pacific Voice User Interface Market is expected to reach USD 28.7 billion by 2030, growing at a CAGR of 21.4% during (2026 – 2033).
The Asia Pacific Voice User Interface Market developed from early speech recognition and command-based systems used in telecom, mobile devices, call centers, and automotive applications. Early adoption was limited by language complexity, lower recognition accuracy, infrastructure gaps, and limited support for regional dialects. Over time, advances in artificial intelligence, natural language processing, cloud computing, and machine learning improved the ability of voice systems to interpret contextual commands and local speech patterns. The rapid growth of smartphones, smart speakers, IoT devices, and digital services shifted voice interfaces from basic control tools into mainstream interaction platforms.
The Asia Pacific Voice User Interface Market is being shaped by smartphone adoption, smart home expansion, digital commerce, AIaaS platforms, customer experience modernization, and rising demand for hands-free interaction. Organizations are using VUI solutions to support voice search, digital assistants, banking services, customer support automation, connected vehicle control, healthcare communication, and public service delivery. Demand is supported by mobile internet growth, regional language adoption, smart city programs, enterprise cloud migration, and expanding use of conversational AI in customer-facing operations. Vendors are focusing on multilingual recognition, dialect sensitivity, contextual understanding, voice biometrics, secure data handling, edge processing, and ecosystem partnerships.
Offering Outlook
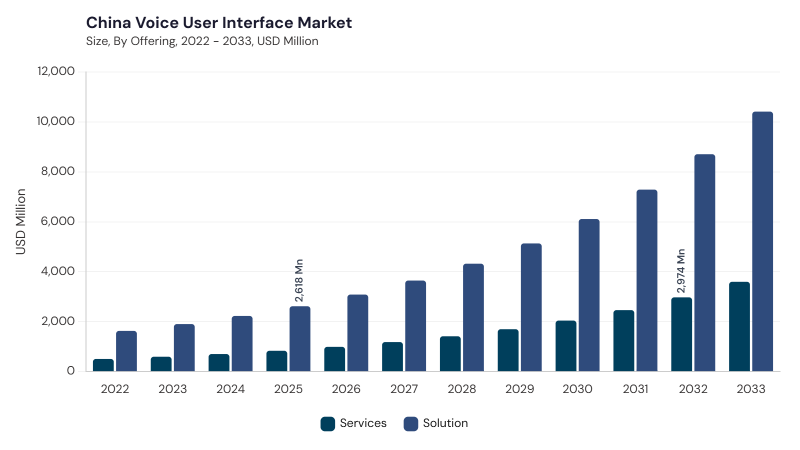
Based on Offering, the market is segmented into Solutions and Services. The Solution market dominated the Asia Pacific Voice User Interface Market by Offering in 2025, and would continue to be a dominant market till 2033; thereby, achieving a market value of USD 21.6 billion by 2030, growing at a CAGR of 21.1 % during the forecast period. The Services market is expected to witness a CAGR of 22.3% during (2026 - 2033).
Solutions lead due to rapid deployment of speech recognition engines, natural language processing platforms, voice synthesis modules, embedded voice assistants, and conversational AI tools across consumer and enterprise applications. These solutions enable mobile voice assistants, smart home control, voice commerce, in-vehicle interaction, customer support automation, and digital banking services. Services remain important as organizations require consulting, implementation, localization, system integration, managed services, and continuous optimization. Service providers also help enterprises adapt VUI platforms to regional languages, dialects, privacy regulations, existing IT systems, customer engagement workflows, and industry-specific requirements.
Application Outlook
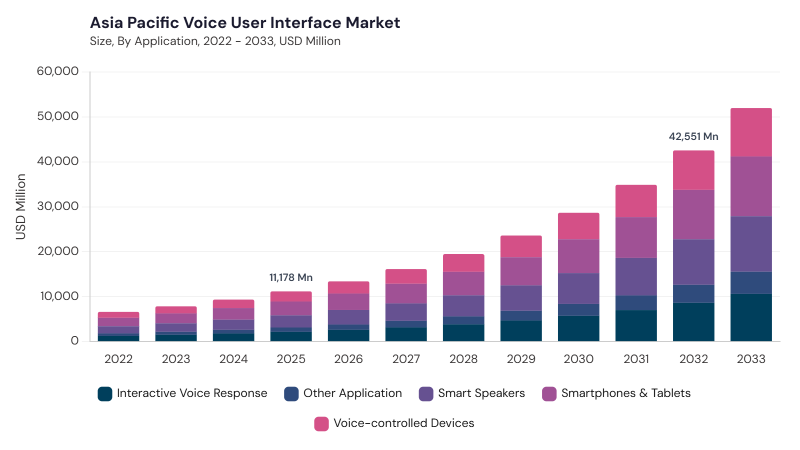
Based on Application, the market is segmented into Smartphones & Tablets, Smart Speakers, Voice-controlled Devices, Interactive Voice Response, and Other Application. The Smartphones & Tablets market dominated the Asia Pacific Voice User Interface Market by Application in 2025, and would continue to be a dominant market till 2033; thereby, achieving a market value of USD 7.5 billion by 2030, growing at a CAGR of 20.2 % during the forecast period. The Smart Speakers market is expected to witness a CAGR of 21.1% during (2026 - 2033). Additionally, The Voice-controlled Devices market is expected to witness highest CAGR of 21.8% during (2026 - 2033).
Smartphones & Tablets lead due to rising mobile internet usage and the frequent use of voice assistants for search, navigation, messaging, entertainment, digital services, and accessibility. These devices act as the main entry point for voice interaction across both developed and emerging Asia Pacific economies. Smart Speakers continue to gain demand as urban households adopt voice-enabled entertainment, smart home control, information access, and daily task automation. Voice-controlled Devices, Interactive Voice Response, and Other Application areas add demand through wearables, connected vehicles, IoT appliances, AI-enabled call management, education platforms, healthcare tools, public service systems, and industrial automation use cases.
Vertical Outlook
Based on Vertical, the market is segmented into Consumer Electronics, Retail & E-commerce, BFSI, Automotive & Transportation, Healthcare & Life Science, Travel & Hospitality, Government & Defense Sector, and Other Vertical. Consumer Electronics leads due to strong manufacturing capabilities and increasing integration of voice assistants into smartphones, smart speakers, wearables, smart TVs, home appliances, and connected devices.
Retail & E-commerce uses VUI for voice search, product discovery, personalized recommendations, customer support, order placement, and voice commerce. BFSI applies voice interfaces for virtual banking assistants, voice authentication, customer query handling, and digital financial services. Automotive & Transportation, Healthcare & Life Science, Travel & Hospitality, Government & Defense Sector, and Other Vertical areas add demand through connected vehicle control, clinical communication, telehealth, concierge services, e-governance, secure public services, voice-assisted learning, and manufacturing operations.
Free Valuable Insights: Voice User Interface Market is Predicted to reach USD 164.1 Billion billion by 2033, at a CAGR of 20.8%
Country Outlook
Based on Country, the market is segmented into China, Japan, India, South Korea, Singapore, Malaysia, and Rest of Asia Pacific. The China market dominated the Asia Pacific Voice User Interface Market by Country in 2025, and would continue to be a dominant market till 2033; thereby, achieving a market value of USD 8.2 billion by 2030, growing at a CAGR of 19.3 % during the forecast period. The Japan market is expected to witness a CAGR of 20.5% during (2026 - 2033). Additionally, The India market is expected to witness a CAGR of 22.1% during (2026 - 2033).
China leads due to strong AI development, large-scale smartphone adoption, voice commerce growth, smart home expansion, dialect-focused speech models, and domestic voice assistant ecosystems. Japan supports market growth through robotics adoption, aging population needs, automotive voice integration, smart appliances, and Japanese-language contextual AI development. India is advancing through regional language interfaces, mobile-first adoption, affordable internet access, voice-enabled e-commerce, banking inclusion, and government digital services. South Korea, Singapore, and Malaysia add momentum through advanced connectivity, multilingual voice platforms, smart device ecosystems, healthcare voice applications, and edge-enabled AI, while Rest of Asia Pacific benefits from localized voice assistants, smart devices, enterprise communication platforms, and contact center automation.
List of Key Companies Profiled
- Google LLC (Alphabet Inc.)
- Amazon.com, Inc.
- Microsoft Corporation (Nuance Communications)
- Apple Inc.
- Samsung Electronics Co., Ltd.
- Cerence Inc.
- SoundHound AI, Inc.
- Baidu, Inc.
- IBM Corporation
- OpenAI, L.L.C.
Asia Pacific Voice User Interface Market Report Segmentation
By Offering
- Solution
- Services
By Application
- Smartphones & Tablets
- Smart Speakers
- Voice-controlled Devices
- Interactive Voice Response
- Other Application
By Vertical
- Consumer Electronics
- Retail & E-commerce
- BFSI
- Automotive & Transportation
- Healthcare & Life Science
- Travel & Hospitality
- Government & Defense Sector
- Other Vertical
By Country
- China
- Japan
- India
- South Korea
- Singapore
- Malaysia
- Rest of Asia Pacific
1.1 Market Overview
1.2 Key Factors Impacting Market
1.2.1 Market Drivers
1.2.2 Market Restraints
1.2.3 Market Opportunities
1.2.4 Market Challenges
1.2.5 Market Trends
1.2.6 State of Competition
1.2.7 Market Consolidation
1.2.8 Key Customer Criteria
1.3 Product Life Cycle
1.4 Segmentation By Offering
1.4.1 Solution
1.4.2 Services
1.5 Segmentation By Application
1.5.1 Smartphones & Tablets
1.5.2 Smart Speakers
1.5.3 Voice-controlled Devices
1.5.4 Interactive Voice Response
1.5.5 Other Application
1.6 Segmentation By Vertical
1.6.1 Consumer Electronics
1.6.2 Retail & E-commerce
1.6.3 BFSI
1.6.4 Automotive & Transportation
1.6.5 Healthcare & Life Science
1.6.6 Travel & Hospitality
1.6.7 Government & Defense Sector
1.6.8 Other Vertical
1.7 Segmentation By Country
1.7.1 China
1.7.1.1 Segmentation By Offering
1.7.1.1.1 Solutions
1.7.1.1.2 Services
1.7.1.2 Segmentation By Application
1.7.1.2.1 Smartphones & Tablets
1.7.1.2.2 Smart Speakers
1.7.1.2.3 Voice-controlled Devices
1.7.1.2.4 Interactive Voice Response
1.7.1.2.5 Other Application
1.7.1.3 Segmentation By Vertical
1.7.1.3.1 Consumer Electronics
1.7.1.3.2 Retail & E-commerce
1.7.1.3.3 BFSI
1.7.1.3.4 Automotive & Transportation
1.7.1.3.5 Healthcare & Life Science
1.7.1.3.6 Travel & Hospitality
1.7.1.3.7 Government & Defense Sector
1.7.1.3.8 Other Vertical
1.7.2 Japan
1.7.2.1 Segmentation By Offering
1.7.2.1.1 Solutions
1.7.2.1.2 Services
1.7.2.2 Segmentation By Application
1.7.2.2.1 Smartphones & Tablets
1.7.2.2.2 Smart Speakers
1.7.2.2.3 Voice-controlled Devices
1.7.2.2.4 Interactive Voice Response
1.7.2.2.5 Other Application
1.7.2.3 Segmentation By Vertical
1.7.2.3.1 Consumer Electronics
1.7.2.3.2 Retail & E-commerce
1.7.2.3.3 BFSI
1.7.2.3.4 Automotive & Transportation
1.7.2.3.5 Healthcare & Life Science
1.7.2.3.6 Travel & Hospitality
1.7.2.3.7 Government & Defense Sector
1.7.2.3.8 Other Vertical
1.7.3 India
1.7.3.1 Segmentation By Offering
1.7.3.1.1 Solutions
1.7.3.1.2 Services
1.7.3.2 Segmentation By Application
1.7.3.2.1 Smartphones & Tablets
1.7.3.2.2 Smart Speakers
1.7.3.2.3 Voice-controlled Devices
1.7.3.2.4 Interactive Voice Response
1.7.3.2.5 Other Application
1.7.3.3 Segmentation By Vertical
1.7.3.3.1 Consumer Electronics
1.7.3.3.2 Retail & E-commerce
1.7.3.3.3 BFSI
1.7.3.3.4 Automotive & Transportation
1.7.3.3.5 Healthcare & Life Science
1.7.3.3.6 Travel & Hospitality
1.7.3.3.7 Government & Defense Sector
1.7.3.3.8 Other Vertical
1.7.4 South Korea
1.7.4.1 Segmentation By Offering
1.7.4.1.1 Solutions
1.7.4.1.2 Services
1.7.4.2 Segmentation By Application
1.7.4.2.1 Smartphones & Tablets
1.7.4.2.2 Smart Speakers
1.7.4.2.3 Voice-controlled Devices
1.7.4.2.4 Interactive Voice Response
1.7.4.2.5 Other Application
1.7.4.3 Segmentation By Vertical
1.7.4.3.1 Consumer Electronics
1.7.4.3.2 Retail & E-commerce
1.7.4.3.3 BFSI
1.7.4.3.4 Automotive & Transportation
1.7.4.3.5 Healthcare & Life Science
1.7.4.3.6 Travel & Hospitality
1.7.4.3.7 Government & Defense Sector
1.7.4.3.8 Other Vertical
1.7.5 Singapore
1.7.5.1 Segmentation By Offering
1.7.5.1.1 Solutions
1.7.5.1.2 Services
1.7.5.2 Segmentation By Application
1.7.5.2.1 Smartphones & Tablets
1.7.5.2.2 Smart Speakers
1.7.5.2.3 Voice-controlled Devices
1.7.5.2.4 Interactive Voice Response
1.7.5.2.5 Other Application
1.7.5.3 Segmentation By Vertical
1.7.5.3.1 Consumer Electronics
1.7.5.3.2 Retail & E-commerce
1.7.5.3.3 BFSI
1.7.5.3.4 Automotive & Transportation
1.7.5.3.5 Healthcare & Life Science
1.7.5.3.6 Travel & Hospitality
1.7.5.3.7 Government & Defense Sector
1.7.5.3.8 Other Vertical
1.7.6 Malaysia
1.7.6.1 Segmentation By Offering
1.7.6.1.1 Solutions
1.7.6.1.2 Services
1.7.6.2 Segmentation By Application
1.7.6.2.1 Smartphones & Tablets
1.7.6.2.2 Smart Speakers
1.7.6.2.3 Voice-controlled Devices
1.7.6.2.4 Interactive Voice Response
1.7.6.2.5 Other Application
1.7.6.3 Segmentation By Vertical
1.7.6.3.1 Consumer Electronics
1.7.6.3.2 Retail & E-commerce
1.7.6.3.3 BFSI
1.7.6.3.4 Automotive & Transportation
1.7.6.3.5 Healthcare & Life Science
1.7.6.3.6 Travel & Hospitality
1.7.6.3.7 Government & Defense Sector
1.7.6.3.8 Other Vertical
1.7.7 Rest of Asia Pacific
1.7.7.1 Segmentation By Offering
1.7.7.1.1 Solutions
1.7.7.1.2 Services
1.7.7.2 Segmentation By Application
1.7.7.2.1 Smartphones & Tablets
1.7.7.2.2 Smart Speakers
1.7.7.2.3 Voice-controlled Devices
1.7.7.2.4 Interactive Voice Response
1.7.7.2.5 Other Application
1.7.7.3 Segmentation By Vertical
1.7.7.3.1 Consumer Electronics
1.7.7.3.2 Retail & E-commerce
1.7.7.3.3 BFSI
1.7.7.3.4 Automotive & Transportation
1.7.7.3.5 Healthcare & Life Science
1.7.7.3.6 Travel & Hospitality
1.7.7.3.7 Government & Defense Sector
1.7.7.3.8 Other Vertical
Chapter 2. Company Snapshots
2.1 Google LLC
2.1.1 Business Overview
2.1.2 Key Information
2.1.3 Company Focus on Voice User Interface Market
2.1.4 Strategic Insights
2.1.5 Strategy Deployed
2.1.6 Product & Service Portfolio
2.1.7 Representative Products
2.1.8 Capability Overview
2.1.9 Technology & Innovation Focus
2.1.10 SWOT Analysis
2.1.11 Customers / End Users
2.1.12 Competitive Positioning
2.1.13 Key Differentiators
2.1.14 Portfolio Matrix
2.1.15 Analyst View
2.1.16 Future Outlook
2.2 Amazon.com, Inc.
2.2.1 Business Overview
2.2.2 Key Information
2.2.3 Company Focus on Voice User Interface Market
2.2.4 Strategic Insights
2.2.5 Strategy Deployed
2.2.6 Product & Service Portfolio
2.2.7 Representative Products
2.2.8 Capability Overview
2.2.9 Technology & Innovation Focus
2.2.10 SWOT Analysis
2.2.11 Customers / End Users
2.2.12 Competitive Positioning
2.2.13 Key Differentiators
2.2.14 Portfolio Matrix
2.2.15 Analyst View
2.2.16 Future Outlook
2.3 Microsoft Corporation
2.3.1 Business Overview
2.3.2 Key Information
2.3.3 Company Focus on Voice User Interface Market
2.3.4 Strategic Insights
2.3.5 Strategy Deployed
2.3.6 Product & Service Portfolio
2.3.7 Representative Products
2.3.8 Capability Overview
2.3.9 Technology & Innovation Focus
2.3.10 SWOT Analysis
2.3.11 Customers / End Users
2.3.12 Competitive Positioning
2.3.13 Key Differentiators
2.3.14 Portfolio Matrix
2.3.15 Analyst View
2.3.16 Future Outlook
2.4 Apple Inc.
2.4.1 Business Overview
2.4.2 Key Information
2.4.3 Company Focus on Voice User Interface Market
2.4.4 Strategic Insights
2.4.5 Strategy Deployed
2.4.6 Product & Service Portfolio
2.4.7 Representative Products
2.4.8 Capability Overview
2.4.9 Technology & Innovation Focus
2.4.10 SWOT Analysis
2.4.11 Customers / End Users
2.4.12 Competitive Positioning
2.4.13 Key Differentiators
2.4.14 Portfolio Matrix
2.4.15 Analyst View
2.4.16 Future Outlook
2.5 Samsung Electronics Co., Ltd.
2.5.1 Business Overview
2.5.2 Key Information
2.5.3 Company Focus on Voice User Interface Market
2.5.4 Strategic Insights
2.5.5 Strategy Deployed
2.5.6 Product & Service Portfolio
2.5.7 Representative Products
2.5.8 Capability Overview
2.5.9 Technology & Innovation Focus
2.5.10 SWOT Analysis 2.5.11 Customers / End Users
2.5.12 Competitive Positioning
2.5.13 Key Differentiators
2.5.14 Portfolio Matrix
2.5.15 Analyst View
2.5.16 Future Outlook
2.6 Cerence Inc.
2.6.1 Business Overview
2.6.2 Key Information
2.6.3 Company Focus on Voice User Interface Market
2.6.4 Strategic Insights
2.6.5 Strategy Deployed
2.6.6 Product & Service Portfolio
2.6.7 Representative Products
2.6.8 Capability Overview
2.6.9 Technology & Innovation Focus
2.6.10 SWOT Analysis
2.6.11 Customers / End Users
2.6.12 Competitive Positioning
2.6.13 Key Differentiators
2.6.14 Portfolio Matrix
2.6.15 Analyst View
2.6.16 Future Outlook
2.7 SoundHound AI, Inc.
2.7.1 Business Overview
2.7.2 Key Information
2.7.3 Company Focus on Voice User Interface Market
2.7.4 Strategic Insights
2.7.5 Strategy Deployed
2.7.6 Product & Service Portfolio
2.7.7 Representative Products
2.7.8 Capability Overview
2.7.9 Technology & Innovation Focus
2.7.10 SWOT Analysis
2.7.11 Customers / End Users
2.7.12 Competitive Positioning
2.7.13 Key Differentiators
2.7.14 Portfolio Matrix
2.7.15 Analyst View
2.7.16 Future Outlook
2.8 Baidu, Inc.
2.8.1 Business Overview
2.8.2 Key Information
2.8.3 Company Focus on Voice User Interface Market
2.8.4 Strategic Insights
2.8.5 Strategy Deployed
2.8.6 Product & Service Portfolio
2.8.7 Representative Products
2.8.8 Capability Overview
2.8.9 Technology & Innovation Focus
2.8.10 SWOT Analysis
2.8.11 Customers / End Users
2.8.12 Competitive Positioning
2.8.13 Key Differentiators
2.8.14 Portfolio Matrix
2.8.15 Analyst View
2.8.16 Future Outlook
2.9 IBM Corporation
2.9.1 Business Overview
2.9.2 Key Information
2.9.3 Company Focus on Voice User Interface Market
2.9.4 Strategic Insights
2.9.5 Strategy Deployed
2.9.6 Product & Service Portfolio
2.9.7 Representative Products
2.9.8 Capability Overview
2.9.9 Technology & Innovation Focus
2.9.10 SWOT Analysis
2.9.11 Customers / End Users
2.9.12 Competitive Positioning
2.9.13 Key Differentiators
2.9.14 Portfolio Matrix
2.9.15 Analyst View
2.9.16 Future Outlook
2.10 OpenAI, LLC
2.10.1 Business Overview
2.10.2 Key Influencing Factors
2.10.3 Company Focus on Voice User Interface Market
2.10.4 Strategic Insights
2.10.5 Strategy Deployed for Voice User Interface Market
2.10.6 Product & Service Portfolio
2.10.7 Representative Products
2.10.8 Capability Overview
2.10.9 Technology & Innovation Focus
2.10.10 SWOT Analysis
2.10.11 Customers / End Users
2.10.12 Competitive Positioning
2.10.13 Key Differentiators
2.10.14 Portfolio Matrix
2.10.15 Analyst View
2.10.16 Future Outlook
Table 1 Asia Pacific Voice User Interface Market Market, 2022 - 2033, USD Million
Table 2 Methodology for the research
Table 3 Key Factors Impacting Market
Table 4 Market Consolidation
Table 5 Key Customer Criteria
Table 6 Product Life Cycle
Table 7 Asia Pacific Voice User Interface Market Market by Application, 2022 - 2033, USD Million
Table 8 Asia Pacific Interactive Voice Response Market, 2022 - 2033, USD Million
Table 9 Asia Pacific Other Application Market, 2022 - 2033, USD Million
Table 10 Asia Pacific Smart Speakers Market, 2022 - 2033, USD Million
Table 11 Asia Pacific Smartphones & Tablets Market, 2022 - 2033, USD Million
Table 12 Asia Pacific Voice-controlled Devices Market, 2022 - 2033, USD Million
Table 13 Asia Pacific Voice User Interface Market Market by Offering, 2022 - 2033, USD Million
Table 14 Asia Pacific Services Market, 2022 - 2033, USD Million
Table 15 Asia Pacific Solution Market, 2022 - 2033, USD Million
Table 16 Asia Pacific Voice User Interface Market Market by Vertical, 2022 - 2033, USD Million
Table 17 Asia Pacific Automotive & Transportation Market, 2022 - 2033, USD Million
Table 18 Asia Pacific BFSI Market, 2022 - 2033, USD Million
Table 19 Asia Pacific Consumer Electronics Market, 2022 - 2033, USD Million
Table 20 Asia Pacific Government & Defense Sector Market, 2022 - 2033, USD Million
Table 21 Asia Pacific Healthcare & Life Science Market, 2022 - 2033, USD Million
Table 22 Asia Pacific Other Vertical Market, 2022 - 2033, USD Million
Table 23 Asia Pacific Retail & E-commerce Market, 2022 - 2033, USD Million
Table 24 Asia Pacific Travel & Hospitality Market, 2022 - 2033, USD Million
Table 25 China Voice User Interface Market Market, 2022 - 2033, USD Million
Table 26 Methodology for the research
Table 27 Key Factors Impacting Market
Table 28 Market Consolidation
Table 29 Key Customer Criteria
Table 30 Product Life Cycle
Table 31 China Voice User Interface Market Market by Application, 2022 - 2033, USD Million
Table 32 China Interactive Voice Response Market, 2022 - 2033, USD Million
Table 33 China Other Application Market, 2022 - 2033, USD Million
Table 34 China Smart Speakers Market, 2022 - 2033, USD Million
Table 35 China Smartphones & Tablets Market, 2022 - 2033, USD Million
Table 36 China Voice-controlled Devices Market, 2022 - 2033, USD Million
Table 37 China Voice User Interface Market Market by Offering, 2022 - 2033, USD Million
Table 38 China Services Market, 2022 - 2033, USD Million
Table 39 China Solution Market, 2022 - 2033, USD Million
Table 40 China Voice User Interface Market Market by Vertical, 2022 - 2033, USD Million
Table 41 China Automotive & Transportation Market, 2022 - 2033, USD Million
Table 42 China BFSI Market, 2022 - 2033, USD Million
Table 43 China Consumer Electronics Market, 2022 - 2033, USD Million
Table 44 China Government & Defense Sector Market, 2022 - 2033, USD Million
Table 45 China Healthcare & Life Science Market, 2022 - 2033, USD Million
Table 46 China Other Vertical Market, 2022 - 2033, USD Million
Table 47 China Retail & E-commerce Market, 2022 - 2033, USD Million
Table 48 China Travel & Hospitality Market, 2022 - 2033, USD Million
Table 49 India Voice User Interface Market Market, 2022 - 2033, USD Million
Table 50 Methodology for the research
Table 51 Key Factors Impacting Market
Table 52 Market Consolidation
Table 53 Key Customer Criteria
Table 54 Product Life Cycle
Table 55 India Voice User Interface Market Market by Application, 2022 - 2033, USD Million
Table 56 India Interactive Voice Response Market, 2022 - 2033, USD Million
Table 57 India Other Application Market, 2022 - 2033, USD Million
Table 58 India Smart Speakers Market, 2022 - 2033, USD Million
Table 59 India Smartphones & Tablets Market, 2022 - 2033, USD Million
Table 60 India Voice-controlled Devices Market, 2022 - 2033, USD Million
Table 61 India Voice User Interface Market Market by Offering, 2022 - 2033, USD Million
Table 62 India Services Market, 2022 - 2033, USD Million
Table 63 India Solution Market, 2022 - 2033, USD Million
Table 64 India Voice User Interface Market Market by Vertical, 2022 - 2033, USD Million
Table 65 India Automotive & Transportation Market, 2022 - 2033, USD Million
Table 66 India BFSI Market, 2022 - 2033, USD Million
Table 67 India Consumer Electronics Market, 2022 - 2033, USD Million
Table 68 India Government & Defense Sector Market, 2022 - 2033, USD Million
Table 69 India Healthcare & Life Science Market, 2022 - 2033, USD Million
Table 70 India Other Vertical Market, 2022 - 2033, USD Million
Table 71 India Retail & E-commerce Market, 2022 - 2033, USD Million
Table 72 India Travel & Hospitality Market, 2022 - 2033, USD Million
Table 73 Japan Voice User Interface Market Market, 2022 - 2033, USD Million
Table 74 Methodology for the research
Table 75 Key Factors Impacting Market
Table 76 Market Consolidation
Table 77 Key Customer Criteria
Table 78 Product Life Cycle
Table 79 Japan Voice User Interface Market Market by Application, 2022 - 2033, USD Million
Table 80 Japan Interactive Voice Response Market, 2022 - 2033, USD Million
Table 81 Japan Other Application Market, 2022 - 2033, USD Million
Table 82 Japan Smart Speakers Market, 2022 - 2033, USD Million
Table 83 Japan Smartphones & Tablets Market, 2022 - 2033, USD Million
Table 84 Japan Voice-controlled Devices Market, 2022 - 2033, USD Million
Table 85 Japan Voice User Interface Market Market by Offering, 2022 - 2033, USD Million
Table 86 Japan Services Market, 2022 - 2033, USD Million
Table 87 Japan Solution Market, 2022 - 2033, USD Million
Table 88 Japan Voice User Interface Market Market by Vertical, 2022 - 2033, USD Million
Table 89 Japan Automotive & Transportation Market, 2022 - 2033, USD Million
Table 90 Japan BFSI Market, 2022 - 2033, USD Million
Table 91 Japan Consumer Electronics Market, 2022 - 2033, USD Million
Table 92 Japan Government & Defense Sector Market, 2022 - 2033, USD Million
Table 93 Japan Healthcare & Life Science Market, 2022 - 2033, USD Million
Table 94 Japan Other Vertical Market, 2022 - 2033, USD Million
Table 95 Japan Retail & E-commerce Market, 2022 - 2033, USD Million
Table 96 Japan Travel & Hospitality Market, 2022 - 2033, USD Million
Table 97 Malaysia Voice User Interface Market Market, 2022 - 2033, USD Million
Table 98 Methodology for the research
Table 99 Key Factors Impacting Market
Table 100 Market Consolidation
Table 101 Key Customer Criteria
Table 102 Product Life Cycle
Table 103 Malaysia Voice User Interface Market Market by Application, 2022 - 2033, USD Million
Table 104 Malaysia Interactive Voice Response Market, 2022 - 2033, USD Million
Table 105 Malaysia Other Application Market, 2022 - 2033, USD Million
Table 106 Malaysia Smart Speakers Market, 2022 - 2033, USD Million
Table 107 Malaysia Smartphones & Tablets Market, 2022 - 2033, USD Million
Table 108 Malaysia Voice-controlled Devices Market, 2022 - 2033, USD Million
Table 109 Malaysia Voice User Interface Market Market by Offering, 2022 - 2033, USD Million
Table 110 Malaysia Services Market, 2022 - 2033, USD Million
Table 111 Malaysia Solution Market, 2022 - 2033, USD Million
Table 112 Malaysia Voice User Interface Market Market by Vertical, 2022 - 2033, USD Million
Table 113 Malaysia Automotive & Transportation Market, 2022 - 2033, USD Million
Table 114 Malaysia BFSI Market, 2022 - 2033, USD Million
Table 115 Malaysia Consumer Electronics Market, 2022 - 2033, USD Million
Table 116 Malaysia Government & Defense Sector Market, 2022 - 2033, USD Million
Table 117 Malaysia Healthcare & Life Science Market, 2022 - 2033, USD Million
Table 118 Malaysia Other Vertical Market, 2022 - 2033, USD Million
Table 119 Malaysia Retail & E-commerce Market, 2022 - 2033, USD Million
Table 120 Malaysia Travel & Hospitality Market, 2022 - 2033, USD Million
Table 121 Singapore Voice User Interface Market Market, 2022 - 2033, USD Million
Table 122 Methodology for the research
Table 123 Key Factors Impacting Market
Table 124 Market Consolidation
Table 125 Key Customer Criteria
Table 126 Product Life Cycle
Table 127 Singapore Voice User Interface Market Market by Application, 2022 - 2033, USD Million
Table 128 Singapore Interactive Voice Response Market, 2022 - 2033, USD Million
Table 129 Singapore Other Application Market, 2022 - 2033, USD Million
Table 130 Singapore Smart Speakers Market, 2022 - 2033, USD Million
Table 131 Singapore Smartphones & Tablets Market, 2022 - 2033, USD Million
Table 132 Singapore Voice-controlled Devices Market, 2022 - 2033, USD Million
Table 133 Singapore Voice User Interface Market Market by Offering, 2022 - 2033, USD Million
Table 134 Singapore Services Market, 2022 - 2033, USD Million
Table 135 Singapore Solution Market, 2022 - 2033, USD Million
Table 136 Singapore Voice User Interface Market Market by Vertical, 2022 - 2033, USD Million
Table 137 Singapore Automotive & Transportation Market, 2022 - 2033, USD Million
Table 138 Singapore BFSI Market, 2022 - 2033, USD Million
Table 139 Singapore Consumer Electronics Market, 2022 - 2033, USD Million
Table 140 Singapore Government & Defense Sector Market, 2022 - 2033, USD Million
Table 141 Singapore Healthcare & Life Science Market, 2022 - 2033, USD Million
Table 142 Singapore Other Vertical Market, 2022 - 2033, USD Million
Table 143 Singapore Retail & E-commerce Market, 2022 - 2033, USD Million
Table 144 Singapore Travel & Hospitality Market, 2022 - 2033, USD Million
Table 145 South Korea Voice User Interface Market Market, 2022 - 2033, USD Million
Table 146 Methodology for the research
Table 147 Key Factors Impacting Market
Table 148 Market Consolidation
Table 149 Key Customer Criteria
Table 150 Product Life Cycle
Table 151 South Korea Voice User Interface Market Market by Application, 2022 - 2033, USD Million
Table 152 South Korea Interactive Voice Response Market, 2022 - 2033, USD Million
Table 153 South Korea Other Application Market, 2022 - 2033, USD Million
Table 154 South Korea Smart Speakers Market, 2022 - 2033, USD Million
Table 155 South Korea Smartphones & Tablets Market, 2022 - 2033, USD Million
Table 156 South Korea Voice-controlled Devices Market, 2022 - 2033, USD Million
Table 157 South Korea Voice User Interface Market Market by Offering, 2022 - 2033, USD Million
Table 158 South Korea Services Market, 2022 - 2033, USD Million
Table 159 South Korea Solution Market, 2022 - 2033, USD Million
Table 160 South Korea Voice User Interface Market Market by Vertical, 2022 - 2033, USD Million
Table 161 South Korea Automotive & Transportation Market, 2022 - 2033, USD Million
Table 162 South Korea BFSI Market, 2022 - 2033, USD Million
Table 163 South Korea Consumer Electronics Market, 2022 - 2033, USD Million
Table 164 South Korea Government & Defense Sector Market, 2022 - 2033, USD Million
Table 165 South Korea Healthcare & Life Science Market, 2022 - 2033, USD Million
Table 166 South Korea Other Vertical Market, 2022 - 2033, USD Million
Table 167 South Korea Retail & E-commerce Market, 2022 - 2033, USD Million
Table 168 South Korea Travel & Hospitality Market, 2022 - 2033, USD Million
Table 169 Rest of Asia Pacific Voice User Interface Market Market, 2022 - 2033, USD Million
Table 170 Methodology for the research
Table 171 Key Factors Impacting Market
Table 172 Market Consolidation
Table 173 Key Customer Criteria
Table 174 Product Life Cycle
Table 175 Rest of Asia Pacific Voice User Interface Market Market by Application, 2022 - 2033, USD Million
Table 176 Rest of Asia Pacific Interactive Voice Response Market, 2022 - 2033, USD Million
Table 177 Rest of Asia Pacific Other Application Market, 2022 - 2033, USD Million
Table 178 Rest of Asia Pacific Smart Speakers Market, 2022 - 2033, USD Million
Table 179 Rest of Asia Pacific Smartphones & Tablets Market, 2022 - 2033, USD Million
Table 180 Rest of Asia Pacific Voice-controlled Devices Market, 2022 - 2033, USD Million
Table 181 Rest of Asia Pacific Voice User Interface Market Market by Offering, 2022 - 2033, USD Million
Table 182 Rest of Asia Pacific Services Market, 2022 - 2033, USD Million
Table 183 Rest of Asia Pacific Solution Market, 2022 - 2033, USD Million
Table 184 Rest of Asia Pacific Voice User Interface Market Market by Vertical, 2022 - 2033, USD Million
Table 185 Rest of Asia Pacific Automotive & Transportation Market, 2022 - 2033, USD Million
Table 186 Rest of Asia Pacific BFSI Market, 2022 - 2033, USD Million
Table 187 Rest of Asia Pacific Consumer Electronics Market, 2022 - 2033, USD Million
Table 188 Rest of Asia Pacific Government & Defense Sector Market, 2022 - 2033, USD Million
Table 189 Rest of Asia Pacific Healthcare & Life Science Market, 2022 - 2033, USD Million
Table 190 Rest of Asia Pacific Other Vertical Market, 2022 - 2033, USD Million
Table 191 Rest of Asia Pacific Retail & E-commerce Market, 2022 - 2033, USD Million
Table 192 Rest of Asia Pacific Travel & Hospitality Market, 2022 - 2033, USD Million
List of Figures
FIG 1 Methodology for the research
FIG 2 Key Factors Impacting Market
FIG 3 Market Consolidation
FIG 4 Key Customer Criteria
FIG 5 Product Life Cycle
FIG 6 Asia Pacific Voice User Interface Market Market, 2022 - 2033, USD Million
FIG 7 Asia Pacific Voice User Interface Market Market by Application, 2022 - 2033, USD Million
FIG 8 Asia Pacific Interactive Voice Response Market, 2022 - 2033, USD Million
FIG 9 Asia Pacific Other Application Market, 2022 - 2033, USD Million
FIG 10 Asia Pacific Smart Speakers Market, 2022 - 2033, USD Million
FIG 11 Asia Pacific Smartphones & Tablets Market, 2022 - 2033, USD Million
FIG 12 Asia Pacific Voice-controlled Devices Market, 2022 - 2033, USD Million
FIG 13 Asia Pacific Voice User Interface Market Market by Offering, 2022 - 2033, USD Million
FIG 14 Asia Pacific Services Market, 2022 - 2033, USD Million
FIG 15 Asia Pacific Solution Market, 2022 - 2033, USD Million
FIG 16 Asia Pacific Voice User Interface Market Market by Vertical, 2022 - 2033, USD Million
FIG 17 Asia Pacific Automotive & Transportation Market, 2022 - 2033, USD Million
FIG 18 Asia Pacific BFSI Market, 2022 - 2033, USD Million
FIG 19 Asia Pacific Consumer Electronics Market, 2022 - 2033, USD Million
FIG 20 Asia Pacific Government & Defense Sector Market, 2022 - 2033, USD Million
FIG 21 Asia Pacific Healthcare & Life Science Market, 2022 - 2033, USD Million
FIG 22 Asia Pacific Other Vertical Market, 2022 - 2033, USD Million
FIG 23 Asia Pacific Retail & E-commerce Market, 2022 - 2033, USD Million
FIG 24 Asia Pacific Travel & Hospitality Market, 2022 - 2033, USD Million
FIG 25 China Voice User Interface Market Market, 2022 - 2033, USD Million
FIG 26 China Voice User Interface Market Market by Application, 2022 - 2033, USD Million
FIG 27 China Interactive Voice Response Market, 2022 - 2033, USD Million
FIG 28 China Other Application Market, 2022 - 2033, USD Million
FIG 29 China Smart Speakers Market, 2022 - 2033, USD Million
FIG 30 China Smartphones & Tablets Market, 2022 - 2033, USD Million
FIG 31 China Voice-controlled Devices Market, 2022 - 2033, USD Million
FIG 32 China Voice User Interface Market Market by Offering, 2022 - 2033, USD Million
FIG 33 China Services Market, 2022 - 2033, USD Million
FIG 34 China Solution Market, 2022 - 2033, USD Million
FIG 35 China Voice User Interface Market Market by Vertical, 2022 - 2033, USD Million
FIG 36 China Automotive & Transportation Market, 2022 - 2033, USD Million
FIG 37 China BFSI Market, 2022 - 2033, USD Million
FIG 38 China Consumer Electronics Market, 2022 - 2033, USD Million
FIG 39 China Government & Defense Sector Market, 2022 - 2033, USD Million
FIG 40 China Healthcare & Life Science Market, 2022 - 2033, USD Million
FIG 41 China Other Vertical Market, 2022 - 2033, USD Million
FIG 42 China Retail & E-commerce Market, 2022 - 2033, USD Million
FIG 43 China Travel & Hospitality Market, 2022 - 2033, USD Million
FIG 44 India Voice User Interface Market Market, 2022 - 2033, USD Million
FIG 45 India Voice User Interface Market Market by Application, 2022 - 2033, USD Million
FIG 46 India Interactive Voice Response Market, 2022 - 2033, USD Million
FIG 47 India Other Application Market, 2022 - 2033, USD Million
FIG 48 India Smart Speakers Market, 2022 - 2033, USD Million
FIG 49 India Smartphones & Tablets Market, 2022 - 2033, USD Million
FIG 50 India Voice-controlled Devices Market, 2022 - 2033, USD Million FIG 51 India Voice User Interface Market Market by Offering, 2022 - 2033, USD Million
FIG 52 India Services Market, 2022 - 2033, USD Million
FIG 53 India Solution Market, 2022 - 2033, USD Million
FIG 54 India Voice User Interface Market Market by Vertical, 2022 - 2033, USD Million
FIG 55 India Automotive & Transportation Market, 2022 - 2033, USD Million
FIG 56 India BFSI Market, 2022 - 2033, USD Million
FIG 57 India Consumer Electronics Market, 2022 - 2033, USD Million
FIG 58 India Government & Defense Sector Market, 2022 - 2033, USD Million
FIG 59 India Healthcare & Life Science Market, 2022 - 2033, USD Million
FIG 60 India Other Vertical Market, 2022 - 2033, USD Million
FIG 61 India Retail & E-commerce Market, 2022 - 2033, USD Million
FIG 62 India Travel & Hospitality Market, 2022 - 2033, USD Million
FIG 63 Japan Voice User Interface Market Market, 2022 - 2033, USD Million
FIG 64 Japan Voice User Interface Market Market by Application, 2022 - 2033, USD Million
FIG 65 Japan Interactive Voice Response Market, 2022 - 2033, USD Million
FIG 66 Japan Other Application Market, 2022 - 2033, USD Million
FIG 67 Japan Smart Speakers Market, 2022 - 2033, USD Million
FIG 68 Japan Smartphones & Tablets Market, 2022 - 2033, USD Million
FIG 69 Japan Voice-controlled Devices Market, 2022 - 2033, USD Million
FIG 70 Japan Voice User Interface Market Market by Offering, 2022 - 2033, USD Million
FIG 71 Japan Services Market, 2022 - 2033, USD Million
FIG 72 Japan Solution Market, 2022 - 2033, USD Million
FIG 73 Japan Voice User Interface Market Market by Vertical, 2022 - 2033, USD Million
FIG 74 Japan Automotive & Transportation Market, 2022 - 2033, USD Million
FIG 75 Japan BFSI Market, 2022 - 2033, USD Million
FIG 76 Japan Consumer Electronics Market, 2022 - 2033, USD Million
FIG 77 Japan Government & Defense Sector Market, 2022 - 2033, USD Million
FIG 78 Japan Healthcare & Life Science Market, 2022 - 2033, USD Million
FIG 79 Japan Other Vertical Market, 2022 - 2033, USD Million
FIG 80 Japan Retail & E-commerce Market, 2022 - 2033, USD Million
FIG 81 Japan Travel & Hospitality Market, 2022 - 2033, USD Million
FIG 82 Malaysia Voice User Interface Market Market, 2022 - 2033, USD Million
FIG 83 Malaysia Voice User Interface Market Market by Application, 2022 - 2033, USD Million
FIG 84 Malaysia Interactive Voice Response Market, 2022 - 2033, USD Million
FIG 85 Malaysia Other Application Market, 2022 - 2033, USD Million
FIG 86 Malaysia Smart Speakers Market, 2022 - 2033, USD Million
FIG 87 Malaysia Smartphones & Tablets Market, 2022 - 2033, USD Million
FIG 88 Malaysia Voice-controlled Devices Market, 2022 - 2033, USD Million
FIG 89 Malaysia Voice User Interface Market Market by Offering, 2022 - 2033, USD Million
FIG 90 Malaysia Services Market, 2022 - 2033, USD Million
FIG 91 Malaysia Solution Market, 2022 - 2033, USD Million
FIG 92 Malaysia Voice User Interface Market Market by Vertical, 2022 - 2033, USD Million
FIG 93 Malaysia Automotive & Transportation Market, 2022 - 2033, USD Million
FIG 94 Malaysia BFSI Market, 2022 - 2033, USD Million
FIG 95 Malaysia Consumer Electronics Market, 2022 - 2033, USD Million
FIG 96 Malaysia Government & Defense Sector Market, 2022 - 2033, USD Million
FIG 97 Malaysia Healthcare & Life Science Market, 2022 - 2033, USD Million
FIG 98 Malaysia Other Vertical Market, 2022 - 2033, USD Million
FIG 99 Malaysia Retail & E-commerce Market, 2022 - 2033, USD Million
FIG 100 Malaysia Travel & Hospitality Market, 2022 - 2033, USD Million
FIG 101 Singapore Voice User Interface Market Market, 2022 - 2033, USD Million
FIG 102 Singapore Voice User Interface Market Market by Application, 2022 - 2033, USD Million
FIG 103 Singapore Interactive Voice Response Market, 2022 - 2033, USD Million
FIG 104 Singapore Other Application Market, 2022 - 2033, USD Million
FIG 105 Singapore Smart Speakers Market, 2022 - 2033, USD Million
FIG 106 Singapore Smartphones & Tablets Market, 2022 - 2033, USD Million
FIG 107 Singapore Voice-controlled Devices Market, 2022 - 2033, USD Million
FIG 108 Singapore Voice User Interface Market Market by Offering, 2022 - 2033, USD Million
FIG 109 Singapore Services Market, 2022 - 2033, USD Million
FIG 110 Singapore Solution Market, 2022 - 2033, USD Million
FIG 111 Singapore Voice User Interface Market Market by Vertical, 2022 - 2033, USD Million
FIG 112 Singapore Automotive & Transportation Market, 2022 - 2033, USD Million
FIG 113 Singapore BFSI Market, 2022 - 2033, USD Million
FIG 114 Singapore Consumer Electronics Market, 2022 - 2033, USD Million
FIG 115 Singapore Government & Defense Sector Market, 2022 - 2033, USD Million
FIG 116 Singapore Healthcare & Life Science Market, 2022 - 2033, USD Million
FIG 117 Singapore Other Vertical Market, 2022 - 2033, USD Million
FIG 118 Singapore Retail & E-commerce Market, 2022 - 2033, USD Million
FIG 119 Singapore Travel & Hospitality Market, 2022 - 2033, USD Million
FIG 120 South Korea Voice User Interface Market Market, 2022 - 2033, USD Million
FIG 121 South Korea Voice User Interface Market Market by Application, 2022 - 2033, USD Million
FIG 122 South Korea Interactive Voice Response Market, 2022 - 2033, USD Million
FIG 123 South Korea Other Application Market, 2022 - 2033, USD Million
FIG 124 South Korea Smart Speakers Market, 2022 - 2033, USD Million
FIG 125 South Korea Smartphones & Tablets Market, 2022 - 2033, USD Million
FIG 126 South Korea Voice-controlled Devices Market, 2022 - 2033, USD Million
FIG 127 South Korea Voice User Interface Market Market by Offering, 2022 - 2033, USD Million
FIG 128 South Korea Services Market, 2022 - 2033, USD Million
FIG 129 South Korea Solution Market, 2022 - 2033, USD Million
FIG 130 South Korea Voice User Interface Market Market by Vertical, 2022 - 2033, USD Million
FIG 131 South Korea Automotive & Transportation Market, 2022 - 2033, USD Million
FIG 132 South Korea BFSI Market, 2022 - 2033, USD Million
FIG 133 South Korea Consumer Electronics Market, 2022 - 2033, USD Million
FIG 134 South Korea Government & Defense Sector Market, 2022 - 2033, USD Million
FIG 135 South Korea Healthcare & Life Science Market, 2022 - 2033, USD Million
FIG 136 South Korea Other Vertical Market, 2022 - 2033, USD Million
FIG 137 South Korea Retail & E-commerce Market, 2022 - 2033, USD Million
FIG 138 South Korea Travel & Hospitality Market, 2022 - 2033, USD Million
FIG 139 Rest of Asia Pacific Voice User Interface Market Market, 2022 - 2033, USD Million
FIG 140 Rest of Asia Pacific Voice User Interface Market Market by Application, 2022 - 2033, USD Million
FIG 141 Rest of Asia Pacific Interactive Voice Response Market, 2022 - 2033, USD Million
FIG 142 Rest of Asia Pacific Other Application Market, 2022 - 2033, USD Million
FIG 143 Rest of Asia Pacific Smart Speakers Market, 2022 - 2033, USD Million
FIG 144 Rest of Asia Pacific Smartphones & Tablets Market, 2022 - 2033, USD Million
FIG 145 Rest of Asia Pacific Voice-controlled Devices Market, 2022 - 2033, USD Million
FIG 146 Rest of Asia Pacific Voice User Interface Market Market by Offering, 2022 - 2033, USD Million
FIG 147 Rest of Asia Pacific Services Market, 2022 - 2033, USD Million
FIG 148 Rest of Asia Pacific Solution Market, 2022 - 2033, USD Million
FIG 149 Rest of Asia Pacific Voice User Interface Market Market by Vertical, 2022 - 2033, USD Million
FIG 150 Rest of Asia Pacific Automotive & Transportation Market, 2022 - 2033, USD Million
FIG 151 Rest of Asia Pacific BFSI Market, 2022 - 2033, USD Million
FIG 152 Rest of Asia Pacific Consumer Electronics Market, 2022 - 2033, USD Million
FIG 153 Rest of Asia Pacific Government & Defense Sector Market, 2022 - 2033, USD Million
FIG 154 Rest of Asia Pacific Healthcare & Life Science Market, 2022 - 2033, USD Million
FIG 155 Rest of Asia Pacific Other Vertical Market, 2022 - 2033, USD Million
FIG 156 Rest of Asia Pacific Retail & E-commerce Market, 2022 - 2033, USD Million
FIG 157 Rest of Asia Pacific Travel & Hospitality Market, 2022 - 2033, USD Million