Asia Pacific Social Networking App Market Size, Share & Industry Analysis Report By Device Type (Smartphones, and Other Device Type), By Revenue Source (Advertising, and In-App Purchase), By Marketplace (Google Play Store, and Apple App Store), By Country Outlook and Forecast, 2026 - 2033
Published Date : 25-Oct-2026 |
Pages: 243 |
Report Format: PDF + Excel |
COVID-19 Impact on the Asia Pacific Social Networking App Market
The Asia Pacific Social Networking App Market is expected to reach USD 130.2 billion by 2030, growing at a CAGR of 28.3% during (2026 - 2033).
The Asia Pacific Social Networking App Market originated from the early expansion of internet connectivity and mobile technology across the region, enabling digital platforms for communication, profile sharing, and instant messaging. Early growth was closely linked to rising smartphone penetration and improving mobile internet infrastructure across diverse user groups. Over time, 4G and 5G networks, video streaming, live broadcasting, augmented reality, indigenous platforms, local-language support, and stronger data privacy features transformed social networking apps from basic communication tools into mature digital ecosystems integrating social interaction, e-commerce, content creation, gaming, and daily digital engagement.
Current market growth is shaped by social commerce convergence, short-form video adoption, regulatory scrutiny, data privacy mandates, AI-driven personalization, and localized platform strategies. Developers are increasingly integrating shopping experiences, influencer marketing, video creation tools, algorithm-driven feeds, live-stream promotions, AI-based content moderation, digital payments, and transparent data controls. Demand is also rising for apps that support regional languages, creator platforms, gaming communities, interactive commerce, virtual gifting, mobile-first engagement, and culturally relevant content experiences across Asia Pacific.
Device Type Outlook
Based on Device Type, the market is segmented into Smartphones and Other Device Type. The Smartphones market dominated the Asia Pacific Social Networking App Market by Device Type in 2025, and would continue to be a dominant market till 2033; thereby, achieving a market value of USD 117.5 billion by 2030, growing at a CAGR of 28 % during the forecast period. The Other Device Type market is expected to witness a CAGR of 30.7% during (2026 - 2033).
Smartphones remain the leading device type as they support instant messaging, video sharing, live streaming, location-based services, camera-enabled interaction, mobile payments, AI-driven recommendations, AR filters, low-data app design, 5G-enabled broadcasting, and continuous social engagement among Gen Z, millennials, urban, and semi-urban users. Other Device Type maintains a promising presence through tablets, personal computers, smart televisions, laptops, content creation, professional networking, multitasking, larger-screen consumption, cloud synchronization, cross-platform accounts, and extended social interactions beyond primary mobile devices.
Revenue Source Outlook
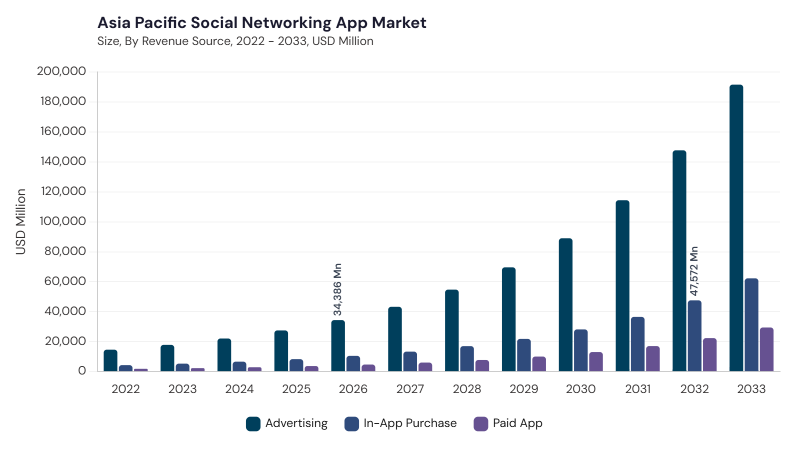
Based on Revenue Source, the market is segmented into Advertising, In-App Purchase, and Paid App. Advertising remains the leading revenue source as it supports in-feed ads, sponsored content, video ads, native placements, shoppable content, automated ad placement, localized campaigns, programmatic buying, AI-driven ad targeting, and mobile-first mass-market monetization.
In-App Purchase establishes a substantial foothold through virtual gifting, premium memberships, digital items, creator subscriptions, interactive livestream features, paid virtual goods, avatar enhancements, localized payment systems, and exclusive content. Paid App represents an emerging outlook through privacy-focused apps, ad-free experiences, specialized networking communities, professional tools, enhanced customization, upfront access models, and premium social interaction features in selected higher-spending markets.
Marketplace Outlook
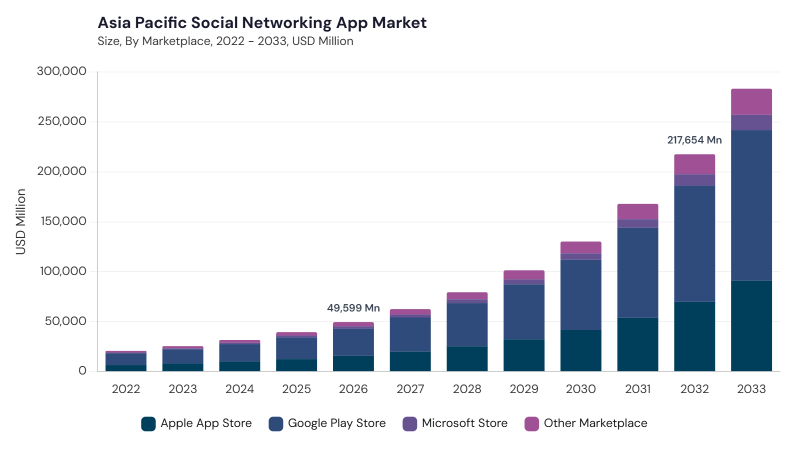
Based on Marketplace, the market is segmented into Google Play Store, Apple App Store, Microsoft Store, and Other Marketplace. Google Play Store remains the leading marketplace as it supports broad Android penetration, mass-market accessibility, localized content, multi-language support, social commerce functions, instant messaging, video sharing, community networking, frequent app updates, Google AI recommendation tools, and telecom-linked distribution. Apple App Store maintains a significant presence through engaged iOS communities, premium social experiences, secure communication, subscriptions, in-app purchases, AR-enabled features, machine learning tools, privacy-focused policies, and strong ecosystem loyalty.
Other Marketplace holds a considerable standing through regional app stores, carrier-specific platforms, manufacturer-controlled ecosystems, direct distribution, local payment systems, content regulation alignment, country-specific app portals, and alternative channels in highly localized markets. Microsoft Store forms a promising foothold through Windows users, desktop-centered social access, enterprise-oriented networking, professional collaboration, gaming communities, creator applications, Office and Teams integration, and hybrid social-productivity use cases.
Free Valuable Insights: Social Networking App Market is Predicted to reach USD 680.0 Billion billion by 2033, at a CAGR of 27.8%
Country Outlook
Based on Country, the market is segmented into China, Japan, India, South Korea, Singapore, Malaysia, and Rest of Asia Pacific. The China market dominated the Asia Pacific Social Networking App Market by Country in 2025, and would continue to be a dominant market till 2033; thereby, achieving a market value of USD 63.0 billion by 2030, growing at a CAGR of 27 % during the forecast period. The Japan market is expected to witness a CAGR of 27% during (2026 - 2033). Additionally, The India market is expected to witness a CAGR of 29.5% during (2026 - 2033).
China is shaped by short-video, live streaming, in-app commerce, AI recommendations, domestic compliance, and multifunctional social ecosystems, while Japan reflects privacy-centric features, AI personalization, virtual influencers, gaming-linked networking, and entertainment integration. India is supported by vernacular content, short-video apps, affordable data, AI recommendations, payment partnerships, and rural or tier-city expansion. South Korea is advancing through AI personalization, social commerce, privacy controls, K-pop-linked engagement, and integrated digital identity, whereas Singapore is influenced by multilingual localization, AR, live streaming, data privacy, 5G, cloud infrastructure, and payment-gateway partnerships. Malaysia is driven by multicultural localization, social commerce, live streaming, AI content curation, cybersecurity, and telecom partnerships, while Rest of Asia Pacific is shaped by hyper-localization, gaming, commerce, virtual events, privacy features, 5G readiness, and culturally adapted community platforms.
List of Key Companies Profiled
- Meta Platforms, Inc.
- ByteDance Ltd.
- Alphabet Inc.
- Tencent Holdings Ltd.
- Kuaishou Technology
- Microsoft Corporation
- Snap Inc.
- Pinterest, Inc.
- Reddit, Inc.
- X Corp.
Asia Pacific Social Networking App Market Report Segmentation
By Device Type
- Smartphones
- Other Device Type
By Revenue Source
- Advertising
- In-App Purchase
- Paid App
By Marketplace
- Google Play Store
- Apple App Store
- Microsoft Store
- Other Marketplace
By Country
- China
- Japan
- India
- South Korea
- Singapore
- Malaysia
- Rest of Asia Pacific
1.1 Market Overview
1.2 Key Factors Impacting Market
1.2.1 Market Drivers
1.2.2 Market Restraints
1.2.3 Market Opportunities
1.2.4 Market Challenges
1.2.5 Market Trends
1.2.6 State of Competition
1.2.7 Market Consolidation
1.2.8 Key Customer Criteria
1.3 Product Life Cycle
1.4 Segmentation By Device Type
1.4.1 Smartphones
1.4.2 Other Device Type
1.5 Segmentation By Revenue Source
1.5.1 Advertising
1.5.2 In-App Purchase
1.5.3 Paid App
1.6 Segmentation By Marketplace
1.6.1 Google Play Store
1.6.2 Apple App Store
1.6.3 Microsoft Store
1.6.4 Other Marketplace
1.7 Segmentation By Country
1.7.1 China
1.7.1.1 Segmentation By Device Type
1.7.1.1.1 Smartphones
1.7.1.1.2 Other Device Type
1.7.1.2 Segmentation By Revenue Source
1.7.1.2.1 Advertising
1.7.1.2.2 In-App Purchase
1.7.1.2.3 Paid App
1.7.1.3 Segmentation By Marketplace
1.7.1.3.1 Google Play Store
1.7.1.3.2 Apple App Store
1.7.1.3.3 Microsoft Store
1.7.1.3.4 Other Marketplace
1.7.2 Japan
1.7.2.1 Segmentation By Device Type
1.7.2.1.1 Smartphones
1.7.2.1.2 Other Device Type
1.7.2.2 Segmentation By Revenue Source
1.7.2.2.1 Advertising
1.7.2.2.2 In-App Purchase
1.7.2.2.3 Paid App
1.7.2.3 Segmentation By Marketplace
1.7.2.3.1 Google Play Store
1.7.2.3.2 Apple App Store
1.7.2.3.3 Microsoft Store
1.7.2.3.4 Other Marketplace
1.7.3 India
1.7.3.1 Segmentation By Device Type
1.7.3.1.1 Smartphones
1.7.3.1.2 Other Device Type
1.7.3.2 Segmentation By Revenue Source
1.7.3.2.1 Advertising
1.7.3.2.2 In-App Purchase
1.7.3.2.3 Paid App
1.7.3.3 Segmentation By Marketplace
1.7.3.3.1 Google Play Store
1.7.3.3.2 Apple App Store
1.7.3.3.3 Microsoft Store
1.7.3.3.4 Other Marketplace
1.7.4 South Korea
1.7.4.1 Segmentation By Device Type
1.7.4.1.1 Smartphones
1.7.4.1.2 Other Device Type
1.7.4.2 Segmentation By Revenue Source
1.7.4.2.1 Advertising
1.7.4.2.2 In-App Purchase
1.7.4.2.3 Paid App
1.7.4.3 Segmentation By Marketplace
1.7.4.3.1 Google Play Store
1.7.4.3.2 Apple App Store
1.7.4.3.3 Microsoft Store
1.7.4.3.4 Other Marketplace
1.7.5 Singapore
1.7.5.1 Segmentation By Device Type
1.7.5.1.1 Smartphones
1.7.5.1.2 Other Device Type
1.7.5.2 Segmentation By Revenue Source
1.7.5.2.1 Advertising
1.7.5.2.2 In-App Purchase
1.7.5.2.3 Paid App
1.7.5.3 Segmentation By Marketplace
1.7.5.3.1 Google Play Store
1.7.5.3.2 Apple App Store
1.7.5.3.3 Microsoft Store
1.7.5.3.4 Other Marketplace
1.7.6 Malaysia
1.7.6.1 Segmentation By Device Type
1.7.6.1.1 Smartphones
1.7.6.1.2 Other Device Type
1.7.6.2 Segmentation By Revenue Source
1.7.6.2.1 Advertising
1.7.6.2.2 In-App Purchase
1.7.6.2.3 Paid App
1.7.6.3 Segmentation By Marketplace
1.7.6.3.1 Google Play Store
1.7.6.3.2 Apple App Store
1.7.6.3.3 Microsoft Store
1.7.6.3.4 Other Marketplace
1.7.7 Rest of Asia Pacific
1.7.7.1 Segmentation By Device Type
1.7.7.1.1 Smartphones
1.7.7.1.2 Other Device Type
1.7.7.2 Segmentation By Revenue Source
1.7.7.2.1 Advertising
1.7.7.2.2 In-App Purchase
1.7.7.2.3 Paid App
1.7.7.3 Segmentation By Marketplace
1.7.7.3.1 Google Play Store
1.7.7.3.2 Apple App Store
1.7.7.3.3 Microsoft Store
1.7.7.3.4 Other Marketplace
Chapter 2. Company Snapshots
2.1 Meta Platforms
2.1.1 Business Overview
2.1.2 Key Information
2.1.3 Company Focus on Social Networking App Market
2.1.4 Strategic Insights
2.1.5 Strategy Deployed
2.1.6 Product & Service Portfolio
2.1.7 Capability Overview
2.1.8 Technology & Innovation Focus
2.1.9 SWOT Analysis
2.1.10 Customers / End Users
2.1.11 Competitive Positioning
2.1.12 Key Differentiators
2.1.13 Portfolio Matrix
2.1.14 Analyst View
2.1.15 Future Outlook
2.2 ByteDance
2.2.1 Business Overview
2.2.2 Key Information
2.2.3 Company Focus on Social Networking App Market
2.2.4 Strategic Insights
2.2.5 Strategy Deployed
2.2.6 Product & Service Portfolio
2.2.7 Capability Overview
2.2.8 Technology & Innovation Focus
2.2.9 SWOT Analysis
2.2.10 Customers / End Users
2.2.11 Competitive Positioning
2.2.12 Key Differentiators
2.2.13 Portfolio Matrix
2.2.14 Analyst View
2.2.15 Future Outlook
2.3 Alphabet
2.3.1 Business Overview
2.3.2 Key Information
2.3.3 Company Focus on Social Networking App Market
2.3.4 Strategic Insights
2.3.5 Strategy Deployed
2.3.6 Product & Service Portfolio
2.3.7 Capability Overview
2.3.8 Technology & Innovation Focus
2.3.9 SWOT Analysis
2.3.10 Customers / End Users
2.3.11 Competitive Positioning
2.3.12 Key Differentiators
2.3.13 Portfolio Matrix
2.3.14 Analyst View
2.3.15 Future Outlook
2.4 Tencent
2.4.1 Business Overview
2.4.2 Key Information
2.4.3 Company Focus on Social Networking App Market
2.4.4 Strategic Insights
2.4.5 Strategy Deployed
2.4.6 Product & Service Portfolio
2.4.7 Capability Overview
2.4.8 Technology & Innovation Focus
2.4.9 SWOT Analysis
2.4.10 Customers / End Users
2.4.11 Competitive Positioning
2.4.12 Key Differentiators
2.4.13 Portfolio Matrix
2.4.14 Analyst View
2.4.15 Future Outlook
2.5 Kuaishou Technology
2.5.1 Business Overview
2.5.2 Key Information
2.5.3 Company Focus on Social Networking App Market
2.5.4 Strategic Insights
2.5.5 Strategy Deployed
2.5.6 Product & Service Portfolio
2.5.7 Capability Overview
2.5.8 Technology & Innovation Focus
2.5.9 SWOT Analysis
2.5.10 Customers / End Users
2.5.11 Competitive Positioning
2.5.12 Portfolio Matrix
2.5.13 Analyst View
2.5.14 Future Outlook
2.6 Microsoft
2.6.1 Business Overview
2.6.2 Key Information
2.6.3 Company Focus on Social Networking App Market
2.6.4 Strategic Insights
2.6.5 Strategy Deployed
2.6.6 Product & Service Portfolio
2.6.7 Capability Overview
2.6.8 Technology & Innovation Focus
2.6.9 SWOT Analysis
2.6.10 Customers / End Users
2.6.11 Competitive Positioning
2.6.12 Key Differentiators
2.6.13 Portfolio Matrix
2.6.14 Analyst View
2.6.15 Future Outlook
2.7 Snap Inc.
2.7.1 Business Overview
2.7.2 Key Information
2.7.3 Company Focus on Social Networking App Market
2.7.4 Strategic Insights
2.7.5 Strategy Deployed
2.7.6 Product & Service Portfolio
2.7.7 Capability Overview
2.7.8 Technology & Innovation Focus
2.7.9 SWOT Analysis
2.7.10 Customers / End Users
2.7.11 Competitive Positioning
2.7.12 Key Differentiators
2.7.13 Portfolio Matrix
2.7.14 Analyst View
2.7.15 Future Outlook
2.8 Pinterest
2.8.1 Business Overview
2.8.2 Key Information
2.8.3 Company Focus on Social Networking App Market
2.8.4 Strategic Insights
2.8.5 Strategy Deployed
2.8.6 Product & Service Portfolio
2.8.7 Capability Overview
2.8.8 Technology & Innovation Focus
2.8.9 SWOT Analysis
2.8.10 Customers / End Users
2.8.11 Competitive Positioning
2.8.12 Key Differentiators
2.8.13 Portfolio Matrix
2.8.14 Analyst View
2.8.15 Future Outlook 2.9 Reddit
2.9.1 Business Overview
2.9.2 Key Information
2.9.3 Company Focus on Social Networking App Market
2.9.4 Strategic Insights
2.9.5 Strategy Deployed
2.9.6 Product & Service Portfolio
2.9.7 Capability Overview
2.9.8 Technology & Innovation Focus
2.9.9 SWOT Analysis
2.9.10 Customers / End Users
2.9.11 Competitive Positioning
2.9.12 Key Differentiators
2.9.13 Portfolio Matrix
2.9.14 Analyst View
2.9.15 Future Outlook
2.10 X Corp.
2.10.1 Business Overview
2.10.2 Key Information
2.10.3 Company Focus on Social Networking App Market
2.10.4 Strategic Insights
2.10.5 Strategy Deployed
2.10.6 Product & Service Portfolio
2.10.7 Capability Overview
2.10.8 Technology & Innovation Focus
2.10.9 SWOT Analysis
2.10.10 Customers / End Users
2.10.11 Competitive Positioning
2.10.12 Key Differentiators
2.10.13 Portfolio Matrix
2.10.14 Analyst View
2.10.15 Future Outlook
Table 1 Asia Pacific Social Networking App Market Market, 2022 - 2033, USD Million
Table 2 Asia Pacific Social Networking App Market Market by Device Type, 2022 - 2033, USD Million
Table 3 Asia Pacific Other Device Type Market, 2022 - 2033, USD Million
Table 4 Asia Pacific Smartphones Market, 2022 - 2033, USD Million
Table 5 Asia Pacific Social Networking App Market Market by Marketplace, 2022 - 2033, USD Million
Table 6 Asia Pacific Apple App Store Market, 2022 - 2033, USD Million
Table 7 Asia Pacific Google Play Store Market, 2022 - 2033, USD Million
Table 8 Asia Pacific Microsoft Store Market, 2022 - 2033, USD Million
Table 9 Asia Pacific Other Marketplace Market, 2022 - 2033, USD Million
Table 10 Asia Pacific Social Networking App Market Market by Revenue Source, 2022 - 2033, USD Million
Table 11 Asia Pacific Advertising Market, 2022 - 2033, USD Million
Table 12 Asia Pacific In-App Purchase Market, 2022 - 2033, USD Million
Table 13 Asia Pacific Paid App Market, 2022 - 2033, USD Million
Table 14 China Social Networking App Market Market, 2022 - 2033, USD Million
Table 15 China Social Networking App Market Market by Device Type, 2022 - 2033, USD Million
Table 16 China Other Device Type Market, 2022 - 2033, USD Million
Table 17 China Smartphones Market, 2022 - 2033, USD Million
Table 18 China Social Networking App Market Market by Marketplace, 2022 - 2033, USD Million
Table 19 China Apple App Store Market, 2022 - 2033, USD Million
Table 20 China Google Play Store Market, 2022 - 2033, USD Million
Table 21 China Microsoft Store Market, 2022 - 2033, USD Million
Table 22 China Other Marketplace Market, 2022 - 2033, USD Million
Table 23 China Social Networking App Market Market by Revenue Source, 2022 - 2033, USD Million
Table 24 China Advertising Market, 2022 - 2033, USD Million
Table 25 China In-App Purchase Market, 2022 - 2033, USD Million
Table 26 China Paid App Market, 2022 - 2033, USD Million
Table 27 Japan Social Networking App Market Market, 2022 - 2033, USD Million
Table 28 Japan Social Networking App Market Market by Device Type, 2022 - 2033, USD Million
Table 29 Japan Other Device Type Market, 2022 - 2033, USD Million
Table 30 Japan Smartphones Market, 2022 - 2033, USD Million
Table 31 Japan Social Networking App Market Market by Marketplace, 2022 - 2033, USD Million
Table 32 Japan Apple App Store Market, 2022 - 2033, USD Million
Table 33 Japan Google Play Store Market, 2022 - 2033, USD Million
Table 34 Japan Microsoft Store Market, 2022 - 2033, USD Million
Table 35 Japan Other Marketplace Market, 2022 - 2033, USD Million
Table 36 Japan Social Networking App Market Market by Revenue Source, 2022 - 2033, USD Million
Table 37 Japan Advertising Market, 2022 - 2033, USD Million
Table 38 Japan In-App Purchase Market, 2022 - 2033, USD Million
Table 39 Japan Paid App Market, 2022 - 2033, USD Million
Table 40 India Social Networking App Market Market, 2022 - 2033, USD Million
Table 41 India Social Networking App Market Market by Device Type, 2022 - 2033, USD Million
Table 42 India Other Device Type Market, 2022 - 2033, USD Million
Table 43 India Smartphones Market, 2022 - 2033, USD Million
Table 44 India Social Networking App Market Market by Marketplace, 2022 - 2033, USD Million
Table 45 India Apple App Store Market, 2022 - 2033, USD Million
Table 46 India Google Play Store Market, 2022 - 2033, USD Million
Table 47 India Microsoft Store Market, 2022 - 2033, USD Million
Table 48 India Other Marketplace Market, 2022 - 2033, USD Million
Table 49 India Social Networking App Market Market by Revenue Source, 2022 - 2033, USD Million
Table 50 India Advertising Market, 2022 - 2033, USD Million
Table 51 India In-App Purchase Market, 2022 - 2033, USD Million
Table 52 India Paid App Market, 2022 - 2033, USD Million
Table 53 South Korea Social Networking App Market Market, 2022 - 2033, USD Million
Table 54 South Korea Social Networking App Market Market by Device Type, 2022 - 2033, USD Million
Table 55 South Korea Other Device Type Market, 2022 - 2033, USD Million
Table 56 South Korea Smartphones Market, 2022 - 2033, USD Million
Table 57 South Korea Social Networking App Market Market by Marketplace, 2022 - 2033, USD Million
Table 58 South Korea Apple App Store Market, 2022 - 2033, USD Million
Table 59 South Korea Google Play Store Market, 2022 - 2033, USD Million
Table 60 South Korea Microsoft Store Market, 2022 - 2033, USD Million
Table 61 South Korea Other Marketplace Market, 2022 - 2033, USD Million
Table 62 South Korea Social Networking App Market Market by Revenue Source, 2022 - 2033, USD Million
Table 63 South Korea Advertising Market, 2022 - 2033, USD Million
Table 64 South Korea In-App Purchase Market, 2022 - 2033, USD Million
Table 65 South Korea Paid App Market, 2022 - 2033, USD Million
Table 66 Singapore Social Networking App Market Market, 2022 - 2033, USD Million
Table 67 Singapore Social Networking App Market Market by Device Type, 2022 - 2033, USD Million
Table 68 Singapore Other Device Type Market, 2022 - 2033, USD Million
Table 69 Singapore Smartphones Market, 2022 - 2033, USD Million
Table 70 Singapore Social Networking App Market Market by Marketplace, 2022 - 2033, USD Million
Table 71 Singapore Apple App Store Market, 2022 - 2033, USD Million
Table 72 Singapore Google Play Store Market, 2022 - 2033, USD Million
Table 73 Singapore Microsoft Store Market, 2022 - 2033, USD Million
Table 74 Singapore Other Marketplace Market, 2022 - 2033, USD Million
Table 75 Singapore Social Networking App Market Market by Revenue Source, 2022 - 2033, USD Million
Table 76 Singapore Advertising Market, 2022 - 2033, USD Million
Table 77 Singapore In-App Purchase Market, 2022 - 2033, USD Million
Table 78 Singapore Paid App Market, 2022 - 2033, USD Million
Table 79 Malaysia Social Networking App Market Market, 2022 - 2033, USD Million
Table 80 Malaysia Social Networking App Market Market by Device Type, 2022 - 2033, USD Million
Table 81 Malaysia Other Device Type Market, 2022 - 2033, USD Million
Table 82 Malaysia Smartphones Market, 2022 - 2033, USD Million
Table 83 Malaysia Social Networking App Market Market by Marketplace, 2022 - 2033, USD Million
Table 84 Malaysia Apple App Store Market, 2022 - 2033, USD Million
Table 85 Malaysia Google Play Store Market, 2022 - 2033, USD Million
Table 86 Malaysia Microsoft Store Market, 2022 - 2033, USD Million
Table 87 Malaysia Other Marketplace Market, 2022 - 2033, USD Million
Table 88 Malaysia Social Networking App Market Market by Revenue Source, 2022 - 2033, USD Million
Table 89 Malaysia Advertising Market, 2022 - 2033, USD Million
Table 90 Malaysia In-App Purchase Market, 2022 - 2033, USD Million
Table 91 Malaysia Paid App Market, 2022 - 2033, USD Million
Table 92 Rest of Asia Pacific Social Networking App Market Market, 2022 - 2033, USD Million
Table 93 Rest of Asia Pacific Social Networking App Market Market by Device Type, 2022 - 2033, USD Million
Table 94 Rest of Asia Pacific Other Device Type Market, 2022 - 2033, USD Million
Table 95 Rest of Asia Pacific Smartphones Market, 2022 - 2033, USD Million
Table 96 Rest of Asia Pacific Social Networking App Market Market by Marketplace, 2022 - 2033, USD Million
Table 97 Rest of Asia Pacific Apple App Store Market, 2022 - 2033, USD Million
Table 98 Rest of Asia Pacific Google Play Store Market, 2022 - 2033, USD Million
Table 99 Rest of Asia Pacific Microsoft Store Market, 2022 - 2033, USD Million
Table 100 Rest of Asia Pacific Other Marketplace Market, 2022 - 2033, USD Million
Table 101 Rest of Asia Pacific Social Networking App Market Market by Revenue Source, 2022 - 2033, USD Million
Table 102 Rest of Asia Pacific Advertising Market, 2022 - 2033, USD Million
Table 103 Rest of Asia Pacific In-App Purchase Market, 2022 - 2033, USD Million
Table 104 Rest of Asia Pacific Paid App Market, 2022 - 2033, USD Million
List of Figures
FIG 1 Key Factors Impacting Market
FIG 2 Market Consolidation
FIG 3 Key Customer Criteria
FIG 4 Product Life Cycle
FIG 5 Asia Pacific Social Networking App Market Market, 2022 - 2033, USD Million
FIG 6 Asia Pacific Social Networking App Market Market by Device Type, 2022 - 2033, USD Million
FIG 7 Asia Pacific Other Device Type Market, 2022 - 2033, USD Million
FIG 8 Asia Pacific Smartphones Market, 2022 - 2033, USD Million
FIG 9 Asia Pacific Social Networking App Market Market by Marketplace, 2022 - 2033, USD Million
FIG 10 Asia Pacific Apple App Store Market, 2022 - 2033, USD Million
FIG 11 Asia Pacific Google Play Store Market, 2022 - 2033, USD Million
FIG 12 Asia Pacific Microsoft Store Market, 2022 - 2033, USD Million
FIG 13 Asia Pacific Other Marketplace Market, 2022 - 2033, USD Million
FIG 14 Asia Pacific Social Networking App Market Market by Revenue Source, 2022 - 2033, USD Million
FIG 15 Asia Pacific Advertising Market, 2022 - 2033, USD Million
FIG 16 Asia Pacific In-App Purchase Market, 2022 - 2033, USD Million
FIG 17 Asia Pacific Paid App Market, 2022 - 2033, USD Million
FIG 18 China Social Networking App Market Market, 2022 - 2033, USD Million
FIG 19 China Social Networking App Market Market by Device Type, 2022 - 2033, USD Million
FIG 20 China Other Device Type Market, 2022 - 2033, USD Million
FIG 21 China Smartphones Market, 2022 - 2033, USD Million
FIG 22 China Social Networking App Market Market by Marketplace, 2022 - 2033, USD Million
FIG 23 China Apple App Store Market, 2022 - 2033, USD Million
FIG 24 China Google Play Store Market, 2022 - 2033, USD Million
FIG 25 China Microsoft Store Market, 2022 - 2033, USD Million
FIG 26 China Other Marketplace Market, 2022 - 2033, USD Million
FIG 27 China Social Networking App Market Market by Revenue Source, 2022 - 2033, USD Million
FIG 28 China Advertising Market, 2022 - 2033, USD Million
FIG 29 China In-App Purchase Market, 2022 - 2033, USD Million
FIG 30 China Paid App Market, 2022 - 2033, USD Million
FIG 31 Japan Social Networking App Market Market, 2022 - 2033, USD Million
FIG 32 Japan Social Networking App Market Market by Device Type, 2022 - 2033, USD Million
FIG 33 Japan Other Device Type Market, 2022 - 2033, USD Million
FIG 34 Japan Smartphones Market, 2022 - 2033, USD Million
FIG 35 Japan Social Networking App Market Market by Marketplace, 2022 - 2033, USD Million
FIG 36 Japan Apple App Store Market, 2022 - 2033, USD Million
FIG 37 Japan Google Play Store Market, 2022 - 2033, USD Million
FIG 38 Japan Microsoft Store Market, 2022 - 2033, USD Million
FIG 39 Japan Other Marketplace Market, 2022 - 2033, USD Million
FIG 40 Japan Social Networking App Market Market by Revenue Source, 2022 - 2033, USD Million
FIG 41 Japan Advertising Market, 2022 - 2033, USD Million
FIG 42 Japan In-App Purchase Market, 2022 - 2033, USD Million
FIG 43 Japan Paid App Market, 2022 - 2033, USD Million
FIG 44 India Social Networking App Market Market, 2022 - 2033, USD Million
FIG 45 India Social Networking App Market Market by Device Type, 2022 - 2033, USD Million
FIG 46 India Other Device Type Market, 2022 - 2033, USD Million
FIG 47 India Smartphones Market, 2022 - 2033, USD Million
FIG 48 India Social Networking App Market Market by Marketplace, 2022 - 2033, USD Million
FIG 49 India Apple App Store Market, 2022 - 2033, USD Million
FIG 50 India Google Play Store Market, 2022 - 2033, USD Million
FIG 51 India Microsoft Store Market, 2022 - 2033, USD Million
FIG 52 India Other Marketplace Market, 2022 - 2033, USD Million
FIG 53 India Social Networking App Market Market by Revenue Source, 2022 - 2033, USD Million
FIG 54 India Advertising Market, 2022 - 2033, USD Million
FIG 55 India In-App Purchase Market, 2022 - 2033, USD Million
FIG 56 India Paid App Market, 2022 - 2033, USD Million
FIG 57 South Korea Social Networking App Market Market, 2022 - 2033, USD Million
FIG 58 South Korea Social Networking App Market Market by Device Type, 2022 - 2033, USD Million
FIG 59 South Korea Other Device Type Market, 2022 - 2033, USD Million
FIG 60 South Korea Smartphones Market, 2022 - 2033, USD Million
FIG 61 South Korea Social Networking App Market Market by Marketplace, 2022 - 2033, USD Million
FIG 62 South Korea Apple App Store Market, 2022 - 2033, USD Million
FIG 63 South Korea Google Play Store Market, 2022 - 2033, USD Million
FIG 64 South Korea Microsoft Store Market, 2022 - 2033, USD Million
FIG 65 South Korea Other Marketplace Market, 2022 - 2033, USD Million
FIG 66 South Korea Social Networking App Market Market by Revenue Source, 2022 - 2033, USD Million
FIG 67 South Korea Advertising Market, 2022 - 2033, USD Million
FIG 68 South Korea In-App Purchase Market, 2022 - 2033, USD Million
FIG 69 South Korea Paid App Market, 2022 - 2033, USD Million
FIG 70 Singapore Social Networking App Market Market, 2022 - 2033, USD Million
FIG 71 Singapore Social Networking App Market Market by Device Type, 2022 - 2033, USD Million
FIG 72 Singapore Other Device Type Market, 2022 - 2033, USD Million
FIG 73 Singapore Smartphones Market, 2022 - 2033, USD Million
FIG 74 Singapore Social Networking App Market Market by Marketplace, 2022 - 2033, USD Million
FIG 75 Singapore Apple App Store Market, 2022 - 2033, USD Million
FIG 76 Singapore Google Play Store Market, 2022 - 2033, USD Million
FIG 77 Singapore Microsoft Store Market, 2022 - 2033, USD Million
FIG 78 Singapore Other Marketplace Market, 2022 - 2033, USD Million
FIG 79 Singapore Social Networking App Market Market by Revenue Source, 2022 - 2033, USD Million
FIG 80 Singapore Advertising Market, 2022 - 2033, USD Million
FIG 81 Singapore In-App Purchase Market, 2022 - 2033, USD Million
FIG 82 Singapore Paid App Market, 2022 - 2033, USD Million
FIG 83 Malaysia Social Networking App Market Market, 2022 - 2033, USD Million
FIG 84 Malaysia Social Networking App Market Market by Device Type, 2022 - 2033, USD Million
FIG 85 Malaysia Other Device Type Market, 2022 - 2033, USD Million
FIG 86 Malaysia Smartphones Market, 2022 - 2033, USD Million
FIG 87 Malaysia Social Networking App Market Market by Marketplace, 2022 - 2033, USD Million
FIG 88 Malaysia Apple App Store Market, 2022 - 2033, USD Million
FIG 89 Malaysia Google Play Store Market, 2022 - 2033, USD Million
FIG 90 Malaysia Microsoft Store Market, 2022 - 2033, USD Million
FIG 91 Malaysia Other Marketplace Market, 2022 - 2033, USD Million
FIG 92 Malaysia Social Networking App Market Market by Revenue Source, 2022 - 2033, USD Million
FIG 93 Malaysia Advertising Market, 2022 - 2033, USD Million
FIG 94 Malaysia In-App Purchase Market, 2022 - 2033, USD Million
FIG 95 Malaysia Paid App Market, 2022 - 2033, USD Million
FIG 96 Rest of Asia Pacific Social Networking App Market Market, 2022 - 2033, USD Million
FIG 97 Rest of Asia Pacific Social Networking App Market Market by Device Type, 2022 - 2033, USD Million
FIG 98 Rest of Asia Pacific Other Device Type Market, 2022 - 2033, USD Million
FIG 99 Rest of Asia Pacific Smartphones Market, 2022 - 2033, USD Million
FIG 100 Rest of Asia Pacific Social Networking App Market Market by Marketplace, 2022 - 2033, USD Million
FIG 101 Rest of Asia Pacific Apple App Store Market, 2022 - 2033, USD Million
FIG 102 Rest of Asia Pacific Google Play Store Market, 2022 - 2033, USD Million
FIG 103 Rest of Asia Pacific Microsoft Store Market, 2022 - 2033, USD Million
FIG 104 Rest of Asia Pacific Other Marketplace Market, 2022 - 2033, USD Million
FIG 105 Rest of Asia Pacific Social Networking App Market Market by Revenue Source, 2022 - 2033, USD Million
FIG 106 Rest of Asia Pacific Advertising Market, 2022 - 2033, USD Million
FIG 107 Rest of Asia Pacific In-App Purchase Market, 2022 - 2033, USD Million
FIG 108 Rest of Asia Pacific Paid App Market, 2022 - 2033, USD Million