Europe Technical SEO Services Market Size, Share & Industry Analysis Report By Enterprise Size (Large Enterprises, and Small and Medium Enterprises), By Service Type (On-Page, Technical, Local and Hyperlocal, and Off-Page), By End-User Industry (Retail and E-Commerce, IT and Telecom, and BFSI), By Country Outlook and Forecast, 2026 - 2033
Published Date : 02-Sep-2026 |
Pages: 308 |
Report Format: PDF + Excel |
COVID-19 Impact on the Europe Technical SEO Services Market
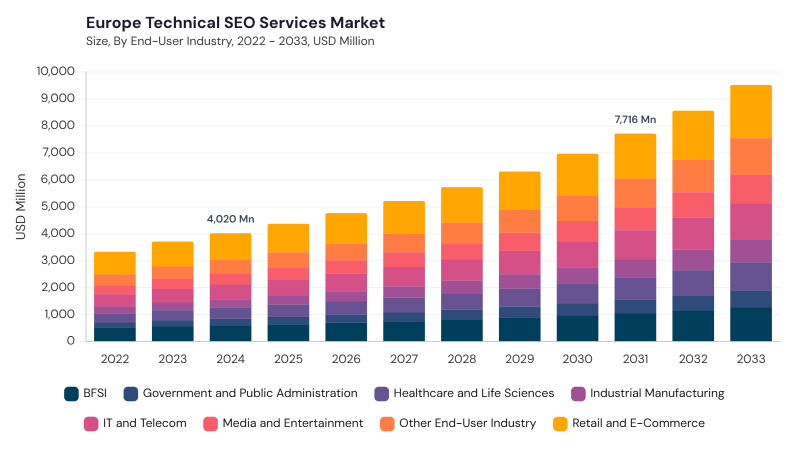
The Europe Technical SEO Services Market is expected to reach USD 7.7 billion by 2031, growing at a CAGR of 10.4% during (2026 – 2033).
The Europe Technical SEO Services Market evolved from early SEO practices focused on basic website indexing, metadata usage, and keyword-oriented optimization. As search engines advanced, the market shifted toward complex technical requirements such as structured data, mobile-first indexing, site speed, URL structuring, server log analysis, and JavaScript rendering. The adoption of automated audits, machine learning, and performance monitoring platforms further expanded technical SEO into a specialized digital service area.
The Europe Technical SEO Services Market is being shaped by Core Web Vitals optimization, mobile-first indexing, AI-driven automation, multilingual SEO, GDPR compliance, and rising demand for cross-border digital visibility. Businesses are adopting technical SEO services to improve crawlability, indexability, structured data, site architecture, page speed, mobile responsiveness, privacy-safe tracking, and regional search performance. Demand is supported by large enterprises, SMEs, retail and e-commerce, BFSI, IT and telecom, healthcare, media, manufacturing, government, and other digital-first sectors. Providers are focusing on AI-powered audits, hreflang implementation, schema optimization, privacy-conscious SEO, localized search strategies, and scalable technical monitoring.
Enterprise Size Outlook
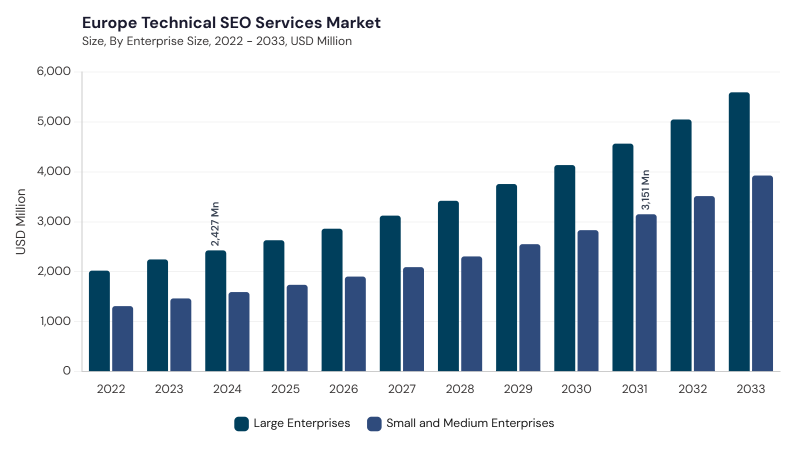
Based on Enterprise Size, the market is segmented into Large Enterprises and Small and Medium Enterprises. The Large Enterprises market dominated the Europe Technical SEO Services Market by Enterprise Size in 2025, and would continue to be a dominant market till 2033; thereby, achieving a market value of USD 4.5 billion by 2031, growing at a CAGR of 10 % during the forecast period. The Small and Medium Enterprises market is expected to witness a CAGR of 10.9% during (2026 - 2033).
Large Enterprises lead due to their need to manage multilingual websites, multiple domains, complex e-commerce platforms, large-scale content structures, and cross-border digital visibility. These organizations require advanced technical audits, AI-enabled monitoring, structured data, Core Web Vitals improvements, server-side optimization, and GDPR-aligned technical SEO practices. Small and Medium Enterprises remain significant as affordable SEO platforms, modular services, and localized optimization help smaller businesses improve online visibility. This segment benefits from cost-effective audits, mobile optimization, local search improvements, structured data, and measurable traffic-focused technical enhancements.
Service Type Outlook
Based on Service Type, the market is segmented into On-Page, Off-Page, Technical, and Local and Hyperlocal. The On-Page market dominated the Europe Technical SEO Services Market by Service Type in 2025, and would continue to be a dominant market till 2033; thereby, achieving a market value of USD 2.3 billion by 2031, growing at a CAGR of 9.5 % during the forecast period. The Off-Page market is expected to witness a CAGR of 10.6% during (2026 - 2033). Additionally, The Technical market is expected to witness highest CAGR of 10.8% during (2026 - 2033).
On-Page leads due to increasing investment in content optimization, metadata enhancement, internal linking, structured data, mobile responsiveness, page speed, content hierarchy, and multilingual tag configuration. This service type supports accurate indexing, better user experience, and stronger organic visibility across country-specific and language-specific websites. Off-Page remains significant as companies focus on backlink quality, toxic link removal, authority building, syndicated content management, and brand credibility. Technical continues to gain traction through audits covering crawlability, indexation, XML sitemaps, robots.txt, JavaScript rendering, HTTPS, server performance, redirects, and site architecture. Local and Hyperlocal supports location-based search, business profile management, local schema, map visibility, citation accuracy, and geographically structured URLs.
End-User Industry Outlook
Based on End-User Industry, the market is segmented into Retail and E-Commerce, BFSI, IT and Telecom, Healthcare and Life Sciences, Media and Entertainment, Industrial Manufacturing, Government and Public Administration, and Other End-User Industry. Retail and E-Commerce leads due to intense online competition, large product catalogs, mobile shopping, seasonal updates, structured data needs, site speed optimization, and crawl efficiency requirements. BFSI remains significant as banks and financial platforms require secure site structures, GDPR compliance, mobile optimization, fast access, and reliable indexing of complex service information.
IT and Telecom uses technical SEO to improve visibility for software, cloud, telecom, and technical documentation. Healthcare and Life Sciences focuses on compliant, accessible, and trusted digital health content, while Media and Entertainment depends on multimedia indexing, CDN performance, and crawl budget management. Industrial Manufacturing, Government and Public Administration, and Other End-User Industry use technical SEO to improve B2B visibility, public service access, digital outreach, lead generation, and localized engagement.
Free Valuable Insights: The Worldwide Technical SEO Services Market is projected to reach USD 33.7 Billion billion by 2033, at a CAGR of 10.6%
Country Outlook
Based on Country, the market is segmented into Germany, UK, France, Russia, Spain, Italy, and Rest of Europe. The UK market dominated the Europe Technical SEO Services Market by Country in 2025, and would continue to be a dominant market till 2033; thereby, achieving a market value of USD 1.4 billion by 2031, growing at a CAGR of 8.8 % during the forecast period. The Germany market is expected to witness a CAGR of 9.4% during (2026 - 2033). Additionally, The France market is expected to witness a CAGR of 11.2% during (2026 - 2033).
Germany leads due to strong digital maturity, localized SEO expertise, real-time monitoring, AI-enabled audits, multilingual optimization, and strict data privacy alignment. The UK supports market growth through Core Web Vitals optimization, mobile-first SEO, AI-powered diagnostics, local and hyperlocal SEO, and advanced site audit capabilities. France contributes through mobile and voice search optimization, GDPR-focused technical SEO, structured data, and secure site architecture. Russia, Spain, and Italy add momentum through regional customization, mobile optimization, AI-based audits, structured data, multilingual SEO, and automation, while Rest of Europe benefits from cross-border SEO, privacy-safe tracking, voice search readiness, and localized technical optimization.
List of Key Companies Profiled
- Dentsu Group Inc.
- Publicis Groupe S.A.
- WebFX, Inc.
- NP Digital
- Brainlabs
- Seer Interactive, Inc.
- Wpromote, LLC
- Ignite Visibility LLC
- Victorious SEO
- Builtvisible Ltd.
Europe Technical SEO Services Market Report Segmentation
By Enterprise Size
- Large Enterprises
- Small and Medium Enterprises
By Service Type
- On-Page
- Off-Page
- Technical
- Local and Hyperlocal
By End-User Industry
- Retail and E-Commerce
- BFSI
- IT and Telecom
- Healthcare and Life Sciences
- Media and Entertainment
- Industrial Manufacturing
- Government and Public Administration
- Other End-User Industry
By Country
- Germany
- UK
- France
- Russia
- Spain
- Italy
- Rest of Europe
1.1 Market Overview
1.2 Key Factors Impacting Market
1.2.1 Market Drivers
1.2.2 Market Restraints
1.2.3 Market Opportunities
1.2.4 Market Challenges
1.2.5 Market Trends
1.2.6 State of Competition
1.2.7 Market Consolidation
1.2.8 Key Customer Criteria
1.3 Product Life Cycle
1.4 Segmentation By Deployment
1.4.1 Cloud
1.4.2 On-premise
1.5 Segmentation By Component
1.5.1 Solutions
1.5.2 Services
1.6 Segmentation By End Use
1.6.1 Manufacturing
1.6.2 Retail
1.6.3 Transportation & Logistics
1.6.4 Government
1.6.5 Energy
1.6.6 Healthcare
1.6.7 Other End Uses
1.7 Segmentation By Country
1.7.1 Germany
1.7.1.1 Segmentation By Deployment
1.7.1.1.1 On-premise
1.7.1.1.2 Cloud
1.7.1.2 Segmentation By Component
1.7.1.2.1 Solutions
1.7.1.2.2 Services
1.7.1.3 Segmentation By End Use
1.7.1.3.1 Manufacturing
1.7.1.3.2 Retail
1.7.1.3.3 Transportation & Logistics
1.7.1.3.4 Government
1.7.1.3.5 Energy
1.7.1.3.6 Healthcare
1.7.1.3.7 Other End Uses
1.7.2 UK
1.7.2.1 Segmentation By Deployment
1.7.2.1.1 On-premise
1.7.2.1.2 Cloud
1.7.2.2 Segmentation By Component
1.7.2.2.1 Solutions
1.7.2.2.2 Services
1.7.2.3 Segmentation By End Use
1.7.2.3.1 Manufacturing
1.7.2.3.2 Retail
1.7.2.3.3 Transportation & Logistics
1.7.2.3.4 Government
1.7.2.3.5 Energy
1.7.2.3.6 Healthcare
1.7.2.3.7 Other End Uses
1.7.3 France
1.7.3.1 Segmentation By Deployment
1.7.3.1.1 On-premise
1.7.3.1.2 Cloud
1.7.3.2 Segmentation By Component
1.7.3.2.1 Solutions
1.7.3.2.2 Services
1.7.3.3 Segmentation By End Use
1.7.3.3.1 Manufacturing
1.7.3.3.2 Retail
1.7.3.3.3 Transportation & Logistics
1.7.3.3.4 Government
1.7.3.3.5 Energy
1.7.3.3.6 Healthcare
1.7.3.3.7 Other End Uses
1.7.4 Russia
1.7.4.1 Segmentation By Deployment
1.7.4.1.1 On-premise
1.7.4.1.2 Cloud
1.7.4.2 Segmentation By Component
1.7.4.2.1 Solutions
1.7.4.2.2 Services
1.7.4.3 Segmentation By End Use
1.7.4.3.1 Manufacturing
1.7.4.3.2 Retail
1.7.4.3.3 Transportation & Logistics
1.7.4.3.4 Government
1.7.4.3.5 Energy
1.7.4.3.6 Healthcare
1.7.4.3.7 Other End Uses
1.7.5 Spain
1.7.5.1 Segmentation By Deployment
1.7.5.1.1 On-premise
1.7.5.1.2 Cloud
1.7.5.2 Segmentation By Component
1.7.5.2.1 Solutions
1.7.5.2.2 Services
1.7.5.3 Segmentation By End Use
1.7.5.3.1 Manufacturing
1.7.5.3.2 Retail
1.7.5.3.3 Transportation & Logistics
1.7.5.3.4 Government
1.7.5.3.5 Energy
1.7.5.3.6 Healthcare
1.7.5.3.7 Other End Uses
1.7.6 Italy
1.7.6.1 Segmentation By Deployment
1.7.6.1.1 On-premise
1.7.6.1.2 Cloud
1.7.6.2 Segmentation By Component
1.7.6.2.1 Solutions
1.7.6.2.2 Services
1.7.6.3 Segmentation By End Use
1.7.6.3.1 Manufacturing
1.7.6.3.2 Retail
1.7.6.3.3 Transportation & Logistics
1.7.6.3.4 Government
1.7.6.3.5 Energy
1.7.6.3.6 Healthcare
1.7.6.3.7 Other End Uses
1.7.7 Rest of Europe
1.7.7.1 Segmentation By Deployment
1.7.7.1.1 On-premise
1.7.7.1.2 Cloud
1.7.7.2 Segmentation By Component
1.7.7.2.1 Solutions
1.7.7.2.2 Services
1.7.7.3 Segmentation By End Use
1.7.7.3.1 Manufacturing
1.7.7.3.2 Retail
1.7.7.3.3 Transportation & Logistics
1.7.7.3.4 Government
1.7.7.3.5 Energy
1.7.7.3.6 Healthcare
1.7.7.3.7 Other End Uses
Chapter 2. Company Snapshots
2.1 SAP SE
2.1.1 Business Overview
2.1.2 Key Information
2.1.3 Company Focus on Trade Management Software Market
2.1.4 Strategic Insights
2.1.5 Strategy Deployed for Trade Management Software Market
2.1.6 Product & Service Portfolio
2.1.7 Key Products / Services
2.1.8 Capability Overview
2.1.9 Technology & Innovation Focus
2.1.10 Customers / End Users
2.1.11 Competitive Positioning
2.1.12 Key Differentiators
2.1.13 Portfolio Matrix
2.1.14 Analyst View
2.1.15 SWOT Analysis
2.1.16 Future Outlook
2.2 Oracle Corporation
2.2.1 Business Overview
2.2.2 Key Information
2.2.3 Company Focus on Trade Management Software Market
2.2.4 Strategic Insights
2.2.5 Strategy Deployed
2.2.6 Product & Service Portfolio
2.2.7 Key Products / Services
2.2.8 Capability Overview
2.2.9 Technology & Innovation Focus
2.2.10 Customers / End Users
2.2.11 Competitive Positioning
2.2.12 Key Differentiators
2.2.13 Portfolio Matrix
2.2.14 Analyst View
2.2.15 SWOT Analysis
2.2.16 Future Outlook
2.3 e2open Parent Holdings, Inc.
2.3.1 Business Overview
2.3.2 Key Information
2.3.3 Company Focus on Trade Management Software Market
2.3.4 Strategic Insights
2.3.5 Strategy Deployed
2.3.6 Product & Service Portfolio
2.3.7 Key Products / Services
2.3.8 Capability Overview
2.3.9 Technology & Innovation Focus
2.3.10 Customers / End Users
2.3.11 Competitive Positioning
2.3.12 Key Differentiators
2.3.13 Portfolio Matrix
2.3.14 Analyst View
2.3.15 SWOT Analysis
2.3.16 Future Outlook
2.4 Thomson Reuters Corporation
2.4.1 Business Overview
2.4.2 Key Information
2.4.3 Company Focus on Trade Management Software Market
2.4.4 Strategic Insights
2.4.5 Strategy Deployed
2.4.6 Product & Service Portfolio
2.4.7 Key Products / Services
2.4.8 Capability Overview
2.4.9 Technology & Innovation Focus
2.4.10 Customers / End Users
2.4.11 Competitive Positioning
2.4.12 Key Differentiators
2.4.13 Portfolio Matrix
2.4.14 Analyst View
2.4.15 SWOT Analysis
2.4.16 Future Outlook
2.5 Descartes Systems Group Inc.
2.5.1 Business Overview
2.5.2 Key Information
2.5.3 Company Focus on Trade Management Software Market
2.5.4 Strategic Insights
2.5.5 Strategy Deployed
2.5.6 Product & Service Portfolio
2.5.7 Key Products / Services
2.5.8 Capability Overview
2.5.9 Technology & Innovation Focus
2.5.10 Customers / End Users
2.5.11 Competitive Positioning
2.5.12 Key Differentiators
2.5.13 Portfolio Matrix
2.5.14 Analyst View
2.5.15 SWOT Analysis
2.5.16 Future Outlook
2.6 WiseTech Global Limited
2.6.1 Business Overview
2.6.2 Key Information
2.6.3 Company Focus on Trade Management Software Market
2.6.4 Strategic Insights
2.6.5 Strategy Deployed
2.6.6 Product & Service Portfolio
2.6.7 Key Products / Services
2.6.8 Capability Overview
2.6.9 Technology & Innovation Focus
2.6.10 Customers / End Users
2.6.11 Competitive Positioning
2.6.12 Key Differentiators
2.6.13 Portfolio Matrix
2.6.14 Analyst View
2.6.15 SWOT Analysis
2.6.16 Future Outlook
2.7 Infor, Inc.
2.7.1 Business Overview
2.7.2 Key Information
2.7.3 Company Focus on Trade Management Software Market
2.7.4 Strategic Insights
2.7.5 Strategy Deployed
2.7.6 Product & Service Portfolio
2.7.7 Key Products / Services
2.7.8 Capability Overview 2.7.9 Technology & Innovation Focus
2.7.10 Customers / End Users
2.7.11 Competitive Positioning
2.7.12 Key Differentiators
2.7.13 Portfolio Matrix
2.7.14 Analyst View
2.7.15 SWOT Analysis
2.7.16 Future Outlook
2.8 QAD Inc.
2.8.1 Business Overview
2.8.2 Key Information
2.8.3 Company Focus on Trade Management Software Market
2.8.4 Strategic Insights
2.8.5 Strategy Deployed
2.8.6 Product & Service Portfolio
2.8.7 Key Products / Services
2.8.8 Capability Overview
2.8.9 Technology & Innovation Focus
2.8.10 Customers / End Users
2.8.11 Competitive Positioning
2.8.12 Key Differentiators
2.8.13 Portfolio Matrix
2.8.14 Analyst View
2.8.15 SWOT Analysis
2.8.16 Future Outlook
2.9 MIC Datenverarbeitung GmbH
2.9.1 Business Overview
2.9.2 Key Information
2.9.3 Company Focus on Trade Management Software Market
2.9.4 Strategic Insights
2.9.5 Strategy Deployed
2.9.6 Product & Service Portfolio
2.9.7 Key Products / Services
2.9.8 Capability Overview
2.9.9 Technology & Innovation Focus
2.9.10 Customers / End Users
2.9.11 Competitive Positioning
2.9.12 Key Differentiators
2.9.13 Portfolio Matrix
2.9.14 Analyst View
2.9.15 SWOT Analysis
2.9.16 Future Outlook
2.10 Bamboo Rose LLC
2.10.1 Business Overview
2.10.2 Key Information
2.10.3 Company Focus on Trade Management Software Market
2.10.4 Strategic Insights
2.10.5 Strategy Deployed
2.10.6 Product & Service Portfolio
2.10.7 Key Products / Services
2.10.8 Capability Overview
2.10.9 Technology & Innovation Focus
2.10.10 Customers / End Users
2.10.11 Competitive Positioning
2.10.12 Key Differentiators
2.10.13 Portfolio Matrix
2.10.14 Analyst View
2.10.15 SWOT Analysis
2.10.16 Future Outlook
Table 1 Europe Trade Management Software Market Market, 2022 - 2033, USD Million
Table 2 Europe Trade Management Software Market Market by Component, 2022 - 2033, USD Million
Table 3 Europe Services Market, 2022 - 2033, USD Million
Table 4 Europe Solutions Market, 2022 - 2033, USD Million
Table 5 Europe Trade Management Software Market Market by Deployment, 2022 - 2033, USD Million
Table 6 Europe Cloud Market, 2022 - 2033, USD Million
Table 7 Europe On-premise Market, 2022 - 2033, USD Million
Table 8 Europe Trade Management Software Market Market by End Use, 2022 - 2033, USD Million
Table 9 Europe Energy Market, 2022 - 2033, USD Million
Table 10 Europe Government Market, 2022 - 2033, USD Million
Table 11 Europe Healthcare Market, 2022 - 2033, USD Million
Table 12 Europe Manufacturing Market, 2022 - 2033, USD Million
Table 13 Europe Other End Uses Market, 2022 - 2033, USD Million
Table 14 Europe Retail Market, 2022 - 2033, USD Million
Table 15 Europe Transportation & logistics Market, 2022 - 2033, USD Million
Table 16 Germany Trade Management Software Market Market, 2022 - 2033, USD Million
Table 17 Germany Trade Management Software Market Market by Component, 2022 - 2033, USD Million
Table 18 Germany Services Market, 2022 - 2033, USD Million
Table 19 Germany Solutions Market, 2022 - 2033, USD Million
Table 20 Germany Trade Management Software Market Market by Deployment, 2022 - 2033, USD Million
Table 21 Germany Cloud Market, 2022 - 2033, USD Million
Table 22 Germany On-premise Market, 2022 - 2033, USD Million
Table 23 Germany Trade Management Software Market Market by End Use, 2022 - 2033, USD Million
Table 24 Germany Energy Market, 2022 - 2033, USD Million
Table 25 Germany Government Market, 2022 - 2033, USD Million
Table 26 Germany Healthcare Market, 2022 - 2033, USD Million
Table 27 Germany Manufacturing Market, 2022 - 2033, USD Million
Table 28 Germany Other End Uses Market, 2022 - 2033, USD Million
Table 29 Germany Retail Market, 2022 - 2033, USD Million
Table 30 Germany Transportation & logistics Market, 2022 - 2033, USD Million
Table 31 United Kingdom Trade Management Software Market Market, 2022 - 2033, USD Million
Table 32 United Kingdom Trade Management Software Market Market by Component, 2022 - 2033, USD Million
Table 33 United Kingdom Services Market, 2022 - 2033, USD Million
Table 34 United Kingdom Solutions Market, 2022 - 2033, USD Million
Table 35 United Kingdom Trade Management Software Market Market by Deployment, 2022 - 2033, USD Million
Table 36 United Kingdom Cloud Market, 2022 - 2033, USD Million
Table 37 United Kingdom On-premise Market, 2022 - 2033, USD Million
Table 38 United Kingdom Trade Management Software Market Market by End Use, 2022 - 2033, USD Million
Table 39 United Kingdom Energy Market, 2022 - 2033, USD Million
Table 40 United Kingdom Government Market, 2022 - 2033, USD Million
Table 41 United Kingdom Healthcare Market, 2022 - 2033, USD Million
Table 42 United Kingdom Manufacturing Market, 2022 - 2033, USD Million
Table 43 United Kingdom Other End Uses Market, 2022 - 2033, USD Million
Table 44 United Kingdom Retail Market, 2022 - 2033, USD Million
Table 45 United Kingdom Transportation & logistics Market, 2022 - 2033, USD Million
Table 46 France Trade Management Software Market Market, 2022 - 2033, USD Million
Table 47 France Trade Management Software Market Market by Component, 2022 - 2033, USD Million
Table 48 France Services Market, 2022 - 2033, USD Million
Table 49 France Solutions Market, 2022 - 2033, USD Million
Table 50 France Trade Management Software Market Market by Deployment, 2022 - 2033, USD Million
Table 51 France Cloud Market, 2022 - 2033, USD Million
Table 52 France On-premise Market, 2022 - 2033, USD Million
Table 53 France Trade Management Software Market Market by End Use, 2022 - 2033, USD Million
Table 54 France Energy Market, 2022 - 2033, USD Million
Table 55 France Government Market, 2022 - 2033, USD Million
Table 56 France Healthcare Market, 2022 - 2033, USD Million
Table 57 France Manufacturing Market, 2022 - 2033, USD Million
Table 58 France Other End Uses Market, 2022 - 2033, USD Million
Table 59 France Retail Market, 2022 - 2033, USD Million
Table 60 France Transportation & logistics Market, 2022 - 2033, USD Million
Table 61 Russia Trade Management Software Market Market, 2022 - 2033, USD Million
Table 62 Russia Trade Management Software Market Market by Component, 2022 - 2033, USD Million
Table 63 Russia Services Market, 2022 - 2033, USD Million
Table 64 Russia Solutions Market, 2022 - 2033, USD Million
Table 65 Russia Trade Management Software Market Market by Deployment, 2022 - 2033, USD Million
Table 66 Russia Cloud Market, 2022 - 2033, USD Million
Table 67 Russia On-premise Market, 2022 - 2033, USD Million
Table 68 Russia Trade Management Software Market Market by End Use, 2022 - 2033, USD Million
Table 69 Russia Energy Market, 2022 - 2033, USD Million
Table 70 Russia Government Market, 2022 - 2033, USD Million
Table 71 Russia Healthcare Market, 2022 - 2033, USD Million
Table 72 Russia Manufacturing Market, 2022 - 2033, USD Million
Table 73 Russia Other End Uses Market, 2022 - 2033, USD Million
Table 74 Russia Retail Market, 2022 - 2033, USD Million
Table 75 Russia Transportation & logistics Market, 2022 - 2033, USD Million
Table 76 Spain Trade Management Software Market Market, 2022 - 2033, USD Million
Table 77 Spain Trade Management Software Market Market by Component, 2022 - 2033, USD Million
Table 78 Spain Services Market, 2022 - 2033, USD Million
Table 79 Spain Solutions Market, 2022 - 2033, USD Million
Table 80 Spain Trade Management Software Market Market by Deployment, 2022 - 2033, USD Million
Table 81 Spain Cloud Market, 2022 - 2033, USD Million
Table 82 Spain On-premise Market, 2022 - 2033, USD Million
Table 83 Spain Trade Management Software Market Market by End Use, 2022 - 2033, USD Million
Table 84 Spain Energy Market, 2022 - 2033, USD Million
Table 85 Spain Government Market, 2022 - 2033, USD Million
Table 86 Spain Healthcare Market, 2022 - 2033, USD Million
Table 87 Spain Manufacturing Market, 2022 - 2033, USD Million
Table 88 Spain Other End Uses Market, 2022 - 2033, USD Million
Table 89 Spain Retail Market, 2022 - 2033, USD Million
Table 90 Spain Transportation & logistics Market, 2022 - 2033, USD Million
Table 91 Italy Trade Management Software Market Market, 2022 - 2033, USD Million
Table 92 Italy Trade Management Software Market Market by Component, 2022 - 2033, USD Million
Table 93 Italy Services Market, 2022 - 2033, USD Million
Table 94 Italy Solutions Market, 2022 - 2033, USD Million
Table 95 Italy Trade Management Software Market Market by Deployment, 2022 - 2033, USD Million
Table 96 Italy Cloud Market, 2022 - 2033, USD Million
Table 97 Italy On-premise Market, 2022 - 2033, USD Million
Table 98 Italy Trade Management Software Market Market by End Use, 2022 - 2033, USD Million
Table 99 Italy Energy Market, 2022 - 2033, USD Million
Table 100 Italy Government Market, 2022 - 2033, USD Million
Table 101 Italy Healthcare Market, 2022 - 2033, USD Million
Table 102 Italy Manufacturing Market, 2022 - 2033, USD Million
Table 103 Italy Other End Uses Market, 2022 - 2033, USD Million
Table 104 Italy Retail Market, 2022 - 2033, USD Million
Table 105 Italy Transportation & logistics Market, 2022 - 2033, USD Million
Table 106 Rest of Europe Trade Management Software Market Market, 2022 - 2033, USD Million
Table 107 Rest of Europe Trade Management Software Market Market by Component, 2022 - 2033, USD Million
Table 108 Rest of Europe Services Market, 2022 - 2033, USD Million
Table 109 Rest of Europe Solutions Market, 2022 - 2033, USD Million
Table 110 Rest of Europe Trade Management Software Market Market by Deployment, 2022 - 2033, USD Million
Table 111 Rest of Europe Cloud Market, 2022 - 2033, USD Million
Table 112 Rest of Europe On-premise Market, 2022 - 2033, USD Million
Table 113 Rest of Europe Trade Management Software Market Market by End Use, 2022 - 2033, USD Million
Table 114 Rest of Europe Energy Market, 2022 - 2033, USD Million
Table 115 Rest of Europe Government Market, 2022 - 2033, USD Million
Table 116 Rest of Europe Healthcare Market, 2022 - 2033, USD Million
Table 117 Rest of Europe Manufacturing Market, 2022 - 2033, USD Million
Table 118 Rest of Europe Other End Uses Market, 2022 - 2033, USD Million
Table 119 Rest of Europe Retail Market, 2022 - 2033, USD Million
Table 120 Rest of Europe Transportation & logistics Market, 2022 - 2033, USD Million
List of Figures
FIG 1 Key Factors Impacting Market
FIG 2 Market Consolidation
FIG 3 Key Customer Criteria
FIG 4 Product Life Cycle
FIG 5 Europe Trade Management Software Market Market, 2022 - 2033, USD Million
FIG 6 Europe Trade Management Software Market Market by Component, 2022 - 2033, USD Million
FIG 7 Europe Services Market, 2022 - 2033, USD Million
FIG 8 Europe Solutions Market, 2022 - 2033, USD Million
FIG 9 Europe Trade Management Software Market Market by Deployment, 2022 - 2033, USD Million
FIG 10 Europe Cloud Market, 2022 - 2033, USD Million
FIG 11 Europe On-premise Market, 2022 - 2033, USD Million
FIG 12 Europe Trade Management Software Market Market by End Use, 2022 - 2033, USD Million
FIG 13 Europe Energy Market, 2022 - 2033, USD Million
FIG 14 Europe Government Market, 2022 - 2033, USD Million
FIG 15 Europe Healthcare Market, 2022 - 2033, USD Million
FIG 16 Europe Manufacturing Market, 2022 - 2033, USD Million
FIG 17 Europe Other End Uses Market, 2022 - 2033, USD Million
FIG 18 Europe Retail Market, 2022 - 2033, USD Million
FIG 19 Europe Transportation & logistics Market, 2022 - 2033, USD Million
FIG 20 Germany Trade Management Software Market Market, 2022 - 2033, USD Million
FIG 21 Germany Trade Management Software Market Market by Component, 2022 - 2033, USD Million
FIG 22 Germany Services Market, 2022 - 2033, USD Million
FIG 23 Germany Solutions Market, 2022 - 2033, USD Million
FIG 24 Germany Trade Management Software Market Market by Deployment, 2022 - 2033, USD Million
FIG 25 Germany Cloud Market, 2022 - 2033, USD Million
FIG 26 Germany On-premise Market, 2022 - 2033, USD Million
FIG 27 Germany Trade Management Software Market Market by End Use, 2022 - 2033, USD Million
FIG 28 Germany Energy Market, 2022 - 2033, USD Million
FIG 29 Germany Government Market, 2022 - 2033, USD Million
FIG 30 Germany Healthcare Market, 2022 - 2033, USD Million
FIG 31 Germany Manufacturing Market, 2022 - 2033, USD Million
FIG 32 Germany Other End Uses Market, 2022 - 2033, USD Million
FIG 33 Germany Retail Market, 2022 - 2033, USD Million
FIG 34 Germany Transportation & logistics Market, 2022 - 2033, USD Million
FIG 35 United Kingdom Trade Management Software Market Market, 2022 - 2033, USD Million
FIG 36 United Kingdom Trade Management Software Market Market by Component, 2022 - 2033, USD Million
FIG 37 United Kingdom Services Market, 2022 - 2033, USD Million
FIG 38 United Kingdom Solutions Market, 2022 - 2033, USD Million
FIG 39 United Kingdom Trade Management Software Market Market by Deployment, 2022 - 2033, USD Million
FIG 40 United Kingdom Cloud Market, 2022 - 2033, USD Million
FIG 41 United Kingdom On-premise Market, 2022 - 2033, USD Million
FIG 42 United Kingdom Trade Management Software Market Market by End Use, 2022 - 2033, USD Million
FIG 43 United Kingdom Energy Market, 2022 - 2033, USD Million
FIG 44 United Kingdom Government Market, 2022 - 2033, USD Million
FIG 45 United Kingdom Healthcare Market, 2022 - 2033, USD Million
FIG 46 United Kingdom Manufacturing Market, 2022 - 2033, USD Million
FIG 47 United Kingdom Other End Uses Market, 2022 - 2033, USD Million
FIG 48 United Kingdom Retail Market, 2022 - 2033, USD Million
FIG 49 United Kingdom Transportation & logistics Market, 2022 - 2033, USD Million
FIG 50 France Trade Management Software Market Market, 2022 - 2033, USD Million
FIG 51 France Trade Management Software Market Market by Component, 2022 - 2033, USD Million
FIG 52 France Services Market, 2022 - 2033, USD Million
FIG 53 France Solutions Market, 2022 - 2033, USD Million
FIG 54 France Trade Management Software Market Market by Deployment, 2022 - 2033, USD Million
FIG 55 France Cloud Market, 2022 - 2033, USD Million
FIG 56 France On-premise Market, 2022 - 2033, USD Million
FIG 57 France Trade Management Software Market Market by End Use, 2022 - 2033, USD Million
FIG 58 France Energy Market, 2022 - 2033, USD Million
FIG 59 France Government Market, 2022 - 2033, USD Million
FIG 60 France Healthcare Market, 2022 - 2033, USD Million
FIG 61 France Manufacturing Market, 2022 - 2033, USD Million
FIG 62 France Other End Uses Market, 2022 - 2033, USD Million
FIG 63 France Retail Market, 2022 - 2033, USD Million
FIG 64 France Transportation & logistics Market, 2022 - 2033, USD Million
FIG 65 Russia Trade Management Software Market Market, 2022 - 2033, USD Million
FIG 66 Russia Trade Management Software Market Market by Component, 2022 - 2033, USD Million
FIG 67 Russia Services Market, 2022 - 2033, USD Million
FIG 68 Russia Solutions Market, 2022 - 2033, USD Million
FIG 69 Russia Trade Management Software Market Market by Deployment, 2022 - 2033, USD Million
FIG 70 Russia Cloud Market, 2022 - 2033, USD Million
FIG 71 Russia On-premise Market, 2022 - 2033, USD Million
FIG 72 Russia Trade Management Software Market Market by End Use, 2022 - 2033, USD Million
FIG 73 Russia Energy Market, 2022 - 2033, USD Million
FIG 74 Russia Government Market, 2022 - 2033, USD Million
FIG 75 Russia Healthcare Market, 2022 - 2033, USD Million
FIG 76 Russia Manufacturing Market, 2022 - 2033, USD Million
FIG 77 Russia Other End Uses Market, 2022 - 2033, USD Million
FIG 78 Russia Retail Market, 2022 - 2033, USD Million
FIG 79 Russia Transportation & logistics Market, 2022 - 2033, USD Million
FIG 80 Spain Trade Management Software Market Market, 2022 - 2033, USD Million
FIG 81 Spain Trade Management Software Market Market by Component, 2022 - 2033, USD Million
FIG 82 Spain Services Market, 2022 - 2033, USD Million
FIG 83 Spain Solutions Market, 2022 - 2033, USD Million
FIG 84 Spain Trade Management Software Market Market by Deployment, 2022 - 2033, USD Million
FIG 85 Spain Cloud Market, 2022 - 2033, USD Million
FIG 86 Spain On-premise Market, 2022 - 2033, USD Million
FIG 87 Spain Trade Management Software Market Market by End Use, 2022 - 2033, USD Million
FIG 88 Spain Energy Market, 2022 - 2033, USD Million
FIG 89 Spain Government Market, 2022 - 2033, USD Million
FIG 90 Spain Healthcare Market, 2022 - 2033, USD Million
FIG 91 Spain Manufacturing Market, 2022 - 2033, USD Million
FIG 92 Spain Other End Uses Market, 2022 - 2033, USD Million
FIG 93 Spain Retail Market, 2022 - 2033, USD Million
FIG 94 Spain Transportation & logistics Market, 2022 - 2033, USD Million
FIG 95 Italy Trade Management Software Market Market, 2022 - 2033, USD Million
FIG 96 Italy Trade Management Software Market Market by Component, 2022 - 2033, USD Million
FIG 97 Italy Services Market, 2022 - 2033, USD Million
FIG 98 Italy Solutions Market, 2022 - 2033, USD Million
FIG 99 Italy Trade Management Software Market Market by Deployment, 2022 - 2033, USD Million
FIG 100 Italy Cloud Market, 2022 - 2033, USD Million
FIG 101 Italy On-premise Market, 2022 - 2033, USD Million
FIG 102 Italy Trade Management Software Market Market by End Use, 2022 - 2033, USD Million
FIG 103 Italy Energy Market, 2022 - 2033, USD Million
FIG 104 Italy Government Market, 2022 - 2033, USD Million
FIG 105 Italy Healthcare Market, 2022 - 2033, USD Million
FIG 106 Italy Manufacturing Market, 2022 - 2033, USD Million
FIG 107 Italy Other End Uses Market, 2022 - 2033, USD Million
FIG 108 Italy Retail Market, 2022 - 2033, USD Million
FIG 109 Italy Transportation & logistics Market, 2022 - 2033, USD Million
FIG 110 Rest of Europe Trade Management Software Market Market, 2022 - 2033, USD Million
FIG 111 Rest of Europe Trade Management Software Market Market by Component, 2022 - 2033, USD Million
FIG 112 Rest of Europe Services Market, 2022 - 2033, USD Million
FIG 113 Rest of Europe Solutions Market, 2022 - 2033, USD Million
FIG 114 Rest of Europe Trade Management Software Market Market by Deployment, 2022 - 2033, USD Million
FIG 115 Rest of Europe Cloud Market, 2022 - 2033, USD Million
FIG 116 Rest of Europe On-premise Market, 2022 - 2033, USD Million
FIG 117 Rest of Europe Trade Management Software Market Market by End Use, 2022 - 2033, USD Million
FIG 118 Rest of Europe Energy Market, 2022 - 2033, USD Million
FIG 119 Rest of Europe Government Market, 2022 - 2033, USD Million
FIG 120 Rest of Europe Healthcare Market, 2022 - 2033, USD Million
FIG 121 Rest of Europe Manufacturing Market, 2022 - 2033, USD Million
FIG 122 Rest of Europe Other End Uses Market, 2022 - 2033, USD Million FIG 123 Rest of Europe Retail Market, 2022 - 2033, USD Million
FIG 124 Rest of Europe Transportation & logistics Market, 2022 - 2033, USD Million