Europe CPQ Software Market Size, Share & Industry Analysis Report By Enterprise Size (Large Enterprises, and Small & Medium Enterprises), By Deployment (Cloud, and On-premises), By Component (Software, and Services), By End Use (Manufacturing, and IT & Telecom), By Country Outlook and Forecast, 2026 - 2033
Published Date : 02-Sep-2026 |
Pages: 320 |
Report Format: PDF + Excel |
COVID-19 Impact on the Europe CPQ Software Market
The Europe CPQ Software Market is expected to reach USD 2116.0 million by 2031, growing at a CAGR of 15.1% during (2026 – 2033).
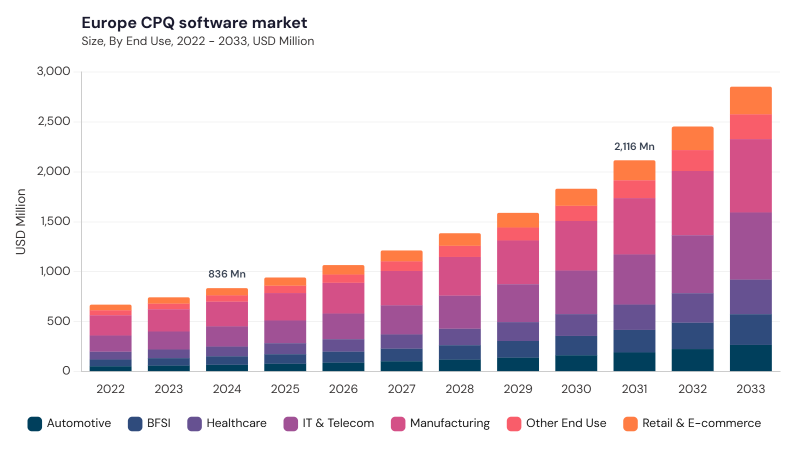
The Europe CPQ Software Market originated as enterprises faced rising complexity in managing customizable products, pricing rules, and quotation workflows. Early CPQ tools were mainly used as sales automation aids that reduced manual quote errors and accelerated simple price calculations. Over time, rule-based engines, ERP integration, CRM connectivity, and real-time configuration validation transformed CPQ platforms into more advanced sales enablement systems. The market further matured as cloud-based deployment, AI-driven recommendation engines, and compliance automation became important for distributed sales teams.
The Europe CPQ Software Market is being shaped by AI-enabled automation, compliance-centric quoting, cloud-native platforms, lifecycle-oriented sales processes, and demand for seamless ERP and CRM integration. Enterprises are adopting CPQ software to improve quotation accuracy, reduce sales-cycle delays, manage complex product portfolios, and maintain pricing consistency across multiple European jurisdictions. Demand is supported by manufacturing, IT and telecom, healthcare, BFSI, retail and e-commerce, automotive, energy, government, and professional services. Vendors are focusing on predictive pricing, compliance rule sets, embedded analytics, multilingual support, multi-currency functionality, secure data handling, and localized deployment models.
Enterprise Size Outlook
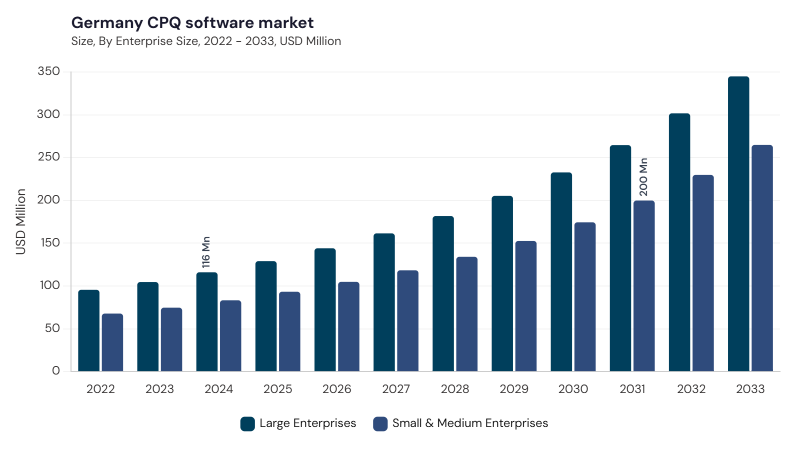
Based on Enterprise Size, the market is segmented into Large Enterprises and Small & Medium Enterprises. The Large Enterprises market dominated the Europe CPQ Software Market by Enterprise Size in 2025, and would continue to be a dominant market till 2033; thereby, achieving a market value of USD 1214.8 million by 2031, growing at a CAGR of 14.7 % during the forecast period. The Small & Medium Enterprises market is expected to witness a CAGR of 15.6% during (2026 - 2033).
Large Enterprises lead due to their need to automate complex sales operations, manage multinational product portfolios, support multi-country pricing, and integrate CPQ systems with CRM, ERP, customer experience, and analytics platforms. These organizations require scalable platforms that handle multilingual workflows, cross-border sales operations, layered approvals, and regulatory compliance. Small & Medium Enterprises remain significant as cloud-based CPQ solutions reduce upfront cost, simplify deployment, and improve sales accuracy for growing businesses. This segment benefits from SaaS delivery, user-friendly interfaces, faster implementation, flexible pricing, and the rising digitalization of European SMEs.
Deployment Outlook
Based on Deployment, the market is segmented into Cloud and On-Premises. The Cloud market dominated the Europe CPQ Software Market by Deployment in 2025, and would continue to be a dominant market till 2033; thereby, achieving a market value of USD 1335.6 million by 2031, growing at a CAGR of 15.2 % during the forecast period. The On-premises market is expected to witness a CAGR of 14.9% during (2026 - 2033).
Cloud leads due to scalability, rapid deployment, remote collaboration, lower infrastructure requirements, continuous updates, and seamless integration with enterprise business applications. Cloud CPQ platforms support distributed sales teams, real-time pricing changes, multilingual usage, and faster product configuration across European markets. On-Premises remains significant among organizations operating under strict data sovereignty, security, and industry-specific compliance requirements. This segment is preferred by enterprises with sensitive pricing data, legacy systems, customized IT environments, and internal governance needs that require stronger control over deployment and data management.
Component Outlook
Based on Component, the market is segmented into Software and Services. The Software market dominated the Europe CPQ Software Market by Component in 2025, and would continue to be a dominant market till 2033; thereby, achieving a market value of USD 1484.4 million by 2031, growing at a CAGR of 14.9 % during the forecast period. The Services market is expected to witness a CAGR of 15.7% during (2026 - 2033).
Software leads as CPQ platforms provide intelligent product configuration, automated quotation generation, dynamic pricing, guided selling, predictive analytics, approval workflows, and compliance-enabled sales automation. Demand is strengthened by AI, machine learning, cloud architecture, and integration with digital commerce ecosystems. Services remain significant as organizations require consulting, implementation, customization, system integration, user training, compliance support, and long-term technical assistance. This segment is especially important for enterprises with complex product structures, hybrid IT systems, regional compliance needs, and multi-country sales operations.
End Use Outlook
Based on End Use, the market is segmented into Manufacturing, IT & Telecom, Healthcare, BFSI, Retail & E-commerce, Automotive, and Other End Use. Manufacturing leads as European manufacturers use CPQ platforms to manage multi-variant products, complex configuration rules, customized orders, pricing consistency, and faster quotation cycles across regional and international operations. IT & Telecom remains significant due to subscription services, bundled technology offerings, cloud solutions, and complex service contracts.
Healthcare adoption is supported by medical equipment configuration, procurement workflows, and compliance requirements. BFSI uses CPQ for financial product configuration and automated proposals, while Retail & E-commerce benefits from personalization, omnichannel sales, and dynamic pricing. Automotive adoption is driven by vehicle configuration, dealer sales, parts selection, and Europe’s strong automotive manufacturing ecosystem, while Other End Use includes energy, education, government, construction, and professional services.
Free Valuable Insights: The Worldwide CPQ Software Market is projected to reach USD 10503.3 Million billion by 2033, at a CAGR of 15.3%
Country Outlook
Based on Country, the market is segmented into Germany, UK, France, Russia, Spain, Italy, and Rest of Europe. The Germany market dominated the Europe CPQ Software Market by Country in 2025, and would continue to be a dominant market till 2033; thereby, achieving a market value of USD 464.4 million by 2031, growing at a CAGR of 13.7 % during the forecast period. The UK market is expected to witness a CAGR of 14.1% during (2026 - 2033). Additionally, The France market is expected to witness a CAGR of 15.9% during (2026 - 2033).
Germany leads due to strong adoption across manufacturing, automotive, and industrial sectors where complex product configurations, pricing precision, ERP integration, and compliance alignment are essential. The UK supports market growth through hyperautomation, AI-driven quoting, cloud-native CPQ platforms, and integration with broader CRM and ERP ecosystems. France contributes through SaaS adoption, AI-enabled dynamic pricing, localization, and compliance-focused CPQ deployment. Russia, Spain, and Italy add momentum through cloud-based platforms, localized pricing rules, AI-driven automation, and integration with enterprise systems, while Rest of Europe benefits from hyperautomation, regional customization, multilingual workflows, and demand for scalable CPQ platforms across fragmented markets.
List of Key Companies Profiled
- Salesforce, Inc.
- Oracle Corporation
- SAP SE
- Conga
- PROS Holdings, Inc.
- Tacton Systems AB
- Experlogix, Inc.
- DealHub Ltd.
- Epicor Software Corporation
- Cincom Systems, Inc.
Europe CPQ Software Market Report Segmentation
By Enterprise Size
- Large Enterprises
- Small & Medium Enterprises
By Deployment
- Cloud
- On-premises
By Component
- Software
- Services
By End Use
- Manufacturing
- IT & Telecom
- Healthcare
- BFSI
- Retail & E-commerce
- Automotive
- Other End Use
By Country
- Germany
- UK
- France
- Russia
- Spain
- Italy
- Rest of Europe
1.1 Market Overview
1.2 Key Factors Impacting Market
1.2.1 Market Drivers
1.2.2 Market Restraints
1.2.3 Market Opportunities
1.2.4 Market Challenges
1.2.5 Market Trends
1.2.6 State of Competition
1.2.7 Market Consolidation
1.2.8 Key Customer Criteria
1.3 Product Life Cycle
1.4 Segmentation By Offering
1.4.1 Hardware
1.4.2 Software
1.5 Segmentation By Dimension
1.5.1 Dimensional (2D)
1.5.2 Three Dimensional (3D)
1.6 Segmentation By Application
1.6.1 Holographic Microscopy
1.6.2 Holographic Imaging
1.6.3 Holographic Telepresence
1.6.4 Other Application
1.7 Segmentation By End Use
1.7.1 Healthcare
1.7.2 Consumer Electronics
1.7.3 Aerospace & Defense
1.7.4 Automotive
1.7.5 Entertainment
1.7.6 Education
1.7.7 Other End Use
1.8 Segmentation By Country
1.8.1 Germany
1.8.1.1 Segmentation By Offering
1.8.1.1.1 Hardware
1.8.1.1.2 Software
1.8.1.2 Segmentation By Dimension
1.8.1.2.1 Two-Dimensional (2D)
1.8.1.2.2 Three-Dimensional (3D)
1.8.1.3 Segmentation By Application
1.8.1.3.1 Holographic Microscopy
1.8.1.3.2 Holographic Imaging
1.8.1.3.3 Holographic Telepresence
1.8.1.3.4 Other Application
1.8.1.4 Segmentation By End Use
1.8.1.4.1 Healthcare
1.8.1.4.2 Consumer Electronics
1.8.1.4.3 Aerospace & Defense
1.8.1.4.4 Automotive
1.8.1.4.5 Entertainment
1.8.1.4.6 Education
1.8.1.4.7 Other End Use
1.8.2 UK
1.8.2.1 Segmentation By Offering
1.8.2.1.1 Hardware
1.8.2.1.2 Software
1.8.2.2 Segmentation By Dimension
1.8.2.2.1 Two-Dimensional (2D)
1.8.2.2.2 Three-Dimensional (3D)
1.8.2.3 Segmentation By Application
1.8.2.3.1 Holographic Microscopy
1.8.2.3.2 Holographic Imaging
1.8.2.3.3 Holographic Telepresence
1.8.2.3.4 Other Application
1.8.2.4 Segmentation By End Use
1.8.2.4.1 Healthcare
1.8.2.4.2 Consumer Electronics
1.8.2.4.3 Aerospace & Defense
1.8.2.4.4 Automotive
1.8.2.4.5 Entertainment
1.8.2.4.6 Education
1.8.2.4.7 Other End Use
1.8.3 France
1.8.3.1 Segmentation By Offering
1.8.3.1.1 Hardware
1.8.3.1.2 Software
1.8.3.2 Segmentation By Dimension
1.8.3.2.1 Two-Dimensional (2D)
1.8.3.2.2 Three-Dimensional (3D)
1.8.3.3 Segmentation By Application
1.8.3.3.1 Holographic Microscopy
1.8.3.3.2 Holographic Imaging
1.8.3.3.3 Holographic Telepresence
1.8.3.3.4 Other Application
1.8.3.4 Segmentation By End Use
1.8.3.4.1 Healthcare
1.8.3.4.2 Consumer Electronics
1.8.3.4.3 Aerospace & Defense
1.8.3.4.4 Automotive
1.8.3.4.5 Entertainment
1.8.3.4.6 Education
1.8.3.4.7 Other End Use
1.8.4 Russia
1.8.4.1 Segmentation By Offering
1.8.4.1.1 Hardware
1.8.4.1.2 Software
1.8.4.2 Segmentation By Dimension
1.8.4.2.1 Two-Dimensional (2D)
1.8.4.2.2 Three-Dimensional (3D)
1.8.4.3 Segmentation By Application
1.8.4.3.1 Holographic Microscopy
1.8.4.3.2 Holographic Imaging
1.8.4.3.3 Holographic Telepresence
1.8.4.3.4 Other Application
1.8.4.4 Segmentation By End Use
1.8.4.4.1 Healthcare
1.8.4.4.2 Consumer Electronics
1.8.4.4.3 Aerospace & Defense
1.8.4.4.4 Automotive
1.8.4.4.5 Entertainment
1.8.4.4.6 Education
1.8.4.4.7 Other End Use
1.8.5 Spain
1.8.5.1 Segmentation By Offering
1.8.5.1.1 Hardware
1.8.5.1.2 Software
1.8.5.2 Segmentation By Dimension
1.8.5.2.1 Two-Dimensional (2D)
1.8.5.2.2 Three-Dimensional (3D)
1.8.5.3 Segmentation By Application
1.8.5.3.1 Holographic Microscopy
1.8.5.3.2 Holographic Imaging
1.8.5.3.3 Holographic Telepresence
1.8.5.3.4 Other Application
1.8.5.4 Segmentation By End Use
1.8.5.4.1 Healthcare
1.8.5.4.2 Consumer Electronics
1.8.5.4.3 Aerospace & Defense
1.8.5.4.4 Automotive
1.8.5.4.5 Entertainment
1.8.5.4.6 Education
1.8.5.4.7 Other End Use
1.8.6 Italy
1.8.6.1 Segmentation By Offering
1.8.6.1.1 Hardware
1.8.6.1.2 Software
1.8.6.2 Segmentation By Dimension
1.8.6.2.1 Two-Dimensional (2D)
1.8.6.2.2 Three-Dimensional (3D)
1.8.6.3 Segmentation By Application
1.8.6.3.1 Holographic Microscopy
1.8.6.3.2 Holographic Imaging
1.8.6.3.3 Holographic Telepresence
1.8.6.3.4 Other Application
1.8.6.4 Segmentation By End Use
1.8.6.4.1 Healthcare
1.8.6.4.2 Consumer Electronics
1.8.6.4.3 Aerospace & Defense
1.8.6.4.4 Automotive
1.8.6.4.5 Entertainment
1.8.6.4.6 Education
1.8.6.4.7 Other End Use
1.8.7 Rest of Europe
1.8.7.1 Segmentation By Offering
1.8.7.1.1 Hardware
1.8.7.1.2 Software
1.8.7.2 Segmentation By Dimension
1.8.7.2.1 Two-Dimensional (2D)
1.8.7.2.2 Three-Dimensional (3D)
1.8.7.3 Segmentation By Application
1.8.7.3.1 Holographic Microscopy
1.8.7.3.2 Holographic Imaging
1.8.7.3.3 Holographic Telepresence
1.8.7.3.4 Other Application
1.8.7.4 Segmentation By End Use
1.8.7.4.1 Healthcare
1.8.7.4.2 Consumer Electronics
1.8.7.4.3 Aerospace & Defense
1.8.7.4.4 Automotive
1.8.7.4.5 Entertainment
1.8.7.4.6 Education
1.8.7.4.7 Other End Use
Chapter 2. Company Snapshots
2.1 Tomocube, Inc.
2.1.1 Business Overview
2.1.2 Key Information
2.1.3 Company Focus
2.1.4 Strategic Insights
2.1.5 Strategy Deployed
2.1.6 Product & Service Portfolio
2.1.7 Capability Overview
2.1.8 Technology & Innovation Focus
2.1.9 SWOT Analysis
2.1.10 Customers / End Users
2.1.11 Competitive Positioning
2.1.12 Key Differentiators
2.1.13 Portfolio Matrix
2.1.14 Analyst View
2.1.15 Future Outlook
2.2 Phase Holographic Imaging PHI AB
2.2.1 Business Overview
2.2.2 Key Information
2.2.3 Company Focus on Digital Holography Market
2.2.4 Strategic Insights
2.2.5 Strategy Deployed
2.2.6 Product & Service Portfolio
2.2.7 Representative Products
2.2.8 Capability Overview
2.2.9 Technology & Innovation Focus
2.2.10 SWOT Analysis
2.2.11 Customers / End Users
2.2.12 Competitive Positioning
2.2.13 Key Differentiators
2.2.14 Portfolio Matrix
2.2.15 Analyst View
2.2.16 Future Outlook
2.3 Nanolive SA
2.3.1 Business Overview
2.3.2 Key Information
2.3.3 Company Focus on Digital Holography Market
2.3.4 Strategic Insights
2.3.5 Strategy Deployed
2.3.6 Product & Service Portfolio
2.3.7 Representative Products
2.3.8 Capability Overview
2.3.9 Technology & Innovation Focus
2.3.10 SWOT Analysis
2.3.11 Customers / End Users
2.3.12 Competitive Positioning
2.3.13 Key Differentiators
2.3.14 Portfolio Matrix
2.3.15 Analyst View
2.3.16 Future Outlook
2.4 Park Systems Corporation
2.4.1 Business Overview
2.4.2 Key Information
2.4.3 Company Focus on Digital Holography Market
2.4.4 Strategic Insights
2.4.5 Strategy Deployed
2.4.6 Product & Service Portfolio
2.4.7 Representative Products
2.4.8 Capability Overview
2.4.9 Technology & Innovation Focus
2.4.10 SWOT Analysis
2.4.11 Customers / End Users
2.4.12 Competitive Positioning
2.4.13 Key Differentiators
2.4.14 Portfolio Matrix
2.4.15 Analyst View
2.4.16 Future Outlook
2.5 Ovizio Imaging Systems SA
2.5.1 Business Overview
2.5.2 Key Information
2.5.3 Company Focus on Digital Holography Market 2.5.4 Strategic Insights
2.5.5 Strategy Deployed
2.5.6 Product & Service Portfolio
2.5.7 Portfolio Categories
2.5.8 Representative Products
2.5.9 Capability Overview
2.5.10 Technology & Innovation Focus
2.5.11 SWOT Analysis
2.5.12 Customers / End Users
2.5.13 Competitive Positioning
2.5.14 Key Differentiators
2.5.15 Portfolio Matrix
2.5.16 Analyst View
2.5.17 Future Outlook
2.6 Holoxica Limited
2.6.1 Business Overview
2.6.2 Key Information
2.6.3 Company Focus on Digital Holography Market
2.6.4 Strategic Insights
2.6.5 Strategy Deployed
2.6.6 Product & Service Portfolio
2.6.7 Representative Products
2.6.8 Capability Overview
2.6.9 Technology & Innovation Focus
2.6.10 SWOT Analysis
2.6.11 Customers / End Users
2.6.12 Competitive Positioning
2.6.13 Key Differentiators
2.6.14 Portfolio Matrix
2.6.15 Analyst View
2.6.16 Future Outlook
2.7 RealView Imaging Ltd.
2.7.1 Business Overview
2.7.2 Key Information
2.7.3 Company Focus on Digital Holography Market
2.7.4 Strategic Insights
2.7.5 Strategy Deployed
2.7.6 Product & Service Portfolio
2.7.7 Representative Products
2.7.8 Capability Overview
2.7.9 Technology & Innovation Focus
2.7.10 SWOT Analysis
2.7.11 Customers / End Users
2.7.12 Competitive Positioning
2.7.13 Key Differentiators
2.7.14 Portfolio Matrix
2.7.15 Analyst View
2.7.16 Future Outlook
2.8 Geola Digital UAB
2.8.1 Business Overview
2.8.2 Key Information
2.8.3 Company Focus on Digital Holography Market
2.8.4 Strategic Insights
2.8.5 Strategy Deployed
2.8.6 Product & Service Portfolio
2.8.7 Representative Products
2.8.8 Capability Overview
2.8.9 Technology & Innovation Focus
2.8.10 SWOT Analysis
2.8.11 Customers / End Users
2.8.12 Competitive Positioning
2.8.13 key Differentiators
2.8.14 Portfolio Matrix
2.8.15 Analyst View
2.8.16 Future Outlook
2.9 Light Logics Holography and Optics Pvt. Ltd.
2.9.1 Business Overview
2.9.2 Key Information
2.9.3 Company Focus on Digital Holography Market
2.9.4 Strategic Insights
2.9.5 Strategy Deployed
2.9.6 Product & Service Portfolio
2.9.7 Representative Products
2.9.8 Capability Overview
2.9.9 Technology & Innovation Focus
2.9.10 SWOT Analysis
2.9.11 Customers / End Users
2.9.12 Competitive Positioning
2.9.13 Key Differentiators
2.9.14 Portfolio Matrix
2.9.15 Analyst View
2.9.16 Future Outlook
2.10 MetroLaser, Inc.
2.10.1 Business Overview
2.10.2 Key Information
2.10.3 Company Focus on Digital Holography Market
2.10.4 Strategic Insights
2.10.5 Strategy Deployed
2.10.6 Product & Service Portfolio
2.10.7 Representative Products
2.10.8 Capability Overview
2.10.9 Technology & Innovation Focus
2.10.10 SWOT Analysis
2.10.11 Customers / End Users
2.10.12 Competitive Positioning
2.10.13 Key Differentiators
2.10.14 Portfolio Matrix
2.10.15 Analyst View
2.10.16 Future Outlook
Table 1 Europe Digital Holography Market Market, 2022 - 2033, USD Million
Table 2 Europe Digital Holography Market Market by Application, 2022 - 2033, USD Million
Table 3 Europe Holographic Imaging Market, 2022 - 2033, USD Million
Table 4 Europe Holographic Microscopy Market, 2022 - 2033, USD Million
Table 5 Europe Holographic Telepresence Market, 2022 - 2033, USD Million
Table 6 Europe Other Application Market, 2022 - 2033, USD Million
Table 7 Europe Digital Holography Market Market by Dimension, 2022 - 2033, USD Million
Table 8 Europe Three Dimensional (3D) Market, 2022 - 2033, USD Million
Table 9 Europe Two Dimensional (2D) Market, 2022 - 2033, USD Million
Table 10 Europe Digital Holography Market Market by End Use, 2022 - 2033, USD Million
Table 11 Europe Aerospace & Defense Market, 2022 - 2033, USD Million
Table 12 Europe Automotive Market, 2022 - 2033, USD Million
Table 13 Europe Consumer Electronics Market, 2022 - 2033, USD Million
Table 14 Europe Education Market, 2022 - 2033, USD Million
Table 15 Europe Entertainment Market, 2022 - 2033, USD Million
Table 16 Europe Healthcare Market, 2022 - 2033, USD Million
Table 17 Europe Other End Use Market, 2022 - 2033, USD Million
Table 18 Europe Digital Holography Market Market by Offering, 2022 - 2033, USD Million
Table 19 Europe Hardware Market, 2022 - 2033, USD Million
Table 20 Europe Software Market, 2022 - 2033, USD Million
Table 21 Germany Digital Holography Market Market, 2022 - 2033, USD Million
Table 22 Germany Digital Holography Market Market by Application, 2022 - 2033, USD Million
Table 23 Germany Holographic Imaging Market, 2022 - 2033, USD Million
Table 24 Germany Holographic Microscopy Market, 2022 - 2033, USD Million
Table 25 Germany Holographic Telepresence Market, 2022 - 2033, USD Million
Table 26 Germany Other Application Market, 2022 - 2033, USD Million
Table 27 Germany Digital Holography Market Market by Dimension, 2022 - 2033, USD Million
Table 28 Germany Three Dimensional (3D) Market, 2022 - 2033, USD Million
Table 29 Germany Two Dimensional (2D) Market, 2022 - 2033, USD Million
Table 30 Germany Digital Holography Market Market by End Use, 2022 - 2033, USD Million
Table 31 Germany Aerospace & Defense Market, 2022 - 2033, USD Million
Table 32 Germany Automotive Market, 2022 - 2033, USD Million
Table 33 Germany Consumer Electronics Market, 2022 - 2033, USD Million
Table 34 Germany Education Market, 2022 - 2033, USD Million
Table 35 Germany Entertainment Market, 2022 - 2033, USD Million
Table 36 Germany Healthcare Market, 2022 - 2033, USD Million
Table 37 Germany Other End Use Market, 2022 - 2033, USD Million
Table 38 Germany Digital Holography Market Market by Offering, 2022 - 2033, USD Million
Table 39 Germany Hardware Market, 2022 - 2033, USD Million
Table 40 Germany Software Market, 2022 - 2033, USD Million
Table 41 United Kingdom Digital Holography Market Market, 2022 - 2033, USD Million
Table 42 United Kingdom Digital Holography Market Market by Application, 2022 - 2033, USD Million
Table 43 United Kingdom Holographic Imaging Market, 2022 - 2033, USD Million
Table 44 United Kingdom Holographic Microscopy Market, 2022 - 2033, USD Million
Table 45 United Kingdom Holographic Telepresence Market, 2022 - 2033, USD Million
Table 46 United Kingdom Other Application Market, 2022 - 2033, USD Million
Table 47 United Kingdom Digital Holography Market Market by Dimension, 2022 - 2033, USD Million
Table 48 United Kingdom Three Dimensional (3D) Market, 2022 - 2033, USD Million
Table 49 United Kingdom Two Dimensional (2D) Market, 2022 - 2033, USD Million
Table 50 United Kingdom Digital Holography Market Market by End Use, 2022 - 2033, USD Million
Table 51 United Kingdom Aerospace & Defense Market, 2022 - 2033, USD Million
Table 52 United Kingdom Automotive Market, 2022 - 2033, USD Million
Table 53 United Kingdom Consumer Electronics Market, 2022 - 2033, USD Million
Table 54 United Kingdom Education Market, 2022 - 2033, USD Million
Table 55 United Kingdom Entertainment Market, 2022 - 2033, USD Million
Table 56 United Kingdom Healthcare Market, 2022 - 2033, USD Million
Table 57 United Kingdom Other End Use Market, 2022 - 2033, USD Million
Table 58 United Kingdom Digital Holography Market Market by Offering, 2022 - 2033, USD Million
Table 59 United Kingdom Hardware Market, 2022 - 2033, USD Million
Table 60 United Kingdom Software Market, 2022 - 2033, USD Million
Table 61 France Digital Holography Market Market, 2022 - 2033, USD Million
Table 62 France Digital Holography Market Market by Application, 2022 - 2033, USD Million
Table 63 France Holographic Imaging Market, 2022 - 2033, USD Million
Table 64 France Holographic Microscopy Market, 2022 - 2033, USD Million
Table 65 France Holographic Telepresence Market, 2022 - 2033, USD Million
Table 66 France Other Application Market, 2022 - 2033, USD Million
Table 67 France Digital Holography Market Market by Dimension, 2022 - 2033, USD Million
Table 68 France Three Dimensional (3D) Market, 2022 - 2033, USD Million
Table 69 France Two Dimensional (2D) Market, 2022 - 2033, USD Million
Table 70 France Digital Holography Market Market by End Use, 2022 - 2033, USD Million
Table 71 France Aerospace & Defense Market, 2022 - 2033, USD Million
Table 72 France Automotive Market, 2022 - 2033, USD Million
Table 73 France Consumer Electronics Market, 2022 - 2033, USD Million
Table 74 France Education Market, 2022 - 2033, USD Million
Table 75 France Entertainment Market, 2022 - 2033, USD Million
Table 76 France Healthcare Market, 2022 - 2033, USD Million
Table 77 France Other End Use Market, 2022 - 2033, USD Million
Table 78 France Digital Holography Market Market by Offering, 2022 - 2033, USD Million
Table 79 France Hardware Market, 2022 - 2033, USD Million
Table 80 France Software Market, 2022 - 2033, USD Million
Table 81 Russia Digital Holography Market Market, 2022 - 2033, USD Million
Table 82 Russia Digital Holography Market Market by Application, 2022 - 2033, USD Million
Table 83 Russia Holographic Imaging Market, 2022 - 2033, USD Million
Table 84 Russia Holographic Microscopy Market, 2022 - 2033, USD Million
Table 85 Russia Holographic Telepresence Market, 2022 - 2033, USD Million
Table 86 Russia Other Application Market, 2022 - 2033, USD Million
Table 87 Russia Digital Holography Market Market by Dimension, 2022 - 2033, USD Million
Table 88 Russia Three Dimensional (3D) Market, 2022 - 2033, USD Million
Table 89 Russia Two Dimensional (2D) Market, 2022 - 2033, USD Million
Table 90 Russia Digital Holography Market Market by End Use, 2022 - 2033, USD Million
Table 91 Russia Aerospace & Defense Market, 2022 - 2033, USD Million
Table 92 Russia Automotive Market, 2022 - 2033, USD Million
Table 93 Russia Consumer Electronics Market, 2022 - 2033, USD Million
Table 94 Russia Education Market, 2022 - 2033, USD Million
Table 95 Russia Entertainment Market, 2022 - 2033, USD Million
Table 96 Russia Healthcare Market, 2022 - 2033, USD Million
Table 97 Russia Other End Use Market, 2022 - 2033, USD Million
Table 98 Russia Digital Holography Market Market by Offering, 2022 - 2033, USD Million
Table 99 Russia Hardware Market, 2022 - 2033, USD Million
Table 100 Russia Software Market, 2022 - 2033, USD Million
Table 101 Spain Digital Holography Market Market, 2022 - 2033, USD Million
Table 102 Spain Digital Holography Market Market by Application, 2022 - 2033, USD Million
Table 103 Spain Holographic Imaging Market, 2022 - 2033, USD Million
Table 104 Spain Holographic Microscopy Market, 2022 - 2033, USD Million
Table 105 Spain Holographic Telepresence Market, 2022 - 2033, USD Million
Table 106 Spain Other Application Market, 2022 - 2033, USD Million
Table 107 Spain Digital Holography Market Market by Dimension, 2022 - 2033, USD Million
Table 108 Spain Three Dimensional (3D) Market, 2022 - 2033, USD Million
Table 109 Spain Two Dimensional (2D) Market, 2022 - 2033, USD Million
Table 110 Spain Digital Holography Market Market by End Use, 2022 - 2033, USD Million
Table 111 Spain Aerospace & Defense Market, 2022 - 2033, USD Million
Table 112 Spain Automotive Market, 2022 - 2033, USD Million
Table 113 Spain Consumer Electronics Market, 2022 - 2033, USD Million
Table 114 Spain Education Market, 2022 - 2033, USD Million
Table 115 Spain Entertainment Market, 2022 - 2033, USD Million
Table 116 Spain Healthcare Market, 2022 - 2033, USD Million
Table 117 Spain Other End Use Market, 2022 - 2033, USD Million
Table 118 Spain Digital Holography Market Market by Offering, 2022 - 2033, USD Million
Table 119 Spain Hardware Market, 2022 - 2033, USD Million
Table 120 Spain Software Market, 2022 - 2033, USD Million
Table 121 Italy Digital Holography Market Market, 2022 - 2033, USD Million
Table 122 Italy Digital Holography Market Market by Application, 2022 - 2033, USD Million
Table 123 Italy Holographic Imaging Market, 2022 - 2033, USD Million
Table 124 Italy Holographic Microscopy Market, 2022 - 2033, USD Million
Table 125 Italy Holographic Telepresence Market, 2022 - 2033, USD Million
Table 126 Italy Other Application Market, 2022 - 2033, USD Million
Table 127 Italy Digital Holography Market Market by Dimension, 2022 - 2033, USD Million
Table 128 Italy Three Dimensional (3D) Market, 2022 - 2033, USD Million
Table 129 Italy Two Dimensional (2D) Market, 2022 - 2033, USD Million
Table 130 Italy Digital Holography Market Market by End Use, 2022 - 2033, USD Million
Table 131 Italy Aerospace & Defense Market, 2022 - 2033, USD Million
Table 132 Italy Automotive Market, 2022 - 2033, USD Million
Table 133 Italy Consumer Electronics Market, 2022 - 2033, USD Million
Table 134 Italy Education Market, 2022 - 2033, USD Million
Table 135 Italy Entertainment Market, 2022 - 2033, USD Million
Table 136 Italy Healthcare Market, 2022 - 2033, USD Million
Table 137 Italy Other End Use Market, 2022 - 2033, USD Million
Table 138 Italy Digital Holography Market Market by Offering, 2022 - 2033, USD Million
Table 139 Italy Hardware Market, 2022 - 2033, USD Million
Table 140 Italy Software Market, 2022 - 2033, USD Million
Table 141 Rest of Europe Digital Holography Market Market, 2022 - 2033, USD Million
Table 142 Rest of Europe Digital Holography Market Market by Application, 2022 - 2033, USD Million
Table 143 Rest of Europe Holographic Imaging Market, 2022 - 2033, USD Million
Table 144 Rest of Europe Holographic Microscopy Market, 2022 - 2033, USD Million
Table 145 Rest of Europe Holographic Telepresence Market, 2022 - 2033, USD Million
Table 146 Rest of Europe Other Application Market, 2022 - 2033, USD Million
Table 147 Rest of Europe Digital Holography Market Market by Dimension, 2022 - 2033, USD Million
Table 148 Rest of Europe Three Dimensional (3D) Market, 2022 - 2033, USD Million
Table 149 Rest of Europe Two Dimensional (2D) Market, 2022 - 2033, USD Million
Table 150 Rest of Europe Digital Holography Market Market by End Use, 2022 - 2033, USD Million
Table 151 Rest of Europe Aerospace & Defense Market, 2022 - 2033, USD Million
Table 152 Rest of Europe Automotive Market, 2022 - 2033, USD Million
Table 153 Rest of Europe Consumer Electronics Market, 2022 - 2033, USD Million
Table 154 Rest of Europe Education Market, 2022 - 2033, USD Million
Table 155 Rest of Europe Entertainment Market, 2022 - 2033, USD Million
Table 156 Rest of Europe Healthcare Market, 2022 - 2033, USD Million
Table 157 Rest of Europe Other End Use Market, 2022 - 2033, USD Million
Table 158 Rest of Europe Digital Holography Market Market by Offering, 2022 - 2033, USD Million
Table 159 Rest of Europe Hardware Market, 2022 - 2033, USD Million
Table 160 Rest of Europe Software Market, 2022 - 2033, USD Million
List of Figures
FIG 1 Key Factors Impacting Market
FIG 2 Market Consolidation
FIG 3 Key Customer Criteria
FIG 4 Product Life Cycle
FIG 5 Europe Digital Holography Market Market, 2022 - 2033, USD Million
FIG 6 Europe Digital Holography Market Market by Application, 2022 - 2033, USD Million
FIG 7 Europe Holographic Imaging Market, 2022 - 2033, USD Million
FIG 8 Europe Holographic Microscopy Market, 2022 - 2033, USD Million
FIG 9 Europe Holographic Telepresence Market, 2022 - 2033, USD Million
FIG 10 Europe Other Application Market, 2022 - 2033, USD Million
FIG 11 Europe Digital Holography Market Market by Dimension, 2022 - 2033, USD Million
FIG 12 Europe Three Dimensional (3D) Market, 2022 - 2033, USD Million
FIG 13 Europe Two Dimensional (2D) Market, 2022 - 2033, USD Million
FIG 14 Europe Digital Holography Market Market by End Use, 2022 - 2033, USD Million
FIG 15 Europe Aerospace & Defense Market, 2022 - 2033, USD Million
FIG 16 Europe Automotive Market, 2022 - 2033, USD Million
FIG 17 Europe Consumer Electronics Market, 2022 - 2033, USD Million
FIG 18 Europe Education Market, 2022 - 2033, USD Million
FIG 19 Europe Entertainment Market, 2022 - 2033, USD Million
FIG 20 Europe Healthcare Market, 2022 - 2033, USD Million
FIG 21 Europe Other End Use Market, 2022 - 2033, USD Million
FIG 22 Europe Digital Holography Market Market by Offering, 2022 - 2033, USD Million
FIG 23 Europe Hardware Market, 2022 - 2033, USD Million
FIG 24 Europe Software Market, 2022 - 2033, USD Million
FIG 25 Germany Digital Holography Market Market, 2022 - 2033, USD Million
FIG 26 Germany Digital Holography Market Market by Application, 2022 - 2033, USD Million
FIG 27 Germany Holographic Imaging Market, 2022 - 2033, USD Million
FIG 28 Germany Holographic Microscopy Market, 2022 - 2033, USD Million
FIG 29 Germany Holographic Telepresence Market, 2022 - 2033, USD Million
FIG 30 Germany Other Application Market, 2022 - 2033, USD Million
FIG 31 Germany Digital Holography Market Market by Dimension, 2022 - 2033, USD Million
FIG 32 Germany Three Dimensional (3D) Market, 2022 - 2033, USD Million
FIG 33 Germany Two Dimensional (2D) Market, 2022 - 2033, USD Million
FIG 34 Germany Digital Holography Market Market by End Use, 2022 - 2033, USD Million
FIG 35 Germany Aerospace & Defense Market, 2022 - 2033, USD Million
FIG 36 Germany Automotive Market, 2022 - 2033, USD Million
FIG 37 Germany Consumer Electronics Market, 2022 - 2033, USD Million
FIG 38 Germany Education Market, 2022 - 2033, USD Million
FIG 39 Germany Entertainment Market, 2022 - 2033, USD Million
FIG 40 Germany Healthcare Market, 2022 - 2033, USD Million
FIG 41 Germany Other End Use Market, 2022 - 2033, USD Million
FIG 42 Germany Digital Holography Market Market by Offering, 2022 - 2033, USD Million
FIG 43 Germany Hardware Market, 2022 - 2033, USD Million
FIG 44 Germany Software Market, 2022 - 2033, USD Million
FIG 45 United Kingdom Digital Holography Market Market, 2022 - 2033, USD Million
FIG 46 United Kingdom Digital Holography Market Market by Application, 2022 - 2033, USD Million
FIG 47 United Kingdom Holographic Imaging Market, 2022 - 2033, USD Million
FIG 48 United Kingdom Holographic Microscopy Market, 2022 - 2033, USD Million
FIG 49 United Kingdom Holographic Telepresence Market, 2022 - 2033, USD Million
FIG 50 United Kingdom Other Application Market, 2022 - 2033, USD Million
FIG 51 United Kingdom Digital Holography Market Market by Dimension, 2022 - 2033, USD Million
FIG 52 United Kingdom Three Dimensional (3D) Market, 2022 - 2033, USD Million
FIG 53 United Kingdom Two Dimensional (2D) Market, 2022 - 2033, USD Million
FIG 54 United Kingdom Digital Holography Market Market by End Use, 2022 - 2033, USD Million
FIG 55 United Kingdom Aerospace & Defense Market, 2022 - 2033, USD Million
FIG 56 United Kingdom Automotive Market, 2022 - 2033, USD Million
FIG 57 United Kingdom Consumer Electronics Market, 2022 - 2033, USD Million
FIG 58 United Kingdom Education Market, 2022 - 2033, USD Million
FIG 59 United Kingdom Entertainment Market, 2022 - 2033, USD Million
FIG 60 United Kingdom Healthcare Market, 2022 - 2033, USD Million
FIG 61 United Kingdom Other End Use Market, 2022 - 2033, USD Million
FIG 62 United Kingdom Digital Holography Market Market by Offering, 2022 - 2033, USD Million
FIG 63 United Kingdom Hardware Market, 2022 - 2033, USD Million
FIG 64 United Kingdom Software Market, 2022 - 2033, USD Million
FIG 65 France Digital Holography Market Market, 2022 - 2033, USD Million
FIG 66 France Digital Holography Market Market by Application, 2022 - 2033, USD Million
FIG 67 France Holographic Imaging Market, 2022 - 2033, USD Million
FIG 68 France Holographic Microscopy Market, 2022 - 2033, USD Million
FIG 69 France Holographic Telepresence Market, 2022 - 2033, USD Million
FIG 70 France Other Application Market, 2022 - 2033, USD Million
FIG 71 France Digital Holography Market Market by Dimension, 2022 - 2033, USD Million
FIG 72 France Three Dimensional (3D) Market, 2022 - 2033, USD Million
FIG 73 France Two Dimensional (2D) Market, 2022 - 2033, USD Million
FIG 74 France Digital Holography Market Market by End Use, 2022 - 2033, USD Million
FIG 75 France Aerospace & Defense Market, 2022 - 2033, USD Million
FIG 76 France Automotive Market, 2022 - 2033, USD Million
FIG 77 France Consumer Electronics Market, 2022 - 2033, USD Million
FIG 78 France Education Market, 2022 - 2033, USD Million
FIG 79 France Entertainment Market, 2022 - 2033, USD Million
FIG 80 France Healthcare Market, 2022 - 2033, USD Million
FIG 81 France Other End Use Market, 2022 - 2033, USD Million
FIG 82 France Digital Holography Market Market by Offering, 2022 - 2033, USD Million FIG 83 France Hardware Market, 2022 - 2033, USD Million
FIG 84 France Software Market, 2022 - 2033, USD Million
FIG 85 Russia Digital Holography Market Market, 2022 - 2033, USD Million
FIG 86 Russia Digital Holography Market Market by Application, 2022 - 2033, USD Million
FIG 87 Russia Holographic Imaging Market, 2022 - 2033, USD Million
FIG 88 Russia Holographic Microscopy Market, 2022 - 2033, USD Million
FIG 89 Russia Holographic Telepresence Market, 2022 - 2033, USD Million
FIG 90 Russia Other Application Market, 2022 - 2033, USD Million
FIG 91 Russia Digital Holography Market Market by Dimension, 2022 - 2033, USD Million
FIG 92 Russia Three Dimensional (3D) Market, 2022 - 2033, USD Million
FIG 93 Russia Two Dimensional (2D) Market, 2022 - 2033, USD Million
FIG 94 Russia Digital Holography Market Market by End Use, 2022 - 2033, USD Million
FIG 95 Russia Aerospace & Defense Market, 2022 - 2033, USD Million
FIG 96 Russia Automotive Market, 2022 - 2033, USD Million
FIG 97 Russia Consumer Electronics Market, 2022 - 2033, USD Million
FIG 98 Russia Education Market, 2022 - 2033, USD Million
FIG 99 Russia Entertainment Market, 2022 - 2033, USD Million
FIG 100 Russia Healthcare Market, 2022 - 2033, USD Million
FIG 101 Russia Other End Use Market, 2022 - 2033, USD Million
FIG 102 Russia Digital Holography Market Market by Offering, 2022 - 2033, USD Million
FIG 103 Russia Hardware Market, 2022 - 2033, USD Million
FIG 104 Russia Software Market, 2022 - 2033, USD Million
FIG 105 Spain Digital Holography Market Market, 2022 - 2033, USD Million
FIG 106 Spain Digital Holography Market Market by Application, 2022 - 2033, USD Million
FIG 107 Spain Holographic Imaging Market, 2022 - 2033, USD Million
FIG 108 Spain Holographic Microscopy Market, 2022 - 2033, USD Million
FIG 109 Spain Holographic Telepresence Market, 2022 - 2033, USD Million
FIG 110 Spain Other Application Market, 2022 - 2033, USD Million
FIG 111 Spain Digital Holography Market Market by Dimension, 2022 - 2033, USD Million
FIG 112 Spain Three Dimensional (3D) Market, 2022 - 2033, USD Million
FIG 113 Spain Two Dimensional (2D) Market, 2022 - 2033, USD Million
FIG 114 Spain Digital Holography Market Market by End Use, 2022 - 2033, USD Million
FIG 115 Spain Aerospace & Defense Market, 2022 - 2033, USD Million
FIG 116 Spain Automotive Market, 2022 - 2033, USD Million
FIG 117 Spain Consumer Electronics Market, 2022 - 2033, USD Million
FIG 118 Spain Education Market, 2022 - 2033, USD Million
FIG 119 Spain Entertainment Market, 2022 - 2033, USD Million
FIG 120 Spain Healthcare Market, 2022 - 2033, USD Million
FIG 121 Spain Other End Use Market, 2022 - 2033, USD Million
FIG 122 Spain Digital Holography Market Market by Offering, 2022 - 2033, USD Million
FIG 123 Spain Hardware Market, 2022 - 2033, USD Million
FIG 124 Spain Software Market, 2022 - 2033, USD Million
FIG 125 Italy Digital Holography Market Market, 2022 - 2033, USD Million
FIG 126 Italy Digital Holography Market Market by Application, 2022 - 2033, USD Million
FIG 127 Italy Holographic Imaging Market, 2022 - 2033, USD Million
FIG 128 Italy Holographic Microscopy Market, 2022 - 2033, USD Million
FIG 129 Italy Holographic Telepresence Market, 2022 - 2033, USD Million
FIG 130 Italy Other Application Market, 2022 - 2033, USD Million
FIG 131 Italy Digital Holography Market Market by Dimension, 2022 - 2033, USD Million
FIG 132 Italy Three Dimensional (3D) Market, 2022 - 2033, USD Million
FIG 133 Italy Two Dimensional (2D) Market, 2022 - 2033, USD Million
FIG 134 Italy Digital Holography Market Market by End Use, 2022 - 2033, USD Million
FIG 135 Italy Aerospace & Defense Market, 2022 - 2033, USD Million
FIG 136 Italy Automotive Market, 2022 - 2033, USD Million
FIG 137 Italy Consumer Electronics Market, 2022 - 2033, USD Million
FIG 138 Italy Education Market, 2022 - 2033, USD Million
FIG 139 Italy Entertainment Market, 2022 - 2033, USD Million
FIG 140 Italy Healthcare Market, 2022 - 2033, USD Million
FIG 141 Italy Other End Use Market, 2022 - 2033, USD Million
FIG 142 Italy Digital Holography Market Market by Offering, 2022 - 2033, USD Million
FIG 143 Italy Hardware Market, 2022 - 2033, USD Million
FIG 144 Italy Software Market, 2022 - 2033, USD Million
FIG 145 Rest of Europe Digital Holography Market Market, 2022 - 2033, USD Million
FIG 146 Rest of Europe Digital Holography Market Market by Application, 2022 - 2033, USD Million
FIG 147 Rest of Europe Holographic Imaging Market, 2022 - 2033, USD Million
FIG 148 Rest of Europe Holographic Microscopy Market, 2022 - 2033, USD Million
FIG 149 Rest of Europe Holographic Telepresence Market, 2022 - 2033, USD Million
FIG 150 Rest of Europe Other Application Market, 2022 - 2033, USD Million
FIG 151 Rest of Europe Digital Holography Market Market by Dimension, 2022 - 2033, USD Million
FIG 152 Rest of Europe Three Dimensional (3D) Market, 2022 - 2033, USD Million
FIG 153 Rest of Europe Two Dimensional (2D) Market, 2022 - 2033, USD Million
FIG 154 Rest of Europe Digital Holography Market Market by End Use, 2022 - 2033, USD Million
FIG 155 Rest of Europe Aerospace & Defense Market, 2022 - 2033, USD Million
FIG 156 Rest of Europe Automotive Market, 2022 - 2033, USD Million
FIG 157 Rest of Europe Consumer Electronics Market, 2022 - 2033, USD Million
FIG 158 Rest of Europe Education Market, 2022 - 2033, USD Million
FIG 159 Rest of Europe Entertainment Market, 2022 - 2033, USD Million
FIG 160 Rest of Europe Healthcare Market, 2022 - 2033, USD Million
FIG 161 Rest of Europe Other End Use Market, 2022 - 2033, USD Million
FIG 162 Rest of Europe Digital Holography Market Market by Offering, 2022 - 2033, USD Million
FIG 163 Rest of Europe Hardware Market, 2022 - 2033, USD Million
FIG 164 Rest of Europe Software Market, 2022 - 2033, USD Million